 Duplex
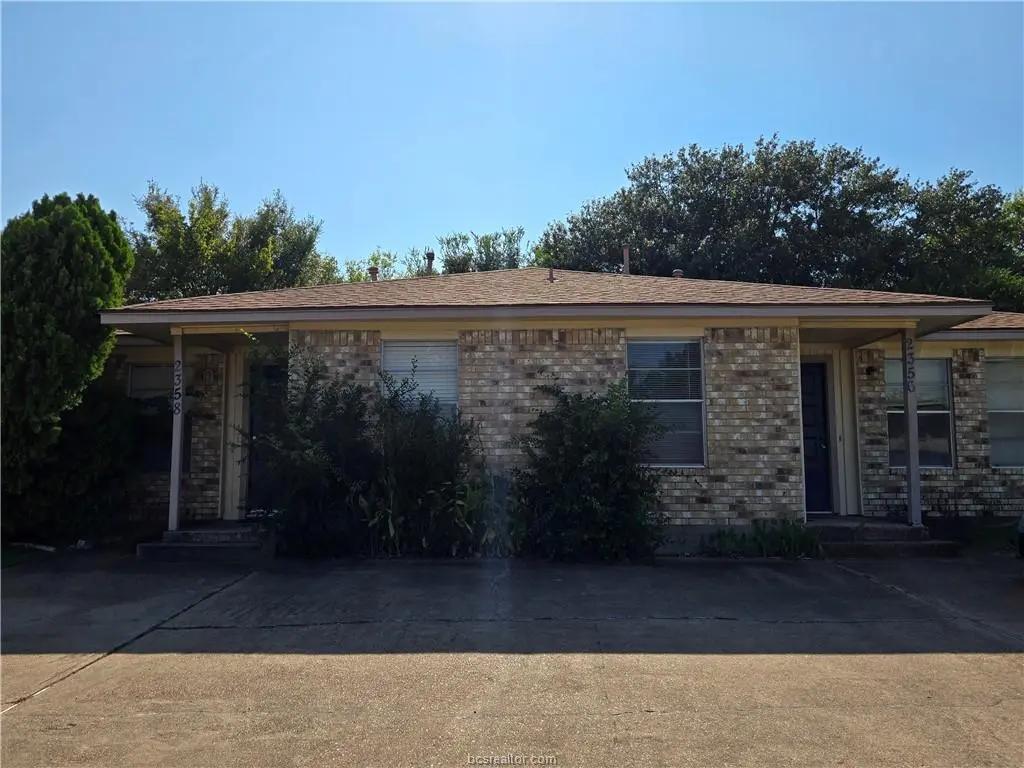
2356/2358 Cornell Dr · College Station, TX
Flood risk 1/10 · Minimal
- FEMA flood zone
- X (unshaded)
- Chance of flooding over 30 yrs
- 0.0%
- Est. flood insurance / yr
- $507 – $1,088
Fire risk 3/10 · Minor
- Est. fire insurance / yr
- $1,222 – $2,270
Heat risk 8/10 · Major
- Hot days now (above 110°F)
- 7 days/yr
- Hot days in 30 yrs
- 24 days/yr
Wind risk 8/10 · Major
- Chance of severe wind over 30 yrs
- 80.0%
Air-quality risk 1/10 · Minimal
- Unhealthy air days now
- 0 days/yr
- Unhealthy air days in 30 yrs
- 0 days/yr
Risk factors via First Street. Map © Google.
Why this score? — see what drove the D grade
The composite is a weighted blend of 9 inputs, each scored 0–100. Each bar is that input's sub-score; the figure is the points it added to the 100-point composite (weight × sub-score).
- Cash flow +11.5/30.0
- ARV discount +7.5/15.0
- Schools +4.7/10.0
- Livability +4.2/5.0
- Rent growth +4.1/5.0
- 1% rule +3.8/10.0
- DSCR +3.4/10.0
- Condition / age +2.5/5.0
- Appreciation +0.0/10.0
$290,000
🖨 Deal sheet (PDF) 📄 Offer letter ✓ Due diligence
Multi-family units
County records classify this as Multi-Family (2-4 Unit). Listing-text estimate: 2 units. confirmed
Listing remarks MLS
Check out this conveniently located Duplex right on a corner lot located near HWY 6 & Southwest Parkway! This duplex features 2 bed 1.5 baths on each side with spacious backyards that is fully leased thru July 2023. Washer/Dryer does convey!
Key facts
- Rental income
- Shared driveway
- 0.24 acre lot
Tags
Property features AI
Finance
- Financial info: Actual rents: one unit at $875, the other at $900
Exterior
- Parking: On-site paved parking for 4 vehicles
- Security: No security features listed
- Utilities: No specific utility providers listed
- Home design: Duplex residential income property; One-story
- Construction: Brick and wood siding construction
- Exterior features: Privacy wood fencing; Shingle roof
Interior
- Kitchen: No kitchen appliance list provided
- Bedrooms: Two 2-bedroom units
- Flooring: Carpet; Tile
- Bathrooms: Two 2-bath units
- Heating & cooling: Central heating (electric); Central air; Ceiling fans; Electric cooling components
- Interior features: Unfurnished; Water heater
- Laundry & utility: No laundry or utility appliance details provided
Neighborhood map
What this means for you Summary
Snapshot
- This is a 2 × 2-bed/1.5-bath units multifamily listed at $290k.
Deal economics
- At list price, monthly cash flow is $-95 ($-1k/yr) — negative. Per door: $-48/mo.
- To cash-flow at today's rent, offer at most $273k (5.8% below list).
- To meet the 1% rule (rent ≥ 1% of price), the offer needs to be $255k (12.2% below list).
- Recommended offer: $255k (12.2% below list) — sets the bar for 1% rule.
- Cap rate 5.9% vs local median 3.3% in College Station — top-decile yield for the area; either an underpriced asset or a hidden risk that comps aren't pricing in. Stress-test before assuming the spread holds.
Location & tenants
- Location reads 83/100 on livability (#11 in TX, #994 nationally) — a professional / high-income tenant draw. Strengths: amenities A+, commute A+, crime A-; Watch: employment C-.
- College Station ISD (urban): math 58% / reading 54% proficiency, ranked #113 of 826 in TX (top 14%) — acceptable for families but not a draw, mixed tenant base, ~2y average lease.
- Zoned schools: College Hills El (math 33% / reading 32%, grade F, #2,234 of 4,322 statewide, top 52%, 596 students, 75% FRL); Oakwood Int (math 55% / reading 47%, grade C, #326 of 1,662 statewide, top 20%, 719 students, 48% FRL); A & M Cons H S (math 65% / reading 66%, grade B, #193 of 1,632 statewide, top 12%, 2,139 students, 32% FRL) — zoned schools average 52% FRL vs 24% district-wide (27 pts higher); higher-poverty schools than district average — tighter screening recommended.
- Market conditions: Rents rising fast (+6.2%/yr); 307 active listings in the ZIP; 26 comparable units currently listed for rent nearby; rentals at typical pace (median 23d on market — plan ~3-4 weeks tenant-placement turnaround); lower-income renter base — watch delinquency; 2,211 units permitted in Brazos County in 2024 (768 in 5+ unit buildings).
- At $2,547/mo this rent would consume 101% of the median local household income ($30k/yr) (locally 8224% of renters already pay >50% of income on rent) — very limited rent-growth headroom before tenants either downsize or default.
Forward outlook
- Local home prices are declining (-3.0%/yr); year-one equity from $2k of loan paydown is wiped out by about $9k of value loss. Plan a longer hold.
- Brazos County population projected at +55% by 2050 — long-run rental-demand tailwind backs the buy-and-hold thesis.
Negotiation context
- It's been on market 31 days — a 3% lower offer ($281k) is reasonable based on typical stale-listing flexibility.
- 3 sale attempts since 4y ago with the ask held roughly flat each time — persistent listings suggest the price (not the market) is what's stuck; bring a comps-based counter.
Risks & watch-outs
- Climate carrying-cost: severe wind risk, 80% chance of damaging wind over 30y; extreme-heat days projected 7→24/yr by 2055 (HVAC capex compounding) — expect insurance premiums to compound above CPI over the hold.
Questions for the listing agent
- What do current leases actually rent for vs. the listed asking? Can we see a recent rent roll and the last 12 months of T-12 income?
- It's been on market 31 days. Have you received any prior offers? Is the seller open to a 12% concession, seller financing, or rate buy-down credit?
- Can we see the unit-by-unit rent roll, current vacancy, and any below-market leases? What's the average tenancy length?
- What capital expenditures (roof, boiler, parking lot, exteriors) have been made in the last 5 years, and what's planned in the next 2?
- Is there a deadline driving the sale (1031 exchange, divorce, estate, relocation)? That informs how much negotiation room exists.
- Schools are B-rated — typically a magnet for longer-tenancy family renters. What's the average tenant stay here, and is there a school-zone premium baked into asking?
- The area grade is low — what's the realistic commute time and amenity access for the typical tenant pool here? Any planned neighborhood developments (good or bad) we should know about?
- What's the average days-on-market for RENTAL listings here right now (not sales)? A rising rental-DOM trend means longer vacancies and softer asking-rent achievability than the comps imply.
- What's the recent tenant-quality profile in this submarket — average credit score on applications, eviction rate, late-payment / NSF rate, and stable-employment percentage? A property-management company in the area should have these aggregated.
- How much new apartment / multifamily construction is in the pipeline within 1–3 miles? Heavy new supply (>2% of stock underway) typically softens rents 12–24 months out; light construction supports rent growth.
Investment metrics
- 1% rule
- 0.88% ✗
- Cap rate
- 5.90%
- Cash-on-cash
- -1.41%
- DSCR
- 0.94
- GRM
- 9.5
CMA / ARV
No comps found within radius.
Projected returns pro-forma
-3.0% appreciation · 6.24% rent growth · sell at horizon
- IRR
- -14.8%
- Equity multiple
- 0.45×
- Total profit
- $-44,389
- Equity at exit
- $43,240
- IRR
- -1.3%
- Equity multiple
- 0.90×
- Total profit
- $-8,456
- Equity at exit
- $25,074
Cash invested: $81,200 (down + closing). Projections, not guarantees.
Landlord ↔ Tenant lean methodology
- Overall (STATE)
- 87 Strongly Landlord-Friendly
- State Texas
- 87 Strongly Landlord-Friendly · R+5
- County
- — inherits STATE
- City
- — inherits STATE
ZIP-level market 77840
- Rents YoY
- 6.2%
- Active inventory
- 307
- Price-to-rent
- 19.0×
Monthly cashflow live
- Estimated rent
- $2,547 high interval (Pro) →
- Mortgage (P&I)
- −$1,521
- Tax from tax record
- −$466 /mo · $5,590/yr
- Insurance
- −$121
- HOA
- −$0
- Vacancy / Maint / Mgmt
- −$535
- Net cashflow
- $-95
Break-even live
Sensitivity live
| Price | -10% $69 | -5% $-13 | +0% $-95 | +5% $-177 | +10% $-259 |
|---|---|---|---|---|---|
| Rent | -10% $-297 | -5% $-196 | +0% $-95 | +5% $5 | +10% $106 |
| Rate | -1.0pp $51 | -0.5pp $-22 | base $-95 | +0.5pp $-170 | +1.0pp $-247 |
2-unit breakdown (identical units grouped — click to expand)
| Units | Beds | Baths | Est. rent |
|---|---|---|---|
| 2× units | 2 | 1.5 | $2,548 |
| #1 | 2 | 1.5 | $1,274 |
| #2 | 2 | 1.5 | $1,274 |
| Total (2 units) | $2,547 | ||
UW: 25.0% down · 7.5% · 30yr · 1.5% tax · 5.0% vac · 8.0% maint · 8.0% mgmt
Financing live
Cash to close
- Down payment
- $72,500
- Closing costs
- $8,700
- Reserves months
- —
- Total cash needed
- —
Loan-product check · same deal, 3 products live
Conventional
25% down · 7.5% · 30yr
- Down + closing
- —
- Monthly P&I
- —
- Monthly cashflow
- —
- DSCR
- —
- Eligible?
- —
Personal DTI + credit; lowest rate.
DSCR
20% down · 8.5% · 30yr
- Down + closing
- —
- Monthly P&I
- —
- Monthly cashflow
- —
- DSCR
- —
- Eligible?
- —
No personal income docs; deal must DSCR.
Hard money
10% down · 12.0% · 12mo
- Down + closing
- —
- Monthly P&I
- —
- Monthly cashflow
- —
- DSCR
- —
- Eligible?
- —
Short-term bridge; refi at stabilization.
Rent comps 26 comps
| Address | Beds | Baths | Sqft | Rent | $/sqft | DOM | Units | Dist |
|---|---|---|---|---|---|---|---|---|
| 2330 Autumn Chase Loop Unit B College Station, TX | 3.0 | 3.0 | 1364 | $1,650 | $1.21 | 23d | 1 | 0.09mi |
| 2409 Colgate Cir College Station, TX | 5.0 | 3.0 | 1870 | $750 | $0.40 | 45d | 1 | 0.17mi |
| 214 Sterling St Unit 1328049P College Station, TX | 4.0 | 2.0 | 1560 | $3,260 | $2.09 | 15d | 1 | 0.20mi |
| 236 Richards St College Station, TX | 5.0 | 5.5 | 2550 | $4,100 | $1.61 | 15d | 1 | 0.27mi |
| 287 Estates Cir Unit 1071599P College Station, TX | 4.0 | 4.0 | 2098 | $7,118 | $3.39 | 23d | 1 | 0.30mi |
| 2105 Crest St College Station, TX | 5.0 | 5.5 | 2405 | $4,100 | $1.70 | 15d | 1 | 0.35mi |
| 810 Camellia Ct Unit 1328089P College Station, TX | 3.0 | 2.0 | 1302 | $4,917 | $3.78 | 23d | 1 | 0.38mi |
| 512 Camp Ct Unit 1328090P College Station, TX | 3.0 | 2.0 | 1388 | $3,624 | $2.61 | 15d | 1 | 0.53mi |
| 1600 Southwest Pkwy College Station, TX | 1.0–3.0 | 1.0–2.5 | 1005 | $1,500 | $1.49 | 15d | 21 | 0.58mi |
| 1001 Krenek Tap Rd College Station, TX | 3.0–4.0 | 3.0–4.0 | 1572 | $2,200 | $1.40 | 45d | 2 | 0.72mi |
| 1409 Clement Ct Unit 1328074P College Station, TX | 4.0 | 2.0 | 1991 | $5,418 | $2.72 | 15d | 1 | 0.73mi |
| 1302 Laura Ln College Station, TX | 3.0 | 2.0 | 1460 | $1,825 | $1.25 | 23d | 1 | 0.82mi |
| 1105 Glade St Unit 1328055P College Station, TX | 5.0 | 3.0 | 2077 | $6,440 | $3.10 | 15d | 1 | 0.86mi |
| 1301 Haines Dr College Station, TX | 4.0 | 2.0 | 1790 | $2,200 | $1.23 | 23d | 1 | 0.87mi |
| 902 Holik Dr College Station, TX | 3.0 | 2.0 | 2013 | $2,400 | $1.19 | 45d | 1 | 0.91mi |
| 1611 Armistead St Unit 1344599P College Station, TX | 3.0 | 3.0 | 2002 | $4,440 | $2.22 | 23d | 1 | 0.99mi |
| 1200 Village Dr College Station, TX | 3.0 | 2.0 | 1443 | $1,750 | $1.21 | 15d | 1 | 1.00mi |
| 1200 Village Dr College Station, TX | 3.0 | 2.0 | 1443 | $1,750 | $1.21 | 23d | 1 | 1.00mi |
| 1909 Langford St Unit 1328073P College Station, TX | 4.0 | 2.0 | 2271 | $5,828 | $2.57 | 15d | 1 | 1.06mi |
| 1208 Bayou Woods Dr College Station, TX | 3.0 | 2.0 | 1627 | $2,600 | $1.60 | 45d | 1 | 1.10mi |
| 1428 Magnolia Dr College Station, TX | 4.0 | 2.0 | 1509 | $2,400 | $1.59 | 45d | 1 | 1.17mi |
| 2003 Harvey Mitchell Pkwy S College Station, TX | 3.0 | 4.0 | 1838 | $1,950 | $1.06 | 45d | 1 | 1.23mi |
| 2700 Horse Haven Ln College Station, TX | 4.0 | 5.0 | 1759 | $2,600 | $1.48 | 45d | 1 | 1.24mi |
| 602 Townplace Dr Unit 1328092P College Station, TX | 3.0 | 3.0 | 1291 | $3,348 | $2.59 | 23d | 1 | 1.34mi |
| 6959 Halter Loop College Station, TX | 5.0 | 5.5 | 2332 | $2,000 | $0.86 | 45d | 1 | 1.37mi |
| 521 Southwest Pkwy #303 College Station, TX | 4.0 | 4.0 | 1236 | $460 | $0.37 | 15d | 1 | 1.50mi |
Listing history 23 events
-
2026-06-21days on market $290,000 Active 31 DOM
-
2026-06-18days on market $290,000 Active 28 DOM
-
2026-06-17days on market $290,000 Active 27 DOM
-
2026-06-16days on market $290,000 Active 26 DOM
-
2026-06-15days on market $290,000 Active 25 DOM
-
2026-06-14days on market $290,000 Active 23 DOM
-
2026-06-13days on market $290,000 Active 22 DOM
-
2026-06-10days on market $290,000 Active 20 DOM
-
2026-06-09days on market $290,000 Active 19 DOM
-
2026-06-08days on market $290,000 Active 18 DOM
-
2026-06-07days on market $290,000 Active 17 DOM
-
2026-06-05days on market $290,000 Active 14 DOM
-
2026-06-02days on market $290,000 Active 12 DOM
-
2026-06-01days on market $290,000 Active 11 DOM
-
2026-05-31days on market $290,000 Active 10 DOM
-
2026-05-30days on market $290,000 Active 9 DOM
-
2026-05-21$290,000 Active
-
2025-09-18price $295,000
-
2025-08-23$305,000 Active
-
2022-10-26soldstatus 247-char remark
Show marketing remark (247 chars)
Check out this conveniently located Duplex right on a corner lot located near HWY 6 & Southwest Parkway! This duplex features 2 bed 1.5 baths on each side with spacious backyards that is fully leased thru July 2023. Washer/Dryer does convey!
-
2022-10-26soldstatus
Show marketing remark (247 chars)
Check out this conveniently located Duplex right on a corner lot located near HWY 6 & Southwest Parkway! This duplex features 2 bed 1.5 baths on each side with spacious backyards that is fully leased thru July 2023. Washer/Dryer does convey!
-
2022-08-14$240,000 247-char remark
Show marketing remark (247 chars)
Check out this conveniently located Duplex right on a corner lot located near HWY 6 & Southwest Parkway! This duplex features 2 bed 1.5 baths on each side with spacious backyards that is fully leased thru July 2023. Washer/Dryer does convey!
-
1999-01-26soldstatus
ⓘ Source: listings_history table (triggers on properties + properties_extension) + one-shot
backfill from property_details.listing_events for pre-trigger history.
Tax reassessment forecast TX · Resets to sale price
- Current annual tax
- $5,590 · $466/mo
- Projected year-2 tax
- $5,590 · $466/mo
- Expected delta
- $0/yr ($0/mo · 0.0%)
ⓘ Screening estimate from a state-policy table — verify with the county assessor before closing.
Climate risk First Street
- Flood 1/10 Low FEMA zone X (unshaded) · 0% chance over 30 yrs
- Wildfire 3/10 Moderate
- Heat 8/10 Severe 7 d/yr ≥110°F today · 24 d/yr by 30 yrs out
- Wind 8/10 Severe 80% chance of damaging wind over 30 yrs
- Air quality 1/10 Low 0 unhealthy d/yr today · 0 by 30 yrs out
Nearby sold comps map
Loading sold comps map…
Walkable amenities ~0.75 mi
Loading nearby amenities…
Taxation est. · year 1
- Rental income
- $30,564
- − Mortgage interest
- −$16,245
- − Property taxes
- −$5,590
- − Insurance
- −$1,450
- − Repairs & maintenance
- −$2,445
- − Management
- −$2,445
- − Depreciation
- −$8,436
- Taxable loss
- −$6,047
- Est. tax savings @ 24.0%
- +$1,451
- After-tax cash flow
- $307/yr
For passive investors: Depreciation is non-cash, so a rental often shows a tax loss while cash-flowing — sheltering income. Rental losses are passive: they offset passive income freely, and up to $25,000/yr can offset ordinary (W-2) income if you actively participate and your MAGI is under $100k (phasing out to $0 by $150k); unused losses carry forward. On sale, claimed depreciation is recaptured at up to 25%, and gains may owe capital-gains tax (a 1031 exchange can defer both). Figures are a year-1 estimate at your 24.0% rate — not tax advice; consult a CPA.
Schools (NCES district)
- District
- College Station ISD
- NCES district ID
- 4807350
- Math proficiency
- 58% ▼ -4.00%
- Reading proficiency
- 54% ▼ -2.00%
- Median HH income
- $36,991
- Composite
- 46.54/100
- National rank
- #2428
- State rank
- #113 of 826 in TX
Livability — College Station
- Score
- 83/100
- State rank
- #11
- US rank
- #994
Category grades
Schools grade is shown separately in the Schools card above.
Census & demographics
- Census place
- College Station, TX
- County
- Brazos County · 233,400 people
- City population
- 131,628
- Metro
- College Station-Bryan, TX
- Population (ZIP)
- 54,864
- Household income
- $30,377
- Rent vs Own
- Severe rent burden
- 8224.0
Population outlook (Brazos County) Hauer SSP2
- Today (2025)
- 267,942 people
- By 2030
- 296,630 · +10.7%
- By 2040
- 354,560 · +32.3%
- By 2050
- 414,616 · +54.7%
- By 2075
- 562,158 · +109.8%
- By 2100
- 678,828 · +153.3%
Race, ethnicity, and origin ACS 2023
- Neighborhood character
- Diverse neighborhood (Simpson 0.63)
- Race & ethnicity
- White 55% Hispanic / Latino 20% Two or more races 11% Black 11% Asian 9%
- Hispanic origin (detail)
- Mexican 13%
- Common ancestry
- Romanian 2% Lithuanian 2% Italian 2%
- Foreign-born
- 14% · Canada, China, South Korea
- Languages at home
- 77% English-only · Spanish 12% Other Indo-European 3% Chinese 2%
Political lean MEDSL · Brazos
- 2024 margin
- Strong R (+24.9) · D 36.9% · R 61.7% · Other 1.4%
- 2008→2024 swing
- +4.1pp toward D · 2008: -28.9pp · 2024: -24.9pp
- All cycles
- 2024: R+24.9 2020: R+14.3 2016: R+23.7 2012: R+35.3 2008: R+28.9
Not yet ingested
- Civics
- —
Market trends
- HPI YoY
- ▼ -155.15%
- Current HPI
- 195.2885
- Rent YoY
- ▲ 6.24%
- Metro
- College Station-Bryan, TX
- State GDP YoY
- ▲ 3.95%
- F500 in state
- 110
Industry mix (Fortune 500 HQ in TX)
| Industry | F500 HQs | Revenue |
|---|---|---|
| Energy | 16 | $1,198B |
|
||
| Technology | 5 | $198B |
|
||
| Engineering / Construction | 4 | $72B |
|
||
| Energy Services | 3 | $60B |
|
||
| Utilities | 3 | $41B |
|
||
| Healthcare | 2 | $330B |
|
||
Price history
+20.8% since first listed7 events — show timeline
- 2026-05-21 Listed $290,000 BCSRMLS
- 2025-09-18 Price Changed $295,000 BCSRMLS
- 2025-08-23 Listed $305,000 BCSRMLS
- 2022-10-26 Sold (Public Records) — Public Records
- 2022-10-26 Sold (MLS) — BCSRMLS
- 2022-08-14 Listed $240,000 BCSRMLS
- 1999-01-26 Sold (Public Records) — Public Records
Property tax history
+4.1%/yrLatest (2025): $5,590 · +17.3% YoY. Source: county tax records.
Cash-flow waterfall
monthlySold comps — $/sqft
last 12 mo · ≤1 miLoading sold comps…