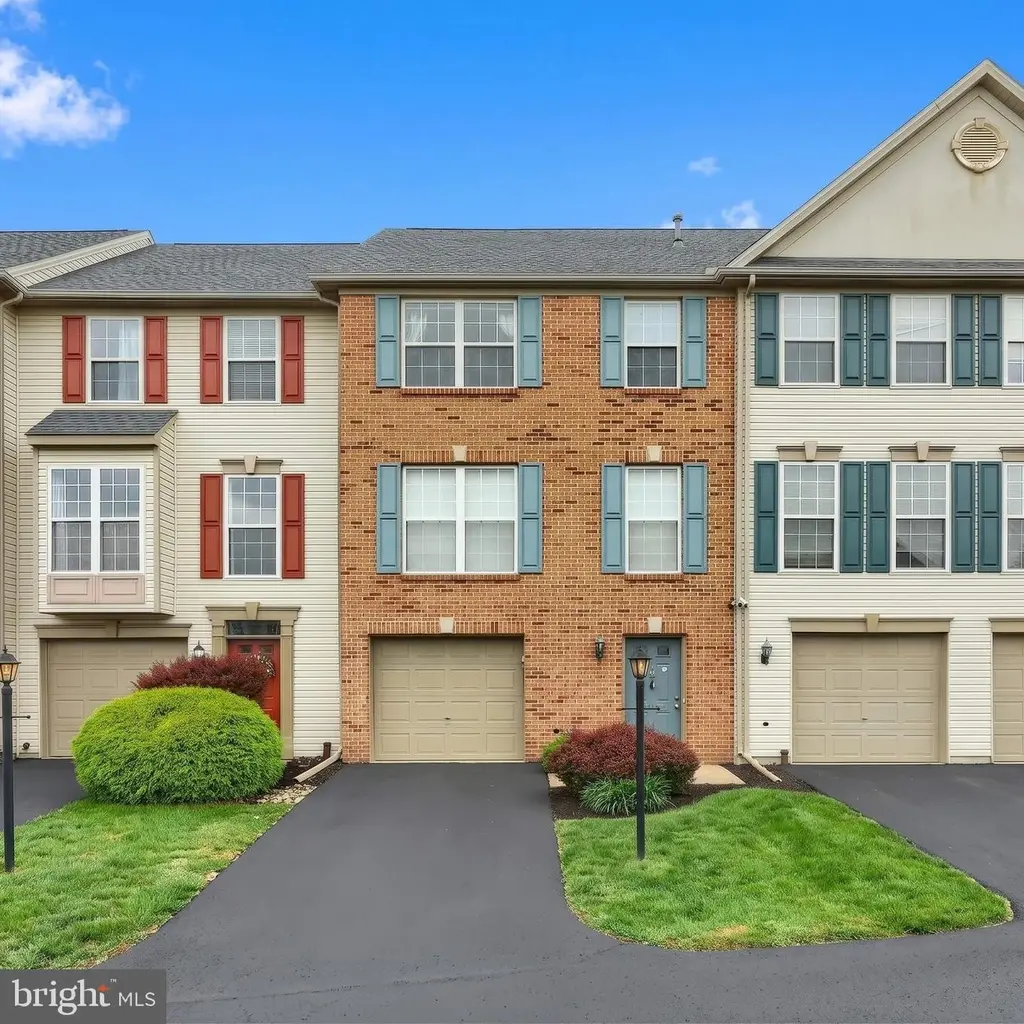
122 Chandler Dr #122 · Red Lion, PA
Flood risk 1/10 · Minimal
- FEMA flood zone
- X (unshaded)
- Chance of flooding over 30 yrs
- 0.0%
- Est. flood insurance / yr
- $473 – $860
Fire risk 1/10 · Minimal
- Est. fire insurance / yr
- $511 – $949
Heat risk 5/10 · Moderate
- Hot days now (above 100°F)
- 7 days/yr
- Hot days in 30 yrs
- 15 days/yr
Wind risk 4/10 · Minor
- Chance of severe wind over 30 yrs
- 16.0%
Air-quality risk 3/10 · Minor
- Unhealthy air days now
- 2 days/yr
- Unhealthy air days in 30 yrs
- 5 days/yr
Risk factors via First Street. Map © Google.
Why this score? — see what drove the D grade
The composite is a weighted blend of 9 inputs, each scored 0–100. Each bar is that input's sub-score; the figure is the points it added to the 100-point composite (weight × sub-score).
- Cash flow +10.8/30.0
- ARV discount +8.4/15.0
- 1% rule +4.4/10.0
- Livability +3.9/5.0
- Schools +3.8/10.0
- Condition / age +3.8/5.0
- DSCR +3.1/10.0
- Rent growth +2.5/5.0
- Appreciation +0.0/10.0
$214,900
🖨 Deal sheet 📄 Offer letter ✓ Due diligence
Listing remarks
122 Chandler Drive is a beautiful condo located in Lombard Pines near Cape Horn Shopping Center in Red Lion Schools. Delivering the space you need with low-maintenance ease you want. Finished lower level family room, deck, huge pantry and kitchen island, off street parking, plus 1 car garage. The perfect home for everyday comfort and entertaining. Walking distance to new Windsor Recreation Center. Perfect for commute to MD, Harrisburg, or Lancaster!
Key facts
- $210 HOA
- Garage
- Built 1998
Property features AI
Finance
- HOA & community: Monthly condo/HOA fee of $210; HOA covers common area maintenance, exterior building maintenance, lawn maintenance, management, reserve funds, road maintenance, and snow removal; One-time other fee of $1,500
Exterior
- Parking: Built-in attached garage (1 car); Paved driveway; Off-street parking
- Utilities: Public water; Public sewer; 200+ amp electrical service; Hot water: natural gas; Heating fuel: natural gas
- Home design: Interior townhouse/rowhouse; Fee simple ownership
- Construction: Asphalt shingle roof; Block foundation; Year built (assessor source)
- Exterior features: Vinyl siding; Exterior lighting; Not located in a federal flood zone
Interior
- Kitchen: Refrigerator; Dishwasher; Microwave
- Bedrooms: Three bedrooms on the upper level
- Bathrooms: One full bathroom on upper level; One half bathroom on main level
- Heating & cooling: Forced air heating; Central air conditioning
- Interior features: Level entry to main floor; Exterior lighting; Full basement
Neighborhood map
What this means for you Summary
Snapshot
- This is a 3-bed/1.5-bath townhouse listed at $215k. Condition is rated good.
Deal economics
- At list price, monthly cash flow is $-97 ($-1k/yr) — negative.
- To cash-flow at today's rent, offer at most $201k (6.5% below list).
- To meet the 1% rule (rent ≥ 1% of price), the offer needs to be $202k (5.8% below list).
- Recommended offer: $201k (6.5% below list) — sets the bar for cash-flow.
- Cap rate 5.8% vs local median 4.5% in Red Lion — meaningfully above typical; check what's discounted (condition, days-on-market, listing class) to confirm the premium yield is real.
Location & tenants
- Location reads 77/100 on livability (#349 in PA, #3,056 nationally) — a middle-class / working-renter tenant base. Strengths: cost of living A+, housing A+, health & safety A+; Watch: amenities D, commute F.
- Red Lion Area SD (suburban): math 36% / reading 50% proficiency, ranked #282 of 539 in PA (top 52%) — families likely to look elsewhere, expect single-tenant / working-renter base with shorter leases.
- Zoned schools: Red Lion Area Shs (math 63% / reading 24%, grade F, #211 of 437 statewide, top 48%, 1,432 students, 44% FRL) — zoned schools average 44% FRL vs 28% district-wide (15 pts higher); higher-poverty schools than district average — tighter screening recommended.
- Market conditions: 147 active listings in the ZIP; 10 comparable units currently listed for rent nearby; rentals at typical pace (median 21d on market — plan ~3-4 weeks tenant-placement turnaround); solid renter incomes; 1,328 units permitted in York County in 2024 (338 in 5+ unit buildings).
Forward outlook
- Local home prices are declining (-3.0%/yr); year-one equity from $1k of loan paydown is wiped out by about $6k of value loss. Plan a longer hold.
Negotiation context
- It's been on market 18 days — a 2% lower offer ($212k) is reasonable based on typical stale-listing flexibility.
Risks & watch-outs
- Climate carrying-cost: extreme-heat days projected 7→15/yr by 2055 (HVAC capex compounding) — expect insurance premiums to compound above CPI over the hold.
Questions for the listing agent
- What do current leases actually rent for vs. the listed asking? Can we see a recent rent roll and the last 12 months of T-12 income?
- What does the HOA fee cover, when was the last increase, and are there any pending special assessments or reserve-fund shortfalls?
- Is there a deadline driving the sale (1031 exchange, divorce, estate, relocation)? That informs how much negotiation room exists.
- The area grade is low — what's the realistic commute time and amenity access for the typical tenant pool here? Any planned neighborhood developments (good or bad) we should know about?
- What's the average days-on-market for RENTAL listings here right now (not sales)? A rising rental-DOM trend means longer vacancies and softer asking-rent achievability than the comps imply.
- What's the recent tenant-quality profile in this submarket — average credit score on applications, eviction rate, late-payment / NSF rate, and stable-employment percentage? A property-management company in the area should have these aggregated.
- How much new for-sale + rental construction is in the pipeline within 1–3 miles? Heavy new supply typically softens prices + rents 12–24 months out; constrained supply supports both.
Investment metrics
- 1% rule
- 0.94% ✗
- Cap rate
- 5.75%
- Cash-on-cash
- -1.93%
- DSCR
- 0.91
- GRM
- 8.9
CMA / ARV
- ARV (median comp)
- $219,058
- List price
- $214,900
- Delta
- -1.90%
- Verdict
- FAIR
- Comps
- 20 within 1.0 mi
Show comp detail 12 sales within ~0.75 mi
| Address | Dist | Beds/Ba | Sqft | Sold | Price | $/sf | Match |
|---|---|---|---|---|---|---|---|
| 151 Chandler Dr | 0.06mi | 2/2.5 (-1) | 1,714 (-3%) | 3mo | $210,000 | $123 | 82 |
| 120 Chandler Dr #120 | 0.00mi | 2/2.5 (-1) | 1,760 (0%) | 21mo | $205,000 | $116 | 73 |
| 62 Hunters Run Ct | 0.06mi | 3/2.5 | 1,810 (+3%) | 22mo | $200,000 | $110 | 70 |
| 129 Kathryn Dr | 0.05mi | 2/1.5 (-1) | 1,902 (+8%) | 12mo | $205,000 | $108 | 69 |
| 136 Kathryn Dr | 0.02mi | 3/2.0 | 1,620 (-8%) | 20mo | $215,000 | $133 | 67 |
| 119 Chandler Dr #119 | 0.02mi | 2/1.5 (-1) | 1,592 (-10%) | 16mo | $225,000 | $141 | 65 |
| 121 Chandler Dr | 0.02mi | 3/2.0 | 1,597 (-9%) | 20mo | $220,000 | $138 | 65 |
| 169 Jonathan Way N | 0.63mi | 4/1.5 (+1) | 1,778 (+1%) | 3mo | $240,000 | $135 | 62 |
| 12 Steeple Ave | 0.63mi | 3/1.5 | 1,813 (+3%) | 13mo | $261,000 | $144 | 55 |
| 27 Steeple Ave | 0.64mi | 3/2.5 | 1,912 (+9%) | 7mo | $265,000 | $139 | 46 |
| 50 Love Ave | 0.59mi | 3/1.5 | 1,502 (-15%) | 18mo | $268,000 | $178 | 33 |
| 190 Winners Cir | 0.64mi | 2/2.0 (-1) | 1,504 (-14%) | 21mo | $275,000 | $183 | 22 |
Match score weights: distance 35% · size 25% · config 20% · recency 20%. Top-matched comps best support the ARV.
Projected returns pro-forma
-3.0% appreciation · 3.0% rent growth · sell at horizon
- IRR
- -19.4%
- Equity multiple
- 0.32×
- Total profit
- $-40,812
- Equity at exit
- $32,042
- IRR
- -11.9%
- Equity multiple
- 0.29×
- Total profit
- $-42,808
- Equity at exit
- $18,581
Cash invested: $60,172 (down + closing). Projections, not guarantees.
Landlord ↔ Tenant lean methodology
- Overall (STATE)
- 62 Landlord-Friendly
- State Pennsylvania
- 62 Landlord-Friendly · EVEN
- County
- — inherits STATE
- City
- — inherits STATE
ZIP-level market 17356
- Home prices YoY
- -21.0%
- Active inventory
- 147
- Price-to-rent
- 8.9×
Monthly cashflow live
- Estimated rent
- $2,024 high interval (Pro) →
- Mortgage (P&I)
- −$1,127
- Tax est. 1.5%
- −$269 /mo · $3,224/yr
- Insurance
- −$90
- HOA
- −$210
- Vacancy / Maint / Mgmt
- −$425
- Net cashflow
- $-97
Break-even live
UW: 25.0% down · 7.5% · 30yr · 1.5% tax · 5.0% vac · 8.0% maint · 8.0% mgmt
Financing live
Cash to close
- Down payment
- $53,725
- Closing costs
- $6,447
- Reserves months
- —
- Total cash needed
- —
Loan-product check · same deal, 3 products live
Conventional
25% down · 7.5% · 30yr
- Down + closing
- —
- Monthly P&I
- —
- Monthly cashflow
- —
- DSCR
- —
- Eligible?
- —
Personal DTI + credit; lowest rate.
DSCR
20% down · 8.5% · 30yr
- Down + closing
- —
- Monthly P&I
- —
- Monthly cashflow
- —
- DSCR
- —
- Eligible?
- —
No personal income docs; deal must DSCR.
Hard money
10% down · 12.0% · 12mo
- Down + closing
- —
- Monthly P&I
- —
- Monthly cashflow
- —
- DSCR
- —
- Eligible?
- —
Short-term bridge; refi at stabilization.
Rent comps 10 comps
| Address | Beds | Baths | Sqft | Rent | $/sqft | DOM | Units | Dist |
|---|---|---|---|---|---|---|---|---|
| 21 Windsor Way Red Lion, PA | 3.0 | 2.0–2.5 | 1385 | $2,150 | $1.55 | 13d | 8 | 0.23mi |
| 306 Orchard Ct Red Lion, PA | 2.0 | 1.5 | 1300 | $1,495 | $1.15 | 21d | 1 | 0.70mi |
| 198 Cadbury Dr Red Lion, PA | 4.0 | 2.5 | 1625 | $2,250 | $1.38 | 13d | 1 | 0.77mi |
| 66 Cadbury Dr Red Lion, PA | 4.0 | 2.5 | 1625 | $2,250 | $1.38 | 13d | 1 | 0.80mi |
| 321 Avon Dr Red Lion, PA | 3.0 | 2.5 | 1720 | $2,050 | $1.19 | 43d | 1 | 0.95mi |
| 259 Stratford Dr Red Lion, PA | 4.0 | 2.5 | 1625 | $2,250 | $1.38 | 43d | 1 | 1.03mi |
| 406 Valor Way Red Lion, PA | 3.0 | 2.5 | 1252 | $1,875 | $1.50 | 21d | 1 | 1.16mi |
| 224 Sienna Ln Yoe, PA | 3.0 | 2.5 | 1252 | $1,979 | $1.58 | 21d | 1 | 1.17mi |
| 101 N Cheviot Way Red Lion, PA | 2.0–3.0 | 1.5–2.5 | 1826 | $2,175 | $1.19 | 13d | 9 | 1.19mi |
| 705 Country Club Rd Red Lion, PA | 3.0 | 2.5 | 1660 | $1,695 | $1.02 | 43d | 1 | 1.50mi |
HOA detail
- Monthly dues
- $210 · $2,520/yr
Listing history 2 events
-
2026-05-07$214,900 Active 454-char remark
-
2026-05-02historical $214,900 454-char remark
ⓘ Source: listings_history table (triggers on properties + properties_extension) + one-shot
backfill from property_details.listing_events for pre-trigger history.
Climate risk First Street
- Flood 1/10 Low FEMA zone X (unshaded) · 0% chance over 30 yrs
- Wildfire 1/10 Low
- Heat 5/10 Major 7 d/yr ≥100°F today · 15 d/yr by 30 yrs out
- Wind 4/10 Moderate 16% chance of damaging wind over 30 yrs
- Air quality 3/10 Moderate 2 unhealthy d/yr today · 5 by 30 yrs out
Nearby sold comps map
Loading sold comps map…
Walkable amenities ~0.75 mi
Loading nearby amenities…
Taxation est. · year 1
- Rental income
- $24,282
- − Mortgage interest
- −$12,038
- − Property taxes
- −$3,224
- − Insurance
- −$1,074
- − Repairs & maintenance
- −$1,943
- − Management
- −$1,943
- − HOA
- −$2,520
- − Depreciation
- −$6,252
- Taxable loss
- −$4,710
- Est. tax savings @ 24.0%
- +$1,130
- After-tax cash flow
- $-28/yr
For passive investors: Depreciation is non-cash, so a rental often shows a tax loss while cash-flowing — sheltering income. Rental losses are passive: they offset passive income freely, and up to $25,000/yr can offset ordinary (W-2) income if you actively participate and your MAGI is under $100k (phasing out to $0 by $150k); unused losses carry forward. On sale, claimed depreciation is recaptured at up to 25%, and gains may owe capital-gains tax (a 1031 exchange can defer both). Figures are a year-1 estimate at your 24.0% rate — not tax advice; consult a CPA.
Condition & rehab AI · 1 photo
This townhouse is in good condition with minor wear in the kitchen and bathrooms. It offers a good balance of functionality and curb appeal, making it a solid investment.
Repairs flagged
- Minor kitchen cabinets — Slight wear visible
- Minor bathroom fixtures — Slight wear visible
Value-add opportunities
- Resale Paint interior walls — Fresh paint enhances curb appeal and interior aesthetics
- Resale Replace kitchen cabinets — New cabinets improve functionality and aesthetics
- Resale Replace bathroom fixtures — New fixtures enhance functionality and aesthetics
Renovation cost estimate screening
| Repair item | Severity | Est. cost |
|---|---|---|
| kitchen cabinets · Slight wear visible | Minor | $500–3,000 |
| bathroom fixtures · Slight wear visible | Minor | $500–3,000 |
| Total estimated repair cost · 2 items | $1,000–6,000 |
Value-add ROI direction
- Resale Paint interior walls — Fresh paint enhances curb appeal and interior aesthetics ↑
- Resale Replace kitchen cabinets — New cabinets improve functionality and aesthetics ↑
- Resale Replace bathroom fixtures — New fixtures enhance functionality and aesthetics ↑
ⓘ Cost ranges are severity-bucket heuristics (US national rule-of-thumb). Get contractor quotes + a written scope before underwriting a rehab budget.
Schools (NCES district)
- District
- Red Lion Area SD
- NCES district ID
- 4220100
- Math proficiency
- 36% ▼ -10.00%
- Reading proficiency
- 50% ▼ -10.00%
- Median HH income
- $60,225
- Composite
- 37.91/100
- National rank
- #4313
- State rank
- #282 of 539 in PA
Livability — Red Lion
- Score
- 77/100
- State rank
- #349
- US rank
- #3056
Category grades
Schools grade is shown separately in the Schools card above.
Census & demographics
- County
- York County · 278,806 people
- City population
- 22,869
- Metro
- York-Hanover, PA
- Population (ZIP)
- 22,869
- Household income
- $86,561
- Rent vs Own
- Severe rent burden
- 559.0
Population outlook (York County) Hauer SSP2
- Today (2025)
- 454,205 people
- By 2030
- 457,407 · +0.7%
- By 2040
- 457,529 · +0.7%
- By 2050
- 448,261 · -1.3%
- By 2075
- 427,388 · -5.9%
- By 2100
- 384,218 · -15.4%
Race, ethnicity, and origin ACS 2023
- Neighborhood character
- Predominantly White (89%)
- Race & ethnicity
- White 89% Black 4% Two or more races 4% Asian 2% Hispanic / Latino 2%
- Common ancestry
- Romanian 3% Slovak 3% Serbian 2%
- Foreign-born
- 4% · China
- Languages at home
- 95% English-only · Russian/Polish/Slavic 1% Chinese 1% Other Indo-European 1%
Political lean MEDSL · York
- 2024 margin
- Strong R (+25.3) · D 36.9% · R 62.1%
- 2008→2024 swing
- -11.7pp toward R · 2008: -13.6pp · 2024: -25.3pp
- All cycles
- 2024: R+25.3 2020: R+24.6 2016: R+29.3 2012: R+21.2 2008: R+13.6
Not yet ingested
- Civics
- —
Market trends
- HPI YoY
- ▼ -69.16%
- Current HPI
- 259.7294
- Rent YoY
- —
- Metro
- York-Hanover, PA
- State GDP YoY
- ▲ 1.68%
- F500 in state
- 34
Industry mix (Fortune 500 HQ in PA)
| Industry | F500 HQs | Revenue |
|---|---|---|
| Healthcare | 2 | $309B |
|
||
| Insurance | 2 | $27B |
|
||
| Telecommunications / Media | 1 | $124B |
|
||
| Industrial Distribution | 1 | $22B |
|
||
| Financial Services | 1 | $20B |
|
||
| Chemicals / Materials | 1 | $18B |
|
||
Price history
+0.0% since first listed3 events — show timeline
- 2026-05-25 Pending — BRIGHT MLS
- 2026-05-07 Listed $214,900 BRIGHT MLS
- 2026-05-02 Coming Soon $214,900 BRIGHT MLS
Cash-flow waterfall
monthlySold comps — $/sqft
last 12 mo · ≤1 miLoading sold comps…