406 Canyon Rd · Capulin, CO
Flood risk 1/10 · Minimal
- FEMA flood zone
- —
- Chance of flooding over 30 yrs
- 0.0%
- Est. flood insurance / yr
- —
Fire risk 4/10 · Minor
- Est. fire insurance / yr
- $939 – $1,743
Heat risk 1/10 · Minimal
- Hot days now (above 82°F)
- 10 days/yr
- Hot days in 30 yrs
- 27 days/yr
Wind risk 1/10 · Minimal
- Chance of severe wind over 30 yrs
- —
Air-quality risk 1/10 · Minimal
- Unhealthy air days now
- 0 days/yr
- Unhealthy air days in 30 yrs
- 0 days/yr
Risk factors via First Street. Map © Google.
Why this score? — see what drove the D+ grade
The composite is a weighted blend of 9 inputs, each scored 0–100. Each bar is that input's sub-score; the figure is the points it added to the 100-point composite (weight × sub-score).
- Cash flow +16.7/30.0
- ARV discount +7.5/15.0
- DSCR +5.2/10.0
- Appreciation +5.0/10.0
- 1% rule +4.5/10.0
- Schools +3.2/10.0
- Rent growth +2.5/5.0
- Condition / age +2.5/5.0
- Livability +2.2/5.0
$107,500
🖨 Deal sheet 📄 Offer letter ✓ Due diligence
Listing remarks
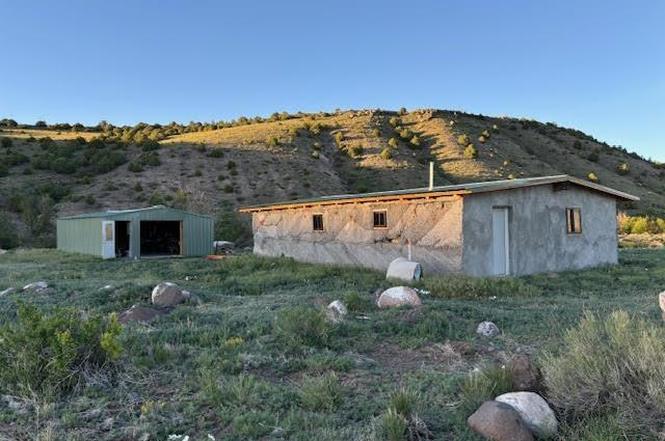
Off-grid creekside home in a gated San Luis Valley community. The creek runs year round. Two structures: a 30x40' pumice home (partially stuccoed, open floor plan ready for customization) and a 20x30' Amish-built garage. Home features vaulted ceilings, and custom ProVia windows. Property includes a well with new pump and piping, a new septic system which is rated for a two bedroom/ two bathroom house (2022), and a solar panel stand. Excellent private fishing for trout and bordering BLM land. Local contractor's contact info and quotes are available!
Key facts
- Gated community
- Pumice home
- Open floor plan
Tags
Property features AI
Finance
- Other: Current uses include residential, recreational, single family, and fishing rights; Possible uses include residential, recreational, and fishing rights; Approximately 3.44 acres
- HOA & community: Part of La Jara Creek Acres homeowners association
Exterior
- Parking: Detached garage; 1 garage space
- Utilities: Well water; Septic tank; Photovoltaic (solar) power production
- Home design: Single-story home; Stone and stick-built construction
- Construction: Metal roof
- Exterior features: Creek frontage; Waterfront property; Other structures include garage(s)
Interior
- Bathrooms: 1 full bathroom
- Interior features: Unfurnished; Has a view
Neighborhood map
What this means for you Summary
Snapshot
- This is a 2-bed/1.0-bath single-family listed at $108k.
Deal economics
- At list price, monthly cash flow is $66 ($795/yr) — positive.
- The deal already cash-flows at list — no discount required.
- To meet the 1% rule (rent ≥ 1% of price), the offer needs to be $102k (4.7% below list).
- Recommended offer: $98k (9.0% below list) — sets the bar for market timing.
Location & tenants
- Location reads 45/100 on livability (#431 in CO) — a working-class tenant base; expect higher turnover. Watch: health & safety C-, schools F, crime F.
- North Conejos School District No. Re1J (rural): math 32% / reading 46% proficiency, ranked #33 of 86 in CO (top 38%) — families likely to look elsewhere, expect single-tenant / working-renter base with shorter leases.
- Market conditions: 16 active listings in the ZIP; 39 units permitted in Conejos County in 2024 (0 in 5+ unit buildings).
Forward outlook
- In year one you build about $4k of equity ($743 loan paydown + $3k appreciation (3.0% local appreciation)).
- Conejos County population projected at -25% by 2050 — secular population decline; favor cash flow + early exit over multi-decade hold.
- At projected returns (3.0% appreciation + 3.0% rent growth), your $30k cash investment doubles in ~6 years — after that, you're playing with house money.
- By year 9, paydown + projected appreciation supports a ~$34k cash-out refi (75% LTV) — recoverable capital for the next deal without selling this one.
Negotiation context
- It's been on market 99 days — a 9% lower offer ($98k) is reasonable based on typical stale-listing flexibility.
- 2 sale attempts with the ask held roughly flat each time — persistent listings suggest the price (not the market) is what's stuck; bring a comps-based counter.
Questions for the listing agent
- It's been on market 99 days. Have you received any prior offers? Is the seller open to a 9% concession, seller financing, or rate buy-down credit?
- Why hasn't it sold? Are there any deal-killer items the seller is aware of (foundation, flood, title, zoning, code violations)?
- Is there a deadline driving the sale (1031 exchange, divorce, estate, relocation)? That informs how much negotiation room exists.
- Schools are F-rated, which usually means shorter tenancies and higher turnover. Who's the typical renter profile here, and what's been the actual vacancy rate?
- Crime grade is F in this area — have there been break-ins, vandalism, or insurance claims at this property in the last 3 years? What carrier currently insures it and at what premium?
- The area grade is low — what's the realistic commute time and amenity access for the typical tenant pool here? Any planned neighborhood developments (good or bad) we should know about?
- What's the average days-on-market for RENTAL listings here right now (not sales)? A rising rental-DOM trend means longer vacancies and softer asking-rent achievability than the comps imply.
- What's the recent tenant-quality profile in this submarket — average credit score on applications, eviction rate, late-payment / NSF rate, and stable-employment percentage? A property-management company in the area should have these aggregated.
- How much new for-sale + rental construction is in the pipeline within 1–3 miles? Heavy new supply typically softens prices + rents 12–24 months out; constrained supply supports both.
Investment metrics
- 1% rule
- 0.95% ✗
- Cap rate
- 7.03%
- Cash-on-cash
- 2.64%
- DSCR
- 1.12
- GRM
- 8.7
CMA / ARV
No comps found within radius.
Projected returns pro-forma
3.0% appreciation · 3.0% rent growth · sell at horizon
- IRR
- 10.0%
- Equity multiple
- 1.57×
- Total profit
- $17,186
- Equity at exit
- $48,337
- IRR
- 12.3%
- Equity multiple
- 2.84×
- Total profit
- $55,303
- Equity at exit
- $74,493
Cash invested: $30,100 (down + closing). Projections, not guarantees.
Landlord ↔ Tenant lean methodology
- Overall (STATE)
- 38 Tenant-Leaning
- State Colorado
- 38 Tenant-Leaning · D+4
- County
- — inherits STATE
- City
- — inherits STATE
ZIP-level market 81124
- Active inventory
- 16
- Price-to-rent
- 8.7×
Monthly cashflow live
- Estimated rent
- $1,024 medium interval (Pro) →
- Mortgage (P&I)
- −$564
- Tax est. 1.5%
- −$134 /mo · $1,612/yr
- Insurance
- −$45
- HOA
- −$0
- Vacancy / Maint / Mgmt
- −$215
- Net cashflow
- $66
Break-even live
UW: 25.0% down · 7.5% · 30yr · 1.5% tax · 5.0% vac · 8.0% maint · 8.0% mgmt
Financing live
Cash to close
- Down payment
- $26,875
- Closing costs
- $3,225
- Reserves months
- —
- Total cash needed
- —
Loan-product check · same deal, 3 products live
Conventional
25% down · 7.5% · 30yr
- Down + closing
- —
- Monthly P&I
- —
- Monthly cashflow
- —
- DSCR
- —
- Eligible?
- —
Personal DTI + credit; lowest rate.
DSCR
20% down · 8.5% · 30yr
- Down + closing
- —
- Monthly P&I
- —
- Monthly cashflow
- —
- DSCR
- —
- Eligible?
- —
No personal income docs; deal must DSCR.
Hard money
10% down · 12.0% · 12mo
- Down + closing
- —
- Monthly P&I
- —
- Monthly cashflow
- —
- DSCR
- —
- Eligible?
- —
Short-term bridge; refi at stabilization.
Listing history 18 events
-
2026-06-18days on market $107,500 Active 99 DOM
-
2026-06-17days on market $107,500 Active 98 DOM
-
2026-06-16days on market $107,500 Active 97 DOM
-
2026-06-15days on market $107,500 Active 96 DOM
-
2026-06-14days on market $107,500 Active 94 DOM
-
2026-06-13days on market $107,500 Active 93 DOM
-
2026-06-10days on market $107,500 Active 91 DOM
-
2026-06-09days on market $107,500 Active 90 DOM
-
2026-06-08days on market $107,500 Active 89 DOM
-
2026-06-07days on market $107,500 Active 88 DOM
-
2026-06-03days on market $107,500 Active 84 DOM
-
2026-06-02days on market $107,500 Active 83 DOM
-
2026-06-01days on market $107,500 Active 82 DOM
-
2026-05-31days on market $107,500 Active 81 DOM
-
2026-05-31days on market $107,500 Active 80 DOM
-
2026-03-11$107,500 Active
-
2026-02-22historical
-
2025-02-20$132,500 Active
ⓘ Source: listings_history table (triggers on properties + properties_extension) + one-shot
backfill from property_details.listing_events for pre-trigger history.
Climate risk First Street
- Flood 1/10 Low 0% chance over 30 yrs
- Wildfire 4/10 Moderate
- Heat 1/10 Low 10 d/yr ≥82°F today · 27 d/yr by 30 yrs out
- Wind 1/10 Low
- Air quality 1/10 Low 0 unhealthy d/yr today · 0 by 30 yrs out
Nearby sold comps map
Loading sold comps map…
Walkable amenities ~0.75 mi
Loading nearby amenities…
Taxation est. · year 1
- Rental income
- $12,291
- − Mortgage interest
- −$6,022
- − Property taxes
- −$1,612
- − Insurance
- −$538
- − Repairs & maintenance
- −$983
- − Management
- −$983
- − Depreciation
- −$3,127
- Taxable loss
- −$974
- Est. tax savings @ 24.0%
- +$234
- After-tax cash flow
- $1,029/yr
For passive investors: Depreciation is non-cash, so a rental often shows a tax loss while cash-flowing — sheltering income. Rental losses are passive: they offset passive income freely, and up to $25,000/yr can offset ordinary (W-2) income if you actively participate and your MAGI is under $100k (phasing out to $0 by $150k); unused losses carry forward. On sale, claimed depreciation is recaptured at up to 25%, and gains may owe capital-gains tax (a 1031 exchange can defer both). Figures are a year-1 estimate at your 24.0% rate — not tax advice; consult a CPA.
Schools (NCES district)
- District
- North Conejos School District No. Re1J
- NCES district ID
- 0805100
- Math proficiency
- 32% ▼ -4.00%
- Reading proficiency
- 46% ▼ -8.00%
- Median HH income
- $37,238
- Composite
- 32.39/100
- National rank
- #5732
- State rank
- #33 of 86 in CO
Livability — Capulin
- Score
- 45/100
- State rank
- #431
- US rank
- #26686
Category grades
Schools grade is shown separately in the Schools card above.
Census & demographics
- City population
- 332
- Population (ZIP)
- 332
Population outlook (Conejos County) Hauer SSP2
- Today (2025)
- 7,690 people
- By 2030
- 7,358 · -4.3%
- By 2040
- 6,576 · -14.5%
- By 2050
- 5,778 · -24.9%
- By 2075
- 4,221 · -45.1%
- By 2100
- 2,619 · -65.9%
Race, ethnicity, and origin ACS 2023
- Neighborhood character
- Predominantly Hispanic (88%)
- Race & ethnicity
- Hispanic / Latino 88% Native American 20% Two or more races 11%
- Hispanic origin (detail)
- Mexican 80%
- Common ancestry
- Dutch 4% German 2%
- Foreign-born
- 1%
- Languages at home
- 66% English-only · Spanish 33% Tagalog/Filipino 1%
Political lean MEDSL · Conejos
- 2024 margin
- R (+17.8) · D 39.6% · R 57.5% · Other 2.9%
- 2008→2024 swing
- -30.8pp toward R · 2008: 12.9pp · 2024: -17.8pp
- All cycles
- 2024: R+17.8 2020: R+7.5 2016: R+3.3 2012: D+9.6 2008: D+12.9
Not yet ingested
- Civics
- —
Market trends
- HPI YoY
- —
- Current HPI
- —
- Rent YoY
- —
- Metro
- —
- State GDP YoY
- ▲ 1.95%
- F500 in state
- 14
Industry mix (Fortune 500 HQ in CO)
| Industry | F500 HQs | Revenue |
|---|---|---|
| Technology Distribution | 1 | $31B |
|
||
| Food / Agriculture | 1 | $18B |
|
||
| Packaging | 1 | $14B |
|
||
| Healthcare | 1 | $13B |
|
||
| Energy | 1 | $10B |
|
||
| Technology | 1 | $4B |
|
||
Price history
-18.9% since first listed3 events — show timeline
- 2026-03-11 Listed $107,500 cren
- 2026-02-22 Listing Removed — cren
- 2025-02-20 Listed $132,500 cren
Cash-flow waterfall
monthlySold comps — $/sqft
last 12 mo · ≤1 miLoading sold comps…