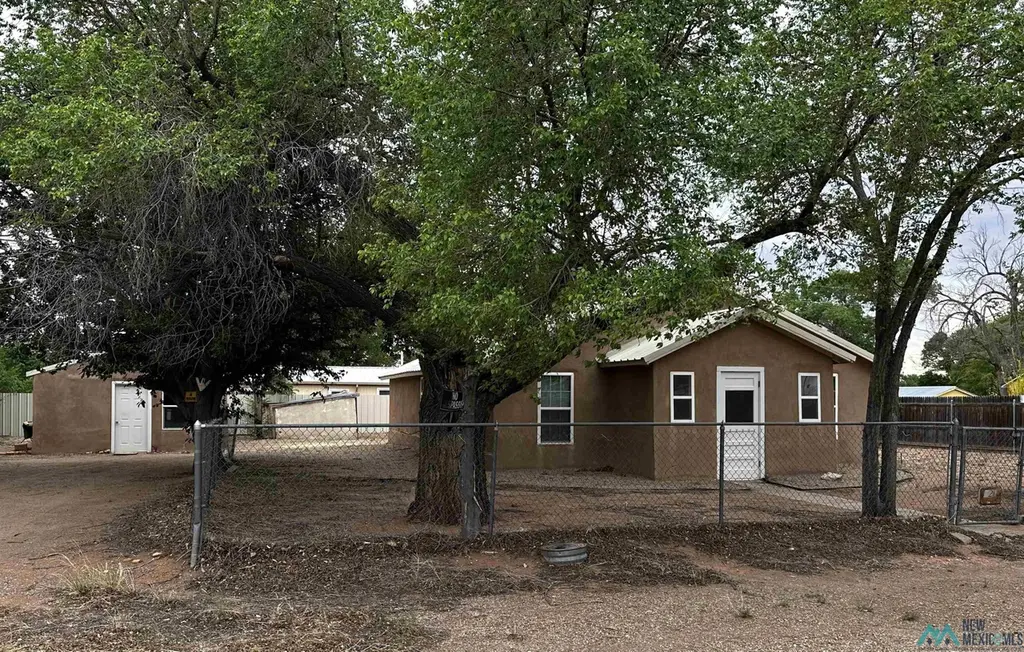
381 E Lake Ave · Fort Sumner, NM
Flood risk No data
- FEMA flood zone
- —
- Chance of flooding over 30 yrs
- —
- Est. flood insurance / yr
- —
Fire risk No data
- Est. fire insurance / yr
- —
Heat risk No data
- Hot days now (above threshold)
- —
- Hot days in 30 yrs
- —
Wind risk No data
- Chance of severe wind over 30 yrs
- —
Air-quality risk No data
- Unhealthy air days now
- —
- Unhealthy air days in 30 yrs
- —
Risk factors via First Street. Map © Google.
Why this score? — see what drove the D grade
The composite is a weighted blend of 9 inputs, each scored 0–100. Each bar is that input's sub-score; the figure is the points it added to the 100-point composite (weight × sub-score).
- Cash flow +11.0/30.0
- ARV discount +7.5/15.0
- Appreciation +6.2/10.0
- Schools +3.3/10.0
- DSCR +3.2/10.0
- Livability +3.1/5.0
- Rent growth +2.5/5.0
- Condition / age +2.5/5.0
- 1% rule +2.2/10.0
$133,000
🖨 Deal sheet 📄 Offer letter ✓ Due diligence
Listing remarks MLS
Super cute recently updated 3 bedroom 1 bath house located in Fort Sumner. New windows, central air and heat with a heat pump, flooring, on demand water heater, and kitchen cabinets with countertop. This house has had a total makeover and is ready for its new owner. It also has a workshop/storage building with cement flooring and a new metal roof.
Key facts
- Built 1945
- Listed 45 days
Property features AI
Exterior
- Parking: No garage
- Utilities: Electricity connected
- Home design: Single family residence; Residential property
- Construction: Stucco construction; Metal roof
- Exterior features: Chain link and wood fencing; Irregular lot
Interior
- Kitchen: Range hood, Free-standing range; Refrigerator
- Flooring: Laminate flooring
- Bathrooms: 1 full bathroom
- Heating & cooling: Forced air heating; Electric cooling
- Interior features: Dryer, Washer; Range hood, Free-standing range; Refrigerator; Electric water heater
- Laundry & utility: Washer and dryer included; Electric water heater
Neighborhood map
What this means for you Summary
Snapshot
- This is a 3-bed/1.0-bath other listed at $133k.
Deal economics
- At list price, monthly cash flow is $-56 ($-676/yr) — negative.
- To cash-flow at today's rent, offer at most $123k (7.5% below list).
- To meet the 1% rule (rent ≥ 1% of price), the offer needs to be $96k (27.7% below list).
- Recommended offer: $96k (27.7% below list) — sets the bar for 1% rule.
Location & tenants
- Location reads 62/100 on livability (#86 in NM) — a middle-class / working-renter tenant base. Strengths: cost of living A+, housing A+; Watch: health & safety C-, schools F, amenities F.
- Fort Sumner Municipal Schools (rural): math 25% / reading 50% proficiency, ranked #18 of 95 in NM (top 19%) — families likely to look elsewhere, expect single-tenant / working-renter base with shorter leases.
- Market conditions: 30 active listings in the ZIP.
Forward outlook
- In year one you build about $4k of equity ($920 loan paydown + $3k appreciation (2.4% local appreciation)).
- De Baca County population projected at -29% by 2050 — secular population decline; favor cash flow + early exit over multi-decade hold.
- At projected returns (2.4% appreciation + 3.0% rent growth), your $37k cash investment doubles in ~8 years — after that, you're playing with house money.
- By year 8, paydown + projected appreciation supports a ~$30k cash-out refi (75% LTV) — recoverable capital for the next deal without selling this one.
Negotiation context
- It's been on market 46 days — a 3% lower offer ($129k) is reasonable based on typical stale-listing flexibility.
- 2 sale attempts since 4y ago with the ask held roughly flat each time — persistent listings suggest the price (not the market) is what's stuck; bring a comps-based counter.
Risks & watch-outs
- Watch-outs: built in 1945 — expect roof / HVAC / electrical / plumbing capex.
Questions for the listing agent
- What do current leases actually rent for vs. the listed asking? Can we see a recent rent roll and the last 12 months of T-12 income?
- It's been on market 46 days. Have you received any prior offers? Is the seller open to a 28% concession, seller financing, or rate buy-down credit?
- Built in 1945 — when were the roof, HVAC, electrical panel, plumbing, and water heater last replaced?
- Is there a deadline driving the sale (1031 exchange, divorce, estate, relocation)? That informs how much negotiation room exists.
- Schools are F-rated, which usually means shorter tenancies and higher turnover. Who's the typical renter profile here, and what's been the actual vacancy rate?
- The area grade is low — what's the realistic commute time and amenity access for the typical tenant pool here? Any planned neighborhood developments (good or bad) we should know about?
- What's the average days-on-market for RENTAL listings here right now (not sales)? A rising rental-DOM trend means longer vacancies and softer asking-rent achievability than the comps imply.
- What's the recent tenant-quality profile in this submarket — average credit score on applications, eviction rate, late-payment / NSF rate, and stable-employment percentage? A property-management company in the area should have these aggregated.
- How much new for-sale + rental construction is in the pipeline within 1–3 miles? Heavy new supply typically softens prices + rents 12–24 months out; constrained supply supports both.
Investment metrics
- 1% rule
- 0.72% ✗
- Cap rate
- 5.79%
- Cash-on-cash
- -1.81%
- DSCR
- 0.92
- GRM
- 11.5
CMA / ARV
No comps found within radius.
Projected returns pro-forma
2.37% appreciation · 3.0% rent growth · sell at horizon
- IRR
- 3.9%
- Equity multiple
- 1.22×
- Total profit
- $8,015
- Equity at exit
- $55,151
- IRR
- 7.4%
- Equity multiple
- 2.05×
- Total profit
- $39,093
- Equity at exit
- $81,541
Cash invested: $37,240 (down + closing). Projections, not guarantees.
Landlord ↔ Tenant lean methodology
- Overall (STATE)
- 55 Moderately Landlord-Leaning
- State New Mexico
- 55 Moderately Landlord-Leaning · D+3
- County
- — inherits STATE
- City
- — inherits STATE
ZIP-level market 88119
- Home prices YoY
- 3.2%
- Active inventory
- 30
- Price-to-rent
- 11.5×
Monthly cashflow live
- Estimated rent
- $962 medium interval (Pro) →
- Mortgage (P&I)
- −$697
- Tax from tax record
- −$63 /mo · $760/yr
- Insurance
- −$55
- HOA
- −$0
- Vacancy / Maint / Mgmt
- −$202
- Net cashflow
- $-56
Break-even live
Sensitivity live
| Price | -10% $19 | -5% $-19 | +0% $-56 | +5% $-94 | +10% $-132 |
|---|---|---|---|---|---|
| Rent | -10% $-132 | -5% $-94 | +0% $-56 | +5% $-18 | +10% $20 |
| Rate | -1.0pp $11 | -0.5pp $-22 | base $-56 | +0.5pp $-91 | +1.0pp $-126 |
UW: 25.0% down · 7.5% · 30yr · 1.5% tax · 5.0% vac · 8.0% maint · 8.0% mgmt
Financing live
Cash to close
- Down payment
- $33,250
- Closing costs
- $3,990
- Reserves months
- —
- Total cash needed
- —
Loan-product check · same deal, 3 products live
Conventional
25% down · 7.5% · 30yr
- Down + closing
- —
- Monthly P&I
- —
- Monthly cashflow
- —
- DSCR
- —
- Eligible?
- —
Personal DTI + credit; lowest rate.
DSCR
20% down · 8.5% · 30yr
- Down + closing
- —
- Monthly P&I
- —
- Monthly cashflow
- —
- DSCR
- —
- Eligible?
- —
No personal income docs; deal must DSCR.
Hard money
10% down · 12.0% · 12mo
- Down + closing
- —
- Monthly P&I
- —
- Monthly cashflow
- —
- DSCR
- —
- Eligible?
- —
Short-term bridge; refi at stabilization.
Listing history 21 events
-
2026-06-19days on market $133,000 Active 46 DOM
-
2026-06-18days on market $133,000 Active 45 DOM
-
2026-06-17days on market $133,000 Active 44 DOM
-
2026-06-16days on market $133,000 Active 43 DOM
-
2026-06-15days on market $133,000 Active 42 DOM
-
2026-06-14days on market $133,000 Active 40 DOM
-
2026-06-12pricedays on market $133,000 Active 39 DOM
-
2026-06-09days on market $138,000 Active 36 DOM
-
2026-06-08days on market $138,000 Active 35 DOM
-
2026-06-07days on market $138,000 Active 34 DOM
-
2026-06-05days on market $138,000 Active 31 DOM
-
2026-06-03days on market $138,000 Active 30 DOM
-
2026-06-02days on market $138,000 Active 29 DOM
-
2026-06-01days on market $138,000 Active 28 DOM
-
2026-05-31days on market $138,000 Active 27 DOM
-
2026-05-30days on market $138,000 Active 26 DOM
-
2026-05-04$138,000 Active 852-char remark
-
2025-10-31price $129,000
-
2025-08-25price $134,000
-
2022-07-19soldstatus
Show marketing remark (349 chars)
Super cute recently updated 3 bedroom 1 bath house located in Fort Sumner. New windows, central air and heat with a heat pump, flooring, on demand water heater, and kitchen cabinets with countertop. This house has had a total makeover and is ready for its new owner. It also has a workshop/storage building with cement flooring and a new metal roof.
-
2022-03-07$99,500
Show marketing remark (349 chars)
Super cute recently updated 3 bedroom 1 bath house located in Fort Sumner. New windows, central air and heat with a heat pump, flooring, on demand water heater, and kitchen cabinets with countertop. This house has had a total makeover and is ready for its new owner. It also has a workshop/storage building with cement flooring and a new metal roof.
ⓘ Source: listings_history table (triggers on properties + properties_extension) + one-shot
backfill from property_details.listing_events for pre-trigger history.
Tax reassessment forecast NM · Resets to sale price
- Current annual tax
- $760 · $63/mo
- Projected year-2 tax
- $1,064 · $89/mo
- Expected delta
- +$304/yr (+$25/mo · 39.9%)
ⓘ Screening estimate from a state-policy table — verify with the county assessor before closing.
Nearby sold comps map
Loading sold comps map…
Walkable amenities ~0.75 mi
Loading nearby amenities…
Taxation est. · year 1
- Rental income
- $11,544
- − Mortgage interest
- −$7,450
- − Property taxes
- −$760
- − Insurance
- −$665
- − Repairs & maintenance
- −$923
- − Management
- −$923
- − Depreciation
- −$3,869
- Taxable loss
- −$3,048
- Est. tax savings @ 24.0%
- +$731
- After-tax cash flow
- $56/yr
For passive investors: Depreciation is non-cash, so a rental often shows a tax loss while cash-flowing — sheltering income. Rental losses are passive: they offset passive income freely, and up to $25,000/yr can offset ordinary (W-2) income if you actively participate and your MAGI is under $100k (phasing out to $0 by $150k); unused losses carry forward. On sale, claimed depreciation is recaptured at up to 25%, and gains may owe capital-gains tax (a 1031 exchange can defer both). Figures are a year-1 estimate at your 24.0% rate — not tax advice; consult a CPA.
Schools (NCES district)
- District
- Fort Sumner Municipal Schools
- NCES district ID
- 3501050
- Math proficiency
- 25% —
- Reading proficiency
- 50% —
- Median HH income
- $33,537
- Composite
- 33.33/100
- National rank
- #10572
- State rank
- #18 of 95 in NM
Livability — Fort Sumner
- Score
- 62/100
- State rank
- #86
- US rank
- #16779
Category grades
Schools grade is shown separately in the Schools card above.
Census & demographics
- Census place
- Fort Sumner, NM
- Population (ZIP)
- 1,467
Population outlook (De Baca County) Hauer SSP2
- Today (2025)
- 1,568 people
- By 2030
- 1,458 · -7.0%
- By 2040
- 1,272 · -18.9%
- By 2050
- 1,120 · -28.6%
- By 2075
- 815 · -48.0%
- By 2100
- 511 · -67.4%
Race, ethnicity, and origin ACS 2023
- Neighborhood character
- Predominantly Hispanic (67%)
- Race & ethnicity
- Hispanic / Latino 67% White 31% Two or more races 15%
- Hispanic origin (detail)
- Mexican 22%
- Common ancestry
- Serbian 1%
- Foreign-born
- 0% · Canada
- Languages at home
- 62% English-only · Spanish 37% French/Haitian/Cajun 1% German/W. Germanic 1%
Political lean MEDSL · De Baca
- 2024 margin
- Solid R (+50.7) · D 23.6% · R 74.3% · Other 2.2%
- 2008→2024 swing
- -20.3pp toward R · 2008: -30.4pp · 2024: -50.7pp
- All cycles
- 2024: R+50.7 2020: R+47.2 2016: R+47.1 2012: R+33.2 2008: R+30.4
Not yet ingested
- Civics
- —
Market trends
- HPI YoY
- ▲ 2.37%
- Current HPI
- 75.3427
- Rent YoY
- —
- Metro
- —
- State GDP YoY
- —
- F500 in state
- 0
Price history
+33.7% since first listed6 events — show timeline
- 2026-06-09 Price Changed $133,000 NMMLS
- 2026-05-04 Listed $138,000 NMMLS
- 2025-10-31 Price Changed $129,000 NMMLS
- 2025-08-25 Price Changed $134,000 NMMLS
- 2022-07-19 Sold (MLS) — NMMLS
- 2022-03-07 Listed $99,500 NMMLS
Property tax history
+12.2%/yrLatest (2025): $760 · +36.6% YoY. Source: county tax records.
Cash-flow waterfall
monthlySold comps — $/sqft
last 12 mo · ≤1 miLoading sold comps…