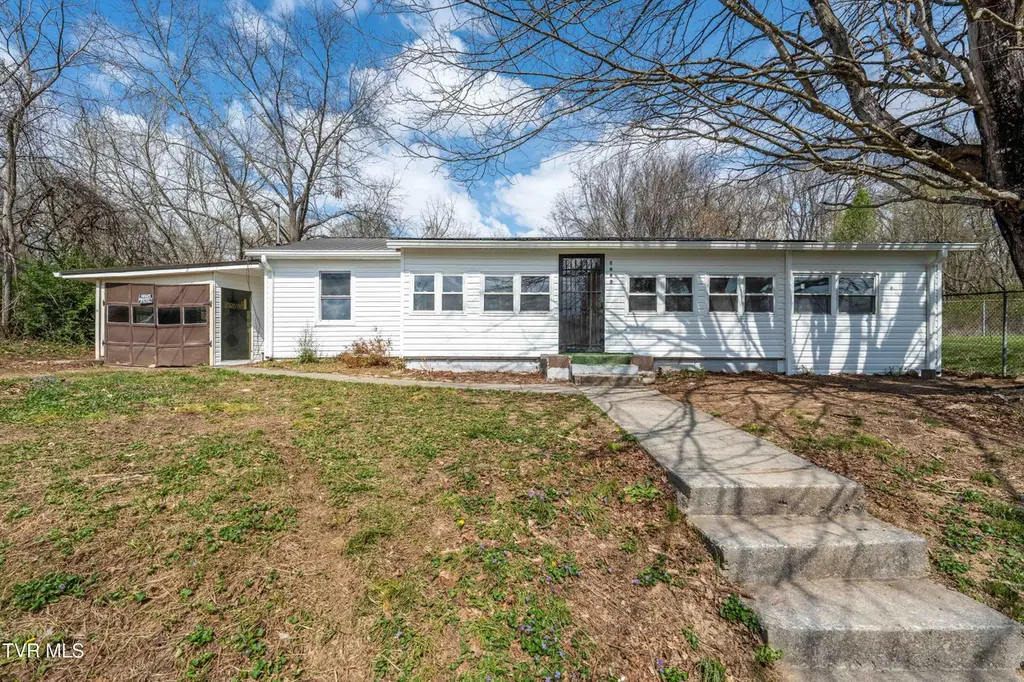
1663 Bristol Caverns Hwy · Bristol, TN
Flood risk 8/10 · Major
- FEMA flood zone
- A
- Chance of flooding over 30 yrs
- 0.99%
- Est. flood insurance / yr
- $1,009 – $1,996
Fire risk 5/10 · Moderate
- Est. fire insurance / yr
- $949 – $1,763
Heat risk 4/10 · Minor
- Hot days now (above 99°F)
- 7 days/yr
- Hot days in 30 yrs
- 20 days/yr
Wind risk 2/10 · Minimal
- Chance of severe wind over 30 yrs
- —
Air-quality risk 2/10 · Minimal
- Unhealthy air days now
- 2 days/yr
- Unhealthy air days in 30 yrs
- 2 days/yr
Risk factors via First Street. Map © Google.
Why this score? — see what drove the D grade
The composite is a weighted blend of 9 inputs, each scored 0–100. Each bar is that input's sub-score; the figure is the points it added to the 100-point composite (weight × sub-score).
- Cash flow +17.8/30.0
- DSCR +5.6/10.0
- ARV discount +5.5/15.0
- Livability +3.7/5.0
- 1% rule +3.6/10.0
- Rent growth +2.5/5.0
- Condition / age +2.5/5.0
- Schools +1.8/10.0
- Appreciation +0.0/10.0
$189,500
🖨 Deal sheet (PDF) 📄 Offer letter ✓ Due diligence
Listing remarks
Welcome to 1663 Bristol Caverns Highway in Bristol, TN! This 3-bedroom, 1-bath home has been thoughtfully updated and is ready for its next owner. Recent improvements include an updated bathroom, brand new siding, brand new HVAC, brand new carpet in the bedrooms, and new appliances, giving buyers peace of mind and a fresh, move-in-ready feel from the start. With a comfortable layout and quality updates throughout, this home is a great fit for a variety of buyers. Conveniently located with easy access to shopping, dining, schools, and everything Bristol has to offer, this property combines modern updates with everyday convenience. Whether you are a first-time buyer, looking to downsize, or s
Key facts
- New siding
- New carpet
- New hvac
Tags
Property features AI
Exterior
- Parking: Detached 1-car garage
- Utilities: Public water; Septic tank
- Home design: Single-family residence; One story; Residential property
- Construction: Vinyl siding construction; House structure
- Exterior features: Level lot; Metal roof
Interior
- Kitchen: Dishwasher; Electric range; Refrigerator
- Bedrooms: 5 total rooms (bedroom count not specified)
- Flooring: Carpet; Hardwood
- Bathrooms: 1 full bathroom
- Heating & cooling: Central heating; Heat pump; Central air conditioning
- Interior features: Dishwasher; Electric range; Refrigerator
- Laundry & utility: Washer hookup; Electric dryer hookup
Neighborhood map
What this means for you Summary
Snapshot
- This is a 3-bed/1.0-bath single-family listed at $190k.
Deal economics
- At list price, monthly cash flow is $29 ($351/yr) — positive.
- The deal already cash-flows at list — no discount required.
- To meet the 1% rule (rent ≥ 1% of price), the offer needs to be $163k (13.9% below list).
- Recommended offer: $163k (13.9% below list) — sets the bar for 1% rule.
- Cap rate 7.3% vs local median 3.8% in Bristol — top-decile yield for the area; either an underpriced asset or a hidden risk that comps aren't pricing in. Stress-test before assuming the spread holds.
Location & tenants
- Location reads 73/100 on livability (#24 in TN) — a middle-class / working-renter tenant base. Strengths: cost of living A+, housing A+, health & safety A+; Watch: crime D+, commute F, employment F.
- Sullivan County (suburban): math 17% / reading 24% proficiency, ranked #109 of 139 in TN (top 78%) — low school quality limits family demand, transient renter base, plan for 1-2y turnover.
- Zoned schools: Emmett Elementary (math 17% / reading 27%, grade F, #601 of 952 statewide, top 66%, 333 students, 0% FRL); Sullivan East Middle School (math 8% / reading 11%, grade F, #260 of 333 statewide, top 79%, 573 students, 0% FRL); Sullivan East High School (math 10% / reading 27%, grade F, #208 of 332 statewide, top 63%, 849 students, 0% FRL) — zoned schools average 0% FRL vs 45% district-wide (45 pts lower); this property's tenant base skews higher-income than the district average.
- Market conditions: 259 active listings in the ZIP; 453 units permitted in Sullivan County in 2024 (6 in 5+ unit buildings).
- This rent runs 35% of the median local income ($56k/yr) — at the standard rent-burdened threshold; future hikes will face affordability resistance.
Forward outlook
- Local home prices are declining (-3.0%/yr); year-one equity from $1k of loan paydown is wiped out by about $6k of value loss. Plan a longer hold.
- Sullivan County population projected to shrink 5% by 2050 — rents likely to lag national; underwrite the cash flow, not the appreciation.
Negotiation context
- It's been on market 27 days — a 2% lower offer ($187k) is reasonable based on typical stale-listing flexibility.
- Current owner paid $110k; list at $190k implies a 72% gain — meaningful room to come down on a strong offer.
Risks & watch-outs
- Watch-outs: flood insurance adds $125/mo.
- Climate carrying-cost: in FEMA flood zone A (mandatory federal flood insurance); moderate wildfire risk — expect insurance premiums to compound above CPI over the hold.
Questions for the listing agent
- Built in 1971 — when were the roof, HVAC, electrical panel, plumbing, and water heater last replaced?
- What's the actual annual flood-insurance premium (NFIP or private), and is the property in a SFHA with mandatory coverage?
- Is there a deadline driving the sale (1031 exchange, divorce, estate, relocation)? That informs how much negotiation room exists.
- Schools are D-rated, which usually means shorter tenancies and higher turnover. Who's the typical renter profile here, and what's been the actual vacancy rate?
- Crime grade is D in this area — have there been break-ins, vandalism, or insurance claims at this property in the last 3 years? What carrier currently insures it and at what premium?
- The area grade is low — what's the realistic commute time and amenity access for the typical tenant pool here? Any planned neighborhood developments (good or bad) we should know about?
- What's the average days-on-market for RENTAL listings here right now (not sales)? A rising rental-DOM trend means longer vacancies and softer asking-rent achievability than the comps imply.
- What's the recent tenant-quality profile in this submarket — average credit score on applications, eviction rate, late-payment / NSF rate, and stable-employment percentage? A property-management company in the area should have these aggregated.
- How much new for-sale + rental construction is in the pipeline within 1–3 miles? Heavy new supply typically softens prices + rents 12–24 months out; constrained supply supports both.
Investment metrics
- 1% rule
- 0.86% ✗
- Cap rate
- 7.27%
- Cash-on-cash
- 3.49%
- DSCR
- 1.16
- GRM
- 9.7
CMA / ARV
- ARV (on-the-fly)
- $181,250
- Comps found
- 4
Show comp detail 4 sales within ~0.75 mi
| Address | Dist | Beds/Ba | Sqft | Sold | Price | $/sf | Match |
|---|---|---|---|---|---|---|---|
| 1663 Bristol Caverns Hwy | 0.00mi | 3/1.0 | 1,350 (+8%) | 1mo | $196,000 | $145 | 86 |
| 1667 Bristol Caverns Hwy | 0.02mi | 3/1.0 | 1,144 (-8%) | 10mo | $56,500 | $49 | 77 |
| 1424 Bristol Caverns Hwy | 0.42mi | 3/2.0 | 1,156 (-8%) | 1mo | $200,000 | $173 | 63 |
| 1598 Bristol Caverns Hwy | 0.21mi | 2/2.0 (-1) | 1,404 (+12%) | 5mo | $175,000 | $125 | 56 |
Match score weights: distance 35% · size 25% · config 20% · recency 20%. Top-matched comps best support the ARV.
Projected returns pro-forma
-3.0% appreciation · 3.0% rent growth · sell at horizon
- IRR
- -15.2%
- Equity multiple
- 0.46×
- Total profit
- $-28,848
- Equity at exit
- $28,255
- IRR
- -6.7%
- Equity multiple
- 0.57×
- Total profit
- $-22,744
- Equity at exit
- $16,384
Cash invested: $53,060 (down + closing). Projections, not guarantees.
Landlord ↔ Tenant lean methodology
- Overall (STATE)
- 87 Strongly Landlord-Friendly
- State Tennessee
- 87 Strongly Landlord-Friendly · R+13
- County
- — inherits STATE
- City
- — inherits STATE
ZIP-level market 37620
- Active inventory
- 259
- Price-to-rent
- 9.7×
Monthly cashflow live
- Estimated rent
- $1,631 medium interval (Pro) →
- Mortgage (P&I)
- −$994
- Tax from tax record
- −$61 /mo · $736/yr
- Insurance
- −$79
- Flood insurance flood zone
- −$125 /mo · $1,502/yr
- HOA
- −$0
- Vacancy / Maint / Mgmt
- −$343
- Net cashflow
- $29
Break-even live
Sensitivity live
| Price | -10% $137 | -5% $83 | +0% $29 | +5% $-24 | +10% $-78 |
|---|---|---|---|---|---|
| Rent | -10% $-100 | -5% $-35 | +0% $29 | +5% $94 | +10% $158 |
| Rate | -1.0pp $125 | -0.5pp $77 | base $29 | +0.5pp $-20 | +1.0pp $-70 |
UW: 25.0% down · 7.5% · 30yr · 1.5% tax · 5.0% vac · 8.0% maint · 8.0% mgmt
Financing live
Cash to close
- Down payment
- $47,375
- Closing costs
- $5,685
- Reserves months
- —
- Total cash needed
- —
Loan-product check · same deal, 3 products live
Conventional
25% down · 7.5% · 30yr
- Down + closing
- —
- Monthly P&I
- —
- Monthly cashflow
- —
- DSCR
- —
- Eligible?
- —
Personal DTI + credit; lowest rate.
DSCR
20% down · 8.5% · 30yr
- Down + closing
- —
- Monthly P&I
- —
- Monthly cashflow
- —
- DSCR
- —
- Eligible?
- —
No personal income docs; deal must DSCR.
Hard money
10% down · 12.0% · 12mo
- Down + closing
- —
- Monthly P&I
- —
- Monthly cashflow
- —
- DSCR
- —
- Eligible?
- —
Short-term bridge; refi at stabilization.
Listing history 4 events
-
2026-04-30status Pending
-
2026-04-27price $189,500
-
2026-04-03$199,900 Active
-
2025-11-12soldstatus $110,000
ⓘ Source: listings_history table (triggers on properties + properties_extension) + one-shot
backfill from property_details.listing_events for pre-trigger history.
Tax reassessment forecast TN · Resets to sale price
- Current annual tax
- $736 · $61/mo
- Projected year-2 tax
- $1,345 · $112/mo
- Expected delta
- +$609/yr (+$51/mo · 82.8%)
ⓘ Screening estimate from a state-policy table — verify with the county assessor before closing.
Climate risk First Street
- Flood 8/10 Severe FEMA zone A · 99% chance over 30 yrs
- Wildfire 5/10 Major
- Heat 4/10 Moderate 7 d/yr ≥99°F today · 20 d/yr by 30 yrs out
- Wind 2/10 Low
- Air quality 2/10 Low 2 unhealthy d/yr today · 2 by 30 yrs out
Nearby sold comps map
Loading sold comps map…
Walkable amenities ~0.75 mi
Loading nearby amenities…
Taxation est. · year 1
- Rental income
- $19,573
- − Mortgage interest
- −$10,615
- − Property taxes
- −$736
- − Insurance
- −$2,450
- − Repairs & maintenance
- −$1,566
- − Management
- −$1,566
- − Depreciation
- −$5,513
- Taxable loss
- −$2,872
- Est. tax savings @ 24.0%
- +$689
- After-tax cash flow
- $1,041/yr
For passive investors: Depreciation is non-cash, so a rental often shows a tax loss while cash-flowing — sheltering income. Rental losses are passive: they offset passive income freely, and up to $25,000/yr can offset ordinary (W-2) income if you actively participate and your MAGI is under $100k (phasing out to $0 by $150k); unused losses carry forward. On sale, claimed depreciation is recaptured at up to 25%, and gains may owe capital-gains tax (a 1031 exchange can defer both). Figures are a year-1 estimate at your 24.0% rate — not tax advice; consult a CPA.
Schools (NCES district)
- District
- Sullivan County
- NCES district ID
- 4703990
- Math proficiency
- 17% ▼ -15.00%
- Reading proficiency
- 24% ▼ -10.00%
- Median HH income
- $43,263
- Composite
- 17.66/100
- National rank
- #9030
- State rank
- #109 of 139 in TN
Livability — Bristol
- Score
- 73/100
- State rank
- #24
- US rank
- #5413
Category grades
Schools grade is shown separately in the Schools card above.
Census & demographics
- County
- Sullivan County · 121,987 people
- City population
- 38,494
- Metro
- Kingsport-Bristol, TN-VA
- Population (ZIP)
- 38,494
- Household income
- $56,128
- Rent vs Own
- Severe rent burden
- 724.0
Population outlook (Sullivan County) Hauer SSP2
- Today (2025)
- 157,030 people
- By 2030
- 156,415 · -0.4%
- By 2040
- 153,778 · -2.1%
- By 2050
- 149,018 · -5.1%
- By 2075
- 138,068 · -12.1%
- By 2100
- 119,927 · -23.6%
Race, ethnicity, and origin ACS 2023
- Neighborhood character
- Predominantly White (91%)
- Race & ethnicity
- White 91% Two or more races 5% Hispanic / Latino 3% Black 2%
- Common ancestry
- Serbian 3% Slovak 3% Italian 1%
- Foreign-born
- 2% · Canada
- Languages at home
- 97% English-only · Spanish 2%
Political lean MEDSL · Sullivan
- 2024 margin
- Solid R (+55.0) · D 22.0% · R 77.0% · Other 1.0%
- 2008→2024 swing
- -13.6pp toward R · 2008: -41.3pp · 2024: -55.0pp
- All cycles
- 2024: R+55.0 2020: R+51.9 2016: R+56.2 2012: R+47.2 2008: R+41.3
Not yet ingested
- Civics
- —
Market trends
- HPI YoY
- ▼ -294.12%
- Current HPI
- 263.38
- Rent YoY
- —
- Metro
- Kingsport-Bristol, TN-VA
- State GDP YoY
- ▲ 2.78%
- F500 in state
- 22
Industry mix (Fortune 500 HQ in TN)
| Industry | F500 HQs | Revenue |
|---|---|---|
| Healthcare | 3 | $91B |
|
||
| Retail | 3 | $72B |
|
||
| Transportation / Logistics | 1 | $88B |
|
||
| Paper / Packaging | 1 | $19B |
|
||
| Insurance | 1 | $13B |
|
||
| Energy | 1 | $12B |
|
||
Price history
+72.3% since first listed4 events — show timeline
- 2026-04-30 Pending — TVRMLS
- 2026-04-27 Price Changed $189,500 TVRMLS
- 2026-04-03 Listed $199,900 TVRMLS
- 2025-11-12 Sold (Public Records) $110,000 Public Records
Property tax history
+4.3%/yrLatest (2025): $736 · +23.3% YoY. Source: county tax records.
Cash-flow waterfall
monthlySold comps — $/sqft
last 12 mo · ≤1 miLoading sold comps…