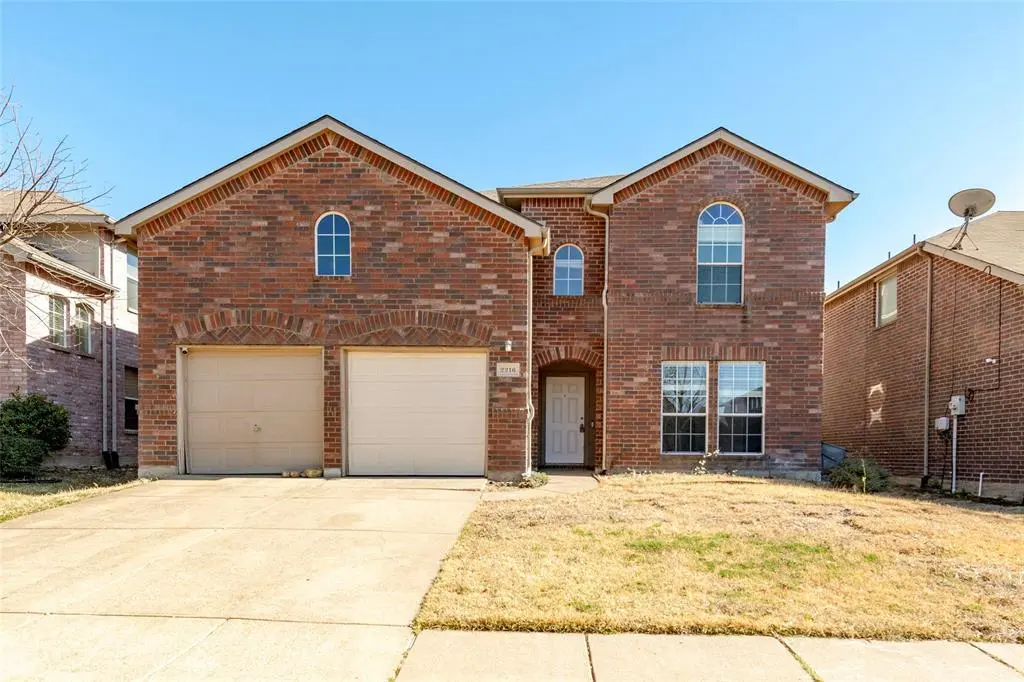
2216 Partridge Dr · Mesquite, TX
Flood risk 1/10 · Minimal
- FEMA flood zone
- X (unshaded)
- Chance of flooding over 30 yrs
- 0.0%
- Est. flood insurance / yr
- $507 – $1,088
Fire risk 3/10 · Minor
- Est. fire insurance / yr
- $1,222 – $2,270
Heat risk 8/10 · Major
- Hot days now (above 110°F)
- 7 days/yr
- Hot days in 30 yrs
- 25 days/yr
Wind risk 6/10 · Moderate
- Chance of severe wind over 30 yrs
- 27.0%
Air-quality risk 2/10 · Minimal
- Unhealthy air days now
- 1 days/yr
- Unhealthy air days in 30 yrs
- 1 days/yr
Risk factors via First Street. Map © Google.
Why this score? — see what drove the D grade
The composite is a weighted blend of 9 inputs, each scored 0–100. Each bar is that input's sub-score; the figure is the points it added to the 100-point composite (weight × sub-score).
- Cash flow +11.8/30.0
- ARV discount +10.6/15.0
- 1% rule +4.7/10.0
- DSCR +3.5/10.0
- Livability +3.5/5.0
- Schools +2.9/10.0
- Rent growth +2.5/5.0
- Condition / age +2.5/5.0
- Appreciation +0.0/10.0
$299,900
🖨 Deal sheet (PDF) 📄 Offer letter ✓ Due diligence
Listing remarks MLS
Beautifully maintained 4 bed, 2.5 bath home with formal dining, study, and gameroom in Falcon’s Lair. Open floor plan with, new flooring, recently replaced water heater and microwave, and updated lighting. HVAC and range replaced in 2019. Covered patio and convenient location near shopping, schools, and I-20.
Key facts
- Formal dining
- Study
- Open floor plan
Tags
Neighborhood map
What this means for you Summary
Snapshot
- This is a 4-bed/2.5-bath single-family listed at $300k.
Deal economics
- At list price, monthly cash flow is $-82 ($-979/yr) — negative.
- To cash-flow at today's rent, offer at most $285k (4.8% below list).
- To meet the 1% rule (rent ≥ 1% of price), the offer needs to be $291k (2.9% below list).
- Recommended offer: $273k (9.0% below list) — sets the bar for market timing.
- Cap rate 6.0% vs local median 4.4% in Mesquite — top-decile yield for the area; either an underpriced asset or a hidden risk that comps aren't pricing in. Stress-test before assuming the spread holds.
Location & tenants
- Location reads 70/100 on livability (#358 in TX) — a middle-class / working-renter tenant base. Strengths: cost of living A+, housing A+, health & safety A-; Watch: crime F, commute F.
- Mesquite ISD (suburban): math 35% / reading 32% proficiency, ranked #536 of 826 in TX (top 65%) — families likely to look elsewhere, expect single-tenant / working-renter base with shorter leases; 63% free/reduced lunch — lower-income household profile, screen leases tightly.
- Zoned schools: Thompson El (math 20% / reading 27%, grade F, #3,247 of 4,322 statewide, top 76%, 608 students, 85% FRL); Terry Middle (math 34% / reading 32%, grade F, #930 of 1,662 statewide, top 57%, 1,049 students, 82% FRL); Horn H S (math 41% / reading 36%, grade F, #866 of 1,632 statewide, top 54%, 3,029 students, 74% FRL) — zoned schools average 80% FRL vs 63% district-wide (17 pts higher); higher-poverty schools than district average — tighter screening recommended.
- Market conditions: Rents flat; 598 active listings in the ZIP; 17 comparable units currently listed for rent nearby; rentals at typical pace (median 20d on market — plan ~3-4 weeks tenant-placement turnaround); high-income renter base; 12,577 units permitted in Dallas County in 2024 (6,829 in 5+ unit buildings).
- This rent runs 31% of the median local income ($111k/yr) — at the standard rent-burdened threshold; future hikes will face affordability resistance.
Forward outlook
- Local home prices are declining (-3.0%/yr); year-one equity from $2k of loan paydown is wiped out by about $9k of value loss. Plan a longer hold.
- Dallas County population projected at +35% by 2050 — long-run rental-demand tailwind backs the buy-and-hold thesis.
Negotiation context
- It's been on market 106 days — a 9% lower offer ($273k) is reasonable based on typical stale-listing flexibility.
- 5 sale attempts since 5y ago; this cycle's ask has dropped $30k (9%) from the opening price — seller is motivated, your offer sets the floor, not the list.
Risks & watch-outs
- Watch-outs: property tax is 2.6% of price.
- Climate carrying-cost: major wind risk, 27% chance of damaging wind over 30y; extreme-heat days projected 7→25/yr by 2055 (HVAC capex compounding) — expect insurance premiums to compound above CPI over the hold.
Questions for the listing agent
- What do current leases actually rent for vs. the listed asking? Can we see a recent rent roll and the last 12 months of T-12 income?
- It's been on market 106 days. Have you received any prior offers? Is the seller open to a 9% concession, seller financing, or rate buy-down credit?
- Property tax is high relative to price — has the assessment been appealed recently, and will the sale trigger a re-assessment?
- What does the HOA fee cover, when was the last increase, and are there any pending special assessments or reserve-fund shortfalls?
- Why hasn't it sold? Are there any deal-killer items the seller is aware of (foundation, flood, title, zoning, code violations)?
- Is there a deadline driving the sale (1031 exchange, divorce, estate, relocation)? That informs how much negotiation room exists.
- Crime grade is F in this area — have there been break-ins, vandalism, or insurance claims at this property in the last 3 years? What carrier currently insures it and at what premium?
- The area grade is low — what's the realistic commute time and amenity access for the typical tenant pool here? Any planned neighborhood developments (good or bad) we should know about?
- What's the average days-on-market for RENTAL listings here right now (not sales)? A rising rental-DOM trend means longer vacancies and softer asking-rent achievability than the comps imply.
- What's the recent tenant-quality profile in this submarket — average credit score on applications, eviction rate, late-payment / NSF rate, and stable-employment percentage? A property-management company in the area should have these aggregated.
- How much new for-sale + rental construction is in the pipeline within 1–3 miles? Heavy new supply typically softens prices + rents 12–24 months out; constrained supply supports both.
Investment metrics
- 1% rule
- 0.97% ✗
- Cap rate
- 5.97%
- Cash-on-cash
- -1.17%
- DSCR
- 0.95
- GRM
- 8.6
CMA / ARV
- ARV (median comp)
- $322,380
- List price
- $299,900
- Delta
- -6.97%
- Verdict
- FAIR
- Comps
- 20 within 1.0 mi
Show comp detail 12 sales within ~0.75 mi
| Address | Dist | Beds/Ba | Sqft | Sold | Price | $/sf | Match |
|---|---|---|---|---|---|---|---|
| 2400 Becard Dr | 0.24mi | 4/2.5 | 2,633 (-5%) | 1mo | $330,000 | $125 | 80 |
| 3400 Silver Creek Dr | 0.24mi | 4/2.5 | 2,856 (+3%) | 3mo | $295,000 | $103 | 80 |
| 3205 Bent Oak Dr | 0.40mi | 4/2.5 | 2,724 (-1%) | 1mo | $320,000 | $117 | 78 |
| 3700 Kiwi Ln | 0.25mi | 4/2.5 | 2,838 (+3%) | 11mo | $350,000 | $123 | 74 |
| 2056 Pinenut Dr | 0.52mi | 4/2.5 | 2,724 (-1%) | 6mo | $310,000 | $114 | 68 |
| 2837 Island Wren Dr | 0.55mi | 4/2.5 | 2,638 (-5%) | 0mo | $314,900 | $119 | 66 |
| 4981 Kingfisher Ln | 0.45mi | 4/2.5 | 2,638 (-5%) | 10mo | $334,000 | $127 | 63 |
| 2317 Raven Ct | 0.18mi | 5/2.5 (+1) | 2,997 (+8%) | 13mo | $410,000 | $137 | 62 |
| 4829 Kingfisher Ln | 0.63mi | 5/2.5 (+1) | 2,720 (-2%) | 12mo | $314,000 | $115 | 53 |
| 3012 Walnut Ridge Ln | 0.64mi | 3/2.5 (-1) | 2,559 (-7%) | 12mo | $289,600 | $113 | 43 |
| 2169 Lone Pecan Dr | 0.72mi | 4/2.5 | 2,435 (-12%) | 6mo | $249,900 | $103 | 42 |
| 2409 Saddlehorn Dr | 0.72mi | 3/2.0 (-1) | 2,438 (-12%) | 3mo | $320,000 | $131 | 37 |
Match score weights: distance 35% · size 25% · config 20% · recency 20%. Top-matched comps best support the ARV.
Projected returns pro-forma
-3.0% appreciation · 0.07% rent growth · sell at horizon
- IRR
- -22.0%
- Equity multiple
- 0.26×
- Total profit
- $-61,900
- Equity at exit
- $44,716
- IRR
- -27.4%
- Equity multiple
- -0.09×
- Total profit
- $-91,920
- Equity at exit
- $25,930
Cash invested: $83,972 (down + closing). Projections, not guarantees.
Landlord ↔ Tenant lean methodology
- Overall (STATE)
- 87 Strongly Landlord-Friendly
- State Texas
- 87 Strongly Landlord-Friendly · R+5
- County
- — inherits STATE
- City
- — inherits STATE
ZIP-level market 75181
- Home prices YoY
- -9.4%
- Rents YoY
- 0.1%
- Active inventory
- 598
- Price-to-rent
- 8.6×
Monthly cashflow live
- Estimated rent
- $2,912 high interval (Pro) →
- Mortgage (P&I)
- −$1,573
- Tax from tax record
- −$656 /mo · $7,866/yr
- Insurance
- −$125
- HOA
- −$29
- Vacancy / Maint / Mgmt
- −$612
- Net cashflow
- $-82
Break-even live
Sensitivity live
| Price | -10% $88 | -5% $3 | +0% $-82 | +5% $-166 | +10% $-251 |
|---|---|---|---|---|---|
| Rent | -10% $-312 | -5% $-197 | +0% $-82 | +5% $33 | +10% $148 |
| Rate | -1.0pp $69 | -0.5pp $-5 | base $-82 | +0.5pp $-159 | +1.0pp $-238 |
UW: 25.0% down · 7.5% · 30yr · 1.5% tax · 5.0% vac · 8.0% maint · 8.0% mgmt
Financing live
Cash to close
- Down payment
- $74,975
- Closing costs
- $8,997
- Reserves months
- —
- Total cash needed
- —
Loan-product check · same deal, 3 products live
Conventional
25% down · 7.5% · 30yr
- Down + closing
- —
- Monthly P&I
- —
- Monthly cashflow
- —
- DSCR
- —
- Eligible?
- —
Personal DTI + credit; lowest rate.
DSCR
20% down · 8.5% · 30yr
- Down + closing
- —
- Monthly P&I
- —
- Monthly cashflow
- —
- DSCR
- —
- Eligible?
- —
No personal income docs; deal must DSCR.
Hard money
10% down · 12.0% · 12mo
- Down + closing
- —
- Monthly P&I
- —
- Monthly cashflow
- —
- DSCR
- —
- Eligible?
- —
Short-term bridge; refi at stabilization.
Rent comps 17 comps
| Address | Beds | Baths | Sqft | Rent | $/sqft | DOM | Units | Dist |
|---|---|---|---|---|---|---|---|---|
| 2313 Becard Dr Mesquite, TX | 3.0 | 2.0 | 2193 | $2,600 | $1.19 | 45d | 1 | 0.16mi |
| 2224 Hummingbird Way Mesquite, TX | 4.0 | 2.0 | 1949 | $1,995 | $1.02 | 26d | 1 | 0.20mi |
| 3332 Knollcrest Ln Mesquite, TX | 4.0 | 2.5 | 2700 | $2,610 | $0.97 | 9d | 1 | 0.26mi |
| 2409 Becard Dr Mesquite, TX | 4.0 | 2.5 | 2611 | $2,499 | $0.96 | 45d | 1 | 0.27mi |
| 2817 Island Wren Dr Mesquite, TX | 4.0 | 2.5 | 2638 | $2,750 | $1.04 | 19d | 1 | 0.51mi |
| 2821 Shelduck Dr Mesquite, TX | 4.0 | 2.0 | 1984 | $2,850 | $1.44 | 26d | 1 | 0.53mi |
| 2816 Blue Heron Dr Mesquite, TX | 4.0 | 2.0 | 2065 | $2,500 | $1.21 | 9d | 1 | 0.59mi |
| 3012 Southern Hills Ln Mesquite, TX | 4.0 | 2.0 | 1957 | $2,700 | $1.38 | 45d | 1 | 0.64mi |
| 3013 Timber Ridge Ln Mesquite, TX | 5.0 | 2.5 | 3072 | $3,599 | $1.17 | 5d | 1 | 0.66mi |
| 2124 Amber Spgs Mesquite, TX | 4.0 | 2.5 | 1950 | $3,049 | $1.56 | 14d | 1 | 0.80mi |
| 3216 Southampton Dr Mesquite, TX | 5.0 | 3.5 | 2947 | $3,250 | $1.10 | 45d | 1 | 0.93mi |
| 2329 Bent Brook Dr Mesquite, TX | 5.0 | 3.0 | 3094 | $2,801 | $0.91 | 24d | 1 | 1.26mi |
| 2329 Bent Brook Dr Mesquite, TX | 5.0 | 3.0 | 3094 | $2,575 | $0.83 | 9d | 1 | 1.26mi |
| 2321 Bent Brook Dr Mesquite, TX | 3.0 | 2.0 | 2029 | $2,460 | $1.21 | 9d | 1 | 1.28mi |
| 2314 Stillwater Dr Mesquite, TX | 4.0 | 2.0 | 1995 | $2,600 | $1.30 | 1d | 1 | 1.30mi |
| 2314 Stillwater Dr Mesquite, TX | 4.0 | 2.0 | 1995 | $2,600 | $1.30 | 26d | 1 | 1.30mi |
| 1615 Ariel Dr Mesquite, TX | 4.0 | 2.0 | 2002 | $3,200 | $1.60 | 0d | 1 | 1.41mi |
HOA detail
- Monthly dues
- $29 · $348/yr
- Likely covers
- water
Listing history 30 events
-
2026-06-21days on market $299,900 Active 106 DOM
-
2026-06-18days on market $299,900 Active 103 DOM
-
2026-06-17days on market $299,900 Active 102 DOM
-
2026-06-16days on market $299,900 Active 101 DOM
-
2026-06-15days on market $299,900 Active 100 DOM
-
2026-06-13days on market $299,900 Active 98 DOM
-
2026-06-13days on market $299,900 Active 97 DOM
-
2026-06-09days on market $299,900 Active 94 DOM
-
2026-06-08days on market $299,900 Active 93 DOM
-
2026-06-07days on market $299,900 Active 92 DOM
-
2026-06-04days on market $299,900 Active 89 DOM
-
2026-06-03days on market $299,900 Active 88 DOM
-
2026-06-02days on market $299,900 Active 87 DOM
-
2026-06-01days on market $299,900 Active 86 DOM
-
2026-05-31days on market $299,900 Active 85 DOM
-
2026-05-06price $304,900 316-char remark
Show marketing remark (316 chars)
Beautifully maintained 4 bed, 2.5 bath home with formal dining, study, and gameroom in Falcon’s Lair. Open floor plan with, new flooring, recently replaced water heater and microwave, and updated lighting. HVAC and range replaced in 2019. Covered patio and convenient location near shopping, schools, and I-20.
-
2026-04-17price $309,900 316-char remark
Show marketing remark (316 chars)
Beautifully maintained 4 bed, 2.5 bath home with formal dining, study, and gameroom in Falcon’s Lair. Open floor plan with, new flooring, recently replaced water heater and microwave, and updated lighting. HVAC and range replaced in 2019. Covered patio and convenient location near shopping, schools, and I-20.
-
2026-04-09price $319,900 316-char remark
Show marketing remark (316 chars)
Beautifully maintained 4 bed, 2.5 bath home with formal dining, study, and gameroom in Falcon’s Lair. Open floor plan with, new flooring, recently replaced water heater and microwave, and updated lighting. HVAC and range replaced in 2019. Covered patio and convenient location near shopping, schools, and I-20.
-
2026-03-07$329,900 Active 316-char remark
Show marketing remark (316 chars)
Beautifully maintained 4 bed, 2.5 bath home with formal dining, study, and gameroom in Falcon’s Lair. Open floor plan with, new flooring, recently replaced water heater and microwave, and updated lighting. HVAC and range replaced in 2019. Covered patio and convenient location near shopping, schools, and I-20.
-
2023-07-21status Active
-
2023-07-18status Pending
-
2023-07-06historical Active Contingent
-
2023-06-23price $345,000
-
2023-06-16$369,000 Active
-
2022-08-05$379,000 Active
-
2021-09-14soldstatus
-
2021-09-02soldstatus Sold
-
2021-07-25status Pending
-
2021-07-21historical Active Option Contract
-
2021-07-14$299,900 Active
ⓘ Source: listings_history table (triggers on properties + properties_extension) + one-shot
backfill from property_details.listing_events for pre-trigger history.
Tax reassessment forecast TX · Resets to sale price
- Current annual tax
- $7,866 · $656/mo
- Projected year-2 tax
- $7,866 · $656/mo
- Expected delta
- $0/yr ($0/mo · -0.0%)
ⓘ Screening estimate from a state-policy table — verify with the county assessor before closing.
Climate risk First Street
- Flood 1/10 Low FEMA zone X (unshaded) · 0% chance over 30 yrs
- Wildfire 3/10 Moderate
- Heat 8/10 Severe 7 d/yr ≥110°F today · 25 d/yr by 30 yrs out
- Wind 6/10 Major 27% chance of damaging wind over 30 yrs
- Air quality 2/10 Low 1 unhealthy d/yr today · 1 by 30 yrs out
Nearby sold comps map
Loading sold comps map…
Walkable amenities ~0.75 mi
Loading nearby amenities…
Taxation est. · year 1
- Rental income
- $34,946
- − Mortgage interest
- −$16,799
- − Property taxes
- −$7,866
- − Insurance
- −$1,500
- − Repairs & maintenance
- −$2,796
- − Management
- −$2,796
- − HOA
- −$348
- − Depreciation
- −$8,724
- Taxable loss
- −$5,883
- Est. tax savings @ 24.0%
- +$1,412
- After-tax cash flow
- $433/yr
For passive investors: Depreciation is non-cash, so a rental often shows a tax loss while cash-flowing — sheltering income. Rental losses are passive: they offset passive income freely, and up to $25,000/yr can offset ordinary (W-2) income if you actively participate and your MAGI is under $100k (phasing out to $0 by $150k); unused losses carry forward. On sale, claimed depreciation is recaptured at up to 25%, and gains may owe capital-gains tax (a 1031 exchange can defer both). Figures are a year-1 estimate at your 24.0% rate — not tax advice; consult a CPA.
Schools (NCES district)
- District
- Mesquite ISD
- NCES district ID
- 4830390
- Math proficiency
- 35% ▼ -11.00%
- Reading proficiency
- 32% ▼ -7.00%
- Median HH income
- $49,372
- Composite
- 29.06/100
- National rank
- #6606
- State rank
- #536 of 826 in TX
Livability — Mesquite
- Score
- 70/100
- State rank
- #358
- US rank
- #7743
Category grades
Schools grade is shown separately in the Schools card above.
Census & demographics
- Census place
- Mesquite, TX
- County
- Dallas County · 2,612,404 people
- City population
- 150,788
- Metro
- Dallas-Fort Worth-Arlington, TX
- Population (ZIP)
- 29,788
- Household income
- $111,052
- Rent vs Own
- Severe rent burden
- 857.0
Population outlook (Dallas County) Hauer SSP2
- Today (2025)
- 2,979,839 people
- By 2030
- 3,191,823 · +7.1%
- By 2040
- 3,619,611 · +21.5%
- By 2050
- 4,026,915 · +35.1%
- By 2075
- 4,957,073 · +66.4%
- By 2100
- 5,508,725 · +84.9%
Race, ethnicity, and origin ACS 2023
- Neighborhood character
- Highly diverse neighborhood (Simpson 0.71)
- Race & ethnicity
- Black 39% Hispanic / Latino 32% Two or more races 21% White 16% Asian 5% Native American 1%
- Hispanic origin (detail)
- Mexican 27% Puerto Rican 1%
- Common ancestry
- Slovak 2% Italian 1%
- Foreign-born
- 22% · Canada, Vietnam
- Languages at home
- 64% English-only · Spanish 27% Tagalog/Filipino 3% Other Asian/Pacific 1%
Political lean MEDSL · Dallas
- 2024 margin
- Strong D (+22.2) · D 60.2% · R 38.0% · Other 1.8%
- 2008→2024 swing
- +6.9pp toward D · 2008: 15.3pp · 2024: 22.2pp
- All cycles
- 2024: D+22.2 2020: D+31.6 2016: D+26.2 2012: D+15.4 2008: D+15.3
Not yet ingested
- Civics
- —
Market trends
- HPI YoY
- ▼ -26.63%
- Current HPI
- 257.0959
- Rent YoY
- ▲ 0.07%
- Metro
- Dallas-Fort Worth-Arlington, TX
- State GDP YoY
- ▲ 3.95%
- F500 in state
- 110
Industry mix (Fortune 500 HQ in TX)
| Industry | F500 HQs | Revenue |
|---|---|---|
| Energy | 16 | $1,198B |
|
||
| Technology | 5 | $198B |
|
||
| Engineering / Construction | 4 | $72B |
|
||
| Energy Services | 3 | $60B |
|
||
| Utilities | 3 | $41B |
|
||
| Healthcare | 2 | $330B |
|
||
Price history
+1.7% since first listed15 events — show timeline
- 2026-05-06 Price Changed $304,900 NTREIS
- 2026-04-17 Price Changed $309,900 NTREIS
- 2026-04-09 Price Changed $319,900 NTREIS
- 2026-03-07 Listed $329,900 NTREIS
- 2023-07-21 Relisted — NTREIS
- 2023-07-18 Pending — NTREIS
- 2023-07-06 Contingent — NTREIS
- 2023-06-23 Price Changed $345,000 NTREIS
- 2023-06-16 Listed $369,000 NTREIS
- 2022-08-05 Listed $379,000 NTREIS
- 2021-09-14 Sold (Public Records) — Public Records
- 2021-09-02 Sold (MLS) — NTREIS
- 2021-07-25 Pending — NTREIS
- 2021-07-21 Contingent — NTREIS
- 2021-07-14 Listed $299,900 NTREIS
Property tax history
+4.1%/yrLatest (2025): $7,866 · -0.3% YoY. Source: county tax records.
Cash-flow waterfall
monthlySold comps — $/sqft
last 12 mo · ≤1 miLoading sold comps…