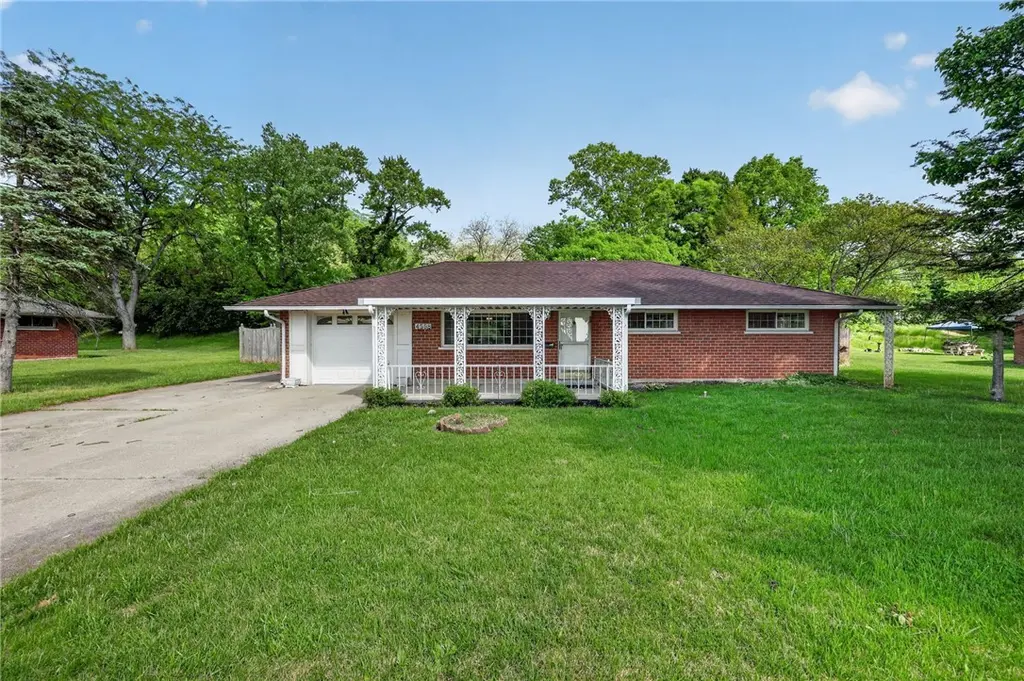
4558 Cordell Dr · Kettering, OH
Flood risk 4/10 · Minor
- FEMA flood zone
- X (unshaded)
- Chance of flooding over 30 yrs
- 0.21%
- Est. flood insurance / yr
- $507 – $1,088
Fire risk 1/10 · Minimal
- Est. fire insurance / yr
- $713 – $1,323
Heat risk 4/10 · Minor
- Hot days now (above 101°F)
- 7 days/yr
- Hot days in 30 yrs
- 19 days/yr
Wind risk 2/10 · Minimal
- Chance of severe wind over 30 yrs
- 0.0%
Air-quality risk 3/10 · Minor
- Unhealthy air days now
- 3 days/yr
- Unhealthy air days in 30 yrs
- 5 days/yr
Risk factors via First Street. Map © Google.
Why this score? — see what drove the D grade
The composite is a weighted blend of 9 inputs, each scored 0–100. Each bar is that input's sub-score; the figure is the points it added to the 100-point composite (weight × sub-score).
- ARV discount +13.6/15.0
- Cash flow +9.9/30.0
- Livability +4.2/5.0
- 1% rule +3.9/10.0
- Schools +3.4/10.0
- DSCR +2.8/10.0
- Rent growth +2.5/5.0
- Condition / age +2.5/5.0
- Appreciation +0.0/10.0
$164,900
🖨 Deal sheet (PDF) 📄 Offer letter ✓ Due diligence
Listing remarks
Welcome to this charming all-brick ranch, a true standout nestled on a generous 0.35-acre corner lot in the heart of Miami Township. Built in 1956, this classic Huber-style home offers the perfect blend of mid-century character and practical living, boasting a low-maintenance exterior and a spacious yard rarely found in the neighborhood. Inside, you’ll find a cozy and efficient 1,080 square foot layout featuring three comfortable bedrooms and a full bath, all set on a solid concrete slab foundation that ensures easy, stair-free living. 1-car attached garage, providing ample space for vehicles and hobbies—a premium find for this area. Situated within the West Carrollton City Scho
Key facts
- Spacious yard
- Double lot
- Corner lot
Tags
Property features AI
Finance
- Financial info: Offered for sale
Exterior
- Parking: Attached one-car garage
- Home design: One-story house
- Construction: Brick construction
- Exterior features: Residential zoning; Lot dimensions approximately 140 x 110
Interior
- Kitchen: Range
- Bedrooms: Main level bedroom (9 x 9); Main level bedroom (13 x 9)
- Bathrooms: 1 full bathroom on the main level
- Heating & cooling: Forced air heating; Central air conditioning
- Interior features: Crawl space basement; 6 total rooms
Neighborhood map
What this means for you Summary
Snapshot
- This is a 3-bed/1.0-bath single-family listed at $165k.
Deal economics
- At list price, monthly cash flow is $-104 ($-1k/yr) — negative.
- To cash-flow at today's rent, offer at most $147k (11.1% below list).
- To meet the 1% rule (rent ≥ 1% of price), the offer needs to be $147k (11.1% below list).
- Recommended offer: $147k (11.1% below list) — sets the bar for cash-flow.
- Cap rate 5.5% vs local median 4.4% in Kettering — meaningfully above typical; check what's discounted (condition, days-on-market, listing class) to confirm the premium yield is real.
Location & tenants
- Location reads 83/100 on livability (#61 in OH, #922 nationally) — a professional / high-income tenant draw. Strengths: crime A+, cost of living A+, housing A+; Watch: commute F.
- West Carrollton City (suburban): math 34% / reading 46% proficiency, ranked #540 of 656 in OH (top 82%) — families likely to look elsewhere, expect single-tenant / working-renter base with shorter leases.
- Zoned schools: West Carrollton Early Childhood Center (656 students, 45% FRL); West Carrollton Middle School (math 27% / reading 43%, grade F, #546 of 654 statewide, top 83%, 508 students, 62% FRL); West Carrollton High School (math 17% / reading 57%, grade F, #564 of 781 statewide, top 74%, 951 students, 55% FRL) — zoned schools at 54% FRL track the district average.
- Market conditions: 38 active listings in the ZIP; 15 comparable units currently listed for rent nearby; rentals at typical pace (median 22d on market — plan ~3-4 weeks tenant-placement turnaround); 907 units permitted in Montgomery County in 2024 (416 in 5+ unit buildings).
- This rent runs 34% of the median local income ($52k/yr) — at the standard rent-burdened threshold; future hikes will face affordability resistance.
Forward outlook
- Local home prices are declining (-3.0%/yr); year-one equity from $1k of loan paydown is wiped out by about $5k of value loss. Plan a longer hold.
- Montgomery County population projected at -10% by 2050 — secular population decline; favor cash flow + early exit over multi-decade hold.
Negotiation context
- It's been on market 29 days — a 2% lower offer ($162k) is reasonable based on typical stale-listing flexibility.
- 2 sale attempts with the ask held roughly flat each time — persistent listings suggest the price (not the market) is what's stuck; bring a comps-based counter.
Risks & watch-outs
- Watch-outs: built in 1956 — expect roof / HVAC / electrical / plumbing capex.
Questions for the listing agent
- What do current leases actually rent for vs. the listed asking? Can we see a recent rent roll and the last 12 months of T-12 income?
- Built in 1956 — when were the roof, HVAC, electrical panel, plumbing, and water heater last replaced?
- Is there a deadline driving the sale (1031 exchange, divorce, estate, relocation)? That informs how much negotiation room exists.
- Schools are A-rated — typically a magnet for longer-tenancy family renters. What's the average tenant stay here, and is there a school-zone premium baked into asking?
- The area grade is low — what's the realistic commute time and amenity access for the typical tenant pool here? Any planned neighborhood developments (good or bad) we should know about?
- What's the average days-on-market for RENTAL listings here right now (not sales)? A rising rental-DOM trend means longer vacancies and softer asking-rent achievability than the comps imply.
- What's the recent tenant-quality profile in this submarket — average credit score on applications, eviction rate, late-payment / NSF rate, and stable-employment percentage? A property-management company in the area should have these aggregated.
- How much new for-sale + rental construction is in the pipeline within 1–3 miles? Heavy new supply typically softens prices + rents 12–24 months out; constrained supply supports both.
Investment metrics
- 1% rule
- 0.89% ✗
- Cap rate
- 5.54%
- Cash-on-cash
- -2.70%
- DSCR
- 0.88
- GRM
- 9.4
CMA / ARV
- ARV (median comp)
- $190,993
- List price
- $164,900
- Delta
- -13.66%
- Verdict
- UNDERPRICED
- Comps
- 20 within 1.0 mi
Show comp detail 12 sales within ~0.75 mi
| Address | Dist | Beds/Ba | Sqft | Sold | Price | $/sf | Match |
|---|---|---|---|---|---|---|---|
| 2190 Renshaw Ave | 0.07mi | 3/1.0 | 1,080 (0%) | 1mo | $194,080 | $180 | 96 |
| 4476 Hannaford St | 0.21mi | 3/1.0 | 1,080 (0%) | 1mo | $190,000 | $176 | 89 |
| 2169 Finland Dr | 0.28mi | 3/1.0 | 1,080 (0%) | 1mo | $213,000 | $197 | 86 |
| 2218 Finland Dr | 0.27mi | 3/1.0 | 1,080 (0%) | 2mo | $189,000 | $175 | 86 |
| 2087 Lehigh Pl | 0.29mi | 3/1.0 | 1,080 (0%) | 2mo | $182,500 | $169 | 85 |
| 4792 Loxley Dr | 0.28mi | 3/1.0 | 1,080 (0%) | 3mo | $180,000 | $167 | 85 |
| 4518 Harbison St | 0.24mi | 3/2.0 | 1,080 (0%) | 2mo | $233,000 | $216 | 83 |
| 2701 Jomar Ave | 0.56mi | 3/1.0 | 1,080 (0%) | 1mo | $225,000 | $208 | 73 |
| 1681 Hillwood Dr | 0.62mi | 3/1.0 | 1,040 (-4%) | 2mo | $205,000 | $197 | 63 |
| 3913 Elmira Dr | 0.66mi | 3/1.0 | 1,040 (-4%) | 2mo | $212,900 | $205 | 61 |
| 3890 Endover Rd | 0.68mi | 3/1.0 | 1,040 (-4%) | 2mo | $180,000 | $173 | 61 |
| 2501 Genoa Ave | 0.68mi | 2/1.0 (-1) | 993 (-8%) | 2mo | $130,000 | $131 | 48 |
Match score weights: distance 35% · size 25% · config 20% · recency 20%. Top-matched comps best support the ARV.
Projected returns pro-forma
-3.0% appreciation · 3.0% rent growth · sell at horizon
- IRR
- -20.7%
- Equity multiple
- 0.28×
- Total profit
- $-33,249
- Equity at exit
- $24,587
- IRR
- -13.8%
- Equity multiple
- 0.20×
- Total profit
- $-37,090
- Equity at exit
- $14,258
Cash invested: $46,172 (down + closing). Projections, not guarantees.
Landlord ↔ Tenant lean methodology
- Overall (STATE)
- 73 Landlord-Friendly
- State Ohio
- 73 Landlord-Friendly · R+6
- County
- — inherits STATE
- City
- — inherits STATE
ZIP-level market 45439
- Home prices YoY
- -34.5%
- Active inventory
- 38
- Price-to-rent
- 9.4×
Monthly cashflow live
- Estimated rent
- $1,465 high interval (Pro) →
- Mortgage (P&I)
- −$865
- Tax from tax record
- −$328 /mo · $3,939/yr
- Insurance
- −$69
- HOA
- −$0
- Lot rent
- −$0
- Vacancy / Maint / Mgmt
- −$308
- Net cashflow
- $-104
Break-even live
Sensitivity live
| Price | -10% $-11 | -5% $-57 | +0% $-104 | +5% $-151 | +10% $-197 |
|---|---|---|---|---|---|
| Rent | -10% $-220 | -5% $-162 | +0% $-104 | +5% $-46 | +10% $12 |
| Rate | -1.0pp $-21 | -0.5pp $-62 | base $-104 | +0.5pp $-147 | +1.0pp $-190 |
UW: 25.0% down · 7.5% · 30yr · 1.5% tax · 5.0% vac · 8.0% maint · 8.0% mgmt
Financing live
Cash to close
- Down payment
- $41,225
- Closing costs
- $4,947
- Reserves months
- —
- Total cash needed
- —
Loan-product check · same deal, 3 products live
Conventional
25% down · 7.5% · 30yr
- Down + closing
- —
- Monthly P&I
- —
- Monthly cashflow
- —
- DSCR
- —
- Eligible?
- —
Personal DTI + credit; lowest rate.
DSCR
20% down · 8.5% · 30yr
- Down + closing
- —
- Monthly P&I
- —
- Monthly cashflow
- —
- DSCR
- —
- Eligible?
- —
No personal income docs; deal must DSCR.
Hard money
10% down · 12.0% · 12mo
- Down + closing
- —
- Monthly P&I
- —
- Monthly cashflow
- —
- DSCR
- —
- Eligible?
- —
Short-term bridge; refi at stabilization.
Rent comps 15 comps
| Address | Beds | Baths | Sqft | Rent | $/sqft | DOM | Units | Dist |
|---|---|---|---|---|---|---|---|---|
| 2621 Nyack Ln Dayton, OH | 3.0 | 1.0 | 1080 | $1,500 | $1.39 | 16d | 1 | 0.49mi |
| 3928 Elmira Dr Dayton, OH | 3.0 | 1.0 | 1041 | $1,550 | $1.49 | 5d | 1 | 0.63mi |
| 4042 Ellery Ave Moraine, OH | 3.0 | 1.0 | 720 | $1,195 | $1.66 | 46d | 1 | 0.67mi |
| 1643 Archdeacon Ct Dayton, OH | 2.0 | 1.0 | 1040 | $1,450 | $1.39 | 23d | 1 | 0.71mi |
| 4217 Fulton Ave Moraine, OH | 2.0 | 1.0 | 800 | $1,325 | $1.66 | 46d | 1 | 0.75mi |
| 5237 Belle Isle Dr Unit 5237 Dayton, OH | 2.0 | 1.0 | 960 | $1,025 | $1.07 | 46d | 1 | 0.77mi |
| 3781 Keswick Ln Dayton, OH | 3.0 | 1.0 | 1040 | $1,750 | $1.68 | 5d | 1 | 0.77mi |
| 3924 Fulton Ave Moraine, OH | 3.0 | 1.0 | 813 | $1,800 | $2.21 | 5d | 1 | 0.77mi |
| 3929 Fulton Ave Moraine, OH | 2.0 | 1.0 | 788 | $750 | $0.95 | 21d | 1 | 0.80mi |
| 5295 Belle Isle Dr Dayton, OH | 2.0 | 1.5 | 856 | $950 | $1.11 | 46d | 1 | 0.81mi |
| 5359 Dunmore Dr Dayton, OH | 2.0 | 1.0 | 808 | $975 | $1.21 | 16d | 1 | 0.85mi |
| 3657 Elmira Dr Dayton, OH | 2.0 | 1.0 | 936 | $1,450 | $1.55 | 46d | 1 | 0.88mi |
| 5480 Dovetree Blvd Moraine, OH | 1.0–2.0 | 1.0–2.0 | 826 | $1,645 | $1.99 | 5d | 15 | 0.96mi |
| 2125 W Alex Bell Rd Dayton, OH | 2.0 | 1.0 | 1100 | $1,975 | $1.80 | 5d | 1 | 1.01mi |
| 3401 Southdale Dr #5 Dayton, OH | 2.0 | 2.0 | 1400 | $1,450 | $1.04 | 23d | 1 | 1.17mi |
Listing history 13 events
-
2026-06-07statusdays on market $164,900 Pending 29 DOM
-
2026-06-03days on market $164,900 Active 28 DOM
-
2026-06-02days on market $164,900 Active 27 DOM
-
2026-06-01days on market $164,900 Active 26 DOM
-
2026-05-31days on market $164,900 Active 25 DOM
-
2026-05-31days on market $164,900 Active 24 DOM
-
2026-05-12historical ActiveUnderContract 1039-char remark
-
2026-05-06$164,900 Active 1039-char remark
-
2024-10-18soldstatus $9,179,000
-
2021-05-13soldstatus $4,300,000
-
2009-01-09soldstatus $69,750
-
2003-03-21soldstatus $97,900
-
1986-10-03soldstatus $52,500
ⓘ Source: listings_history table (triggers on properties + properties_extension) + one-shot
backfill from property_details.listing_events for pre-trigger history.
Tax reassessment forecast OH · Partial reset (capped growth)
- Current annual tax
- $3,939 · $328/mo
- Projected year-2 tax
- $3,939 · $328/mo
- Expected delta
- $0/yr ($0/mo · 0.0%)
ⓘ Screening estimate from a state-policy table — verify with the county assessor before closing.
Climate risk First Street
- Flood 4/10 Moderate FEMA zone X (unshaded) · 21% chance over 30 yrs
- Wildfire 1/10 Low
- Heat 4/10 Moderate 7 d/yr ≥101°F today · 19 d/yr by 30 yrs out
- Wind 2/10 Low 0% chance of damaging wind over 30 yrs
- Air quality 3/10 Moderate 3 unhealthy d/yr today · 5 by 30 yrs out
Nearby sold comps map
Loading sold comps map…
Walkable amenities ~0.75 mi
Loading nearby amenities…
Taxation est. · year 1
- Rental income
- $17,585
- − Mortgage interest
- −$9,237
- − Property taxes
- −$3,939
- − Insurance
- −$824
- − Repairs & maintenance
- −$1,407
- − Management
- −$1,407
- − Depreciation
- −$4,797
- Taxable loss
- −$4,026
- Est. tax savings @ 24.0%
- +$966
- After-tax cash flow
- $-282/yr
For passive investors: Depreciation is non-cash, so a rental often shows a tax loss while cash-flowing — sheltering income. Rental losses are passive: they offset passive income freely, and up to $25,000/yr can offset ordinary (W-2) income if you actively participate and your MAGI is under $100k (phasing out to $0 by $150k); unused losses carry forward. On sale, claimed depreciation is recaptured at up to 25%, and gains may owe capital-gains tax (a 1031 exchange can defer both). Figures are a year-1 estimate at your 24.0% rate — not tax advice; consult a CPA.
Schools (NCES district)
- District
- West Carrollton City
- NCES district ID
- 3904505
- Math proficiency
- 34% ▼ -12.00%
- Reading proficiency
- 46% ▼ -9.00%
- Median HH income
- $42,209
- Composite
- 33.71/100
- National rank
- #5380
- State rank
- #540 of 656 in OH
Livability — Kettering
- Score
- 83/100
- State rank
- #61
- US rank
- #922
Category grades
Schools grade is shown separately in the Schools card above.
Census & demographics
- County
- Montgomery County · 459,541 people
- City population
- 73,116
- Metro
- Dayton-Kettering, OH
- Population (ZIP)
- 11,914
- Household income
- $52,035
- Rent vs Own
- Severe rent burden
- 381.0
Population outlook (Montgomery County) Hauer SSP2
- Today (2025)
- 523,241 people
- By 2030
- 514,948 · -1.6%
- By 2040
- 493,378 · -5.7%
- By 2050
- 469,639 · -10.2%
- By 2075
- 418,360 · -20.0%
- By 2100
- 353,315 · -32.5%
Race, ethnicity, and origin ACS 2023
- Neighborhood character
- Predominantly White (71%)
- Race & ethnicity
- White 71% Black 15% Two or more races 10% Hispanic / Latino 9% Asian 2%
- Hispanic origin (detail)
- Mexican 3% Puerto Rican 1%
- Common ancestry
- Italian 2% Iranian 1% Slovak 1%
- Foreign-born
- 4% · Canada, China, Vietnam
- Languages at home
- 93% English-only · Spanish 5% Chinese 1%
Political lean MEDSL · Montgomery
- 2024 margin
- Toss-up / Even · D 49.8% · R 49.3%
- 2008→2024 swing
- -5.8pp toward R · 2008: 6.2pp · 2024: 0.5pp
- All cycles
- 2024: D+0.5 2020: D+2.2 2016: R+1.2 2012: D+3.1 2008: D+6.2
Not yet ingested
- Civics
- —
Market trends
- HPI YoY
- ▼ -151.06%
- Current HPI
- 287.2064
- Rent YoY
- —
- Metro
- Dayton-Kettering, OH
- State GDP YoY
- ▲ 1.98%
- F500 in state
- 48
Industry mix (Fortune 500 HQ in OH)
| Industry | F500 HQs | Revenue |
|---|---|---|
| Insurance | 3 | $145B |
|
||
| Industrial Machinery | 3 | $49B |
|
||
| Financial Services | 3 | $24B |
|
||
| Consumer Goods | 2 | $93B |
|
||
| Aerospace / Defense | 2 | $47B |
|
||
| Utilities | 2 | $33B |
|
||
Price history
+214.1% since first listed9 events — show timeline
- 2026-06-04 Pending — Dayton MLS
- 2026-05-27 Relisted — Dayton MLS
- 2026-05-12 Contingent — Dayton MLS
- 2026-05-06 Listed $164,900 Dayton MLS
- 2024-10-18 Sold (Public Records) $9,179,000 Public Records
- 2021-05-13 Sold (Public Records) $4,300,000 Public Records
- 2009-01-09 Sold (Public Records) $69,750 Public Records
- 2003-03-21 Sold (Public Records) $97,900 Public Records
- 1986-10-03 Sold (Public Records) $52,500 Public Records
Property tax history
+5.1%/yrLatest (2025): $3,939 · -0.1% YoY. Source: county tax records.
Cash-flow waterfall
monthlySold comps — $/sqft
last 12 mo · ≤1 miLoading sold comps…