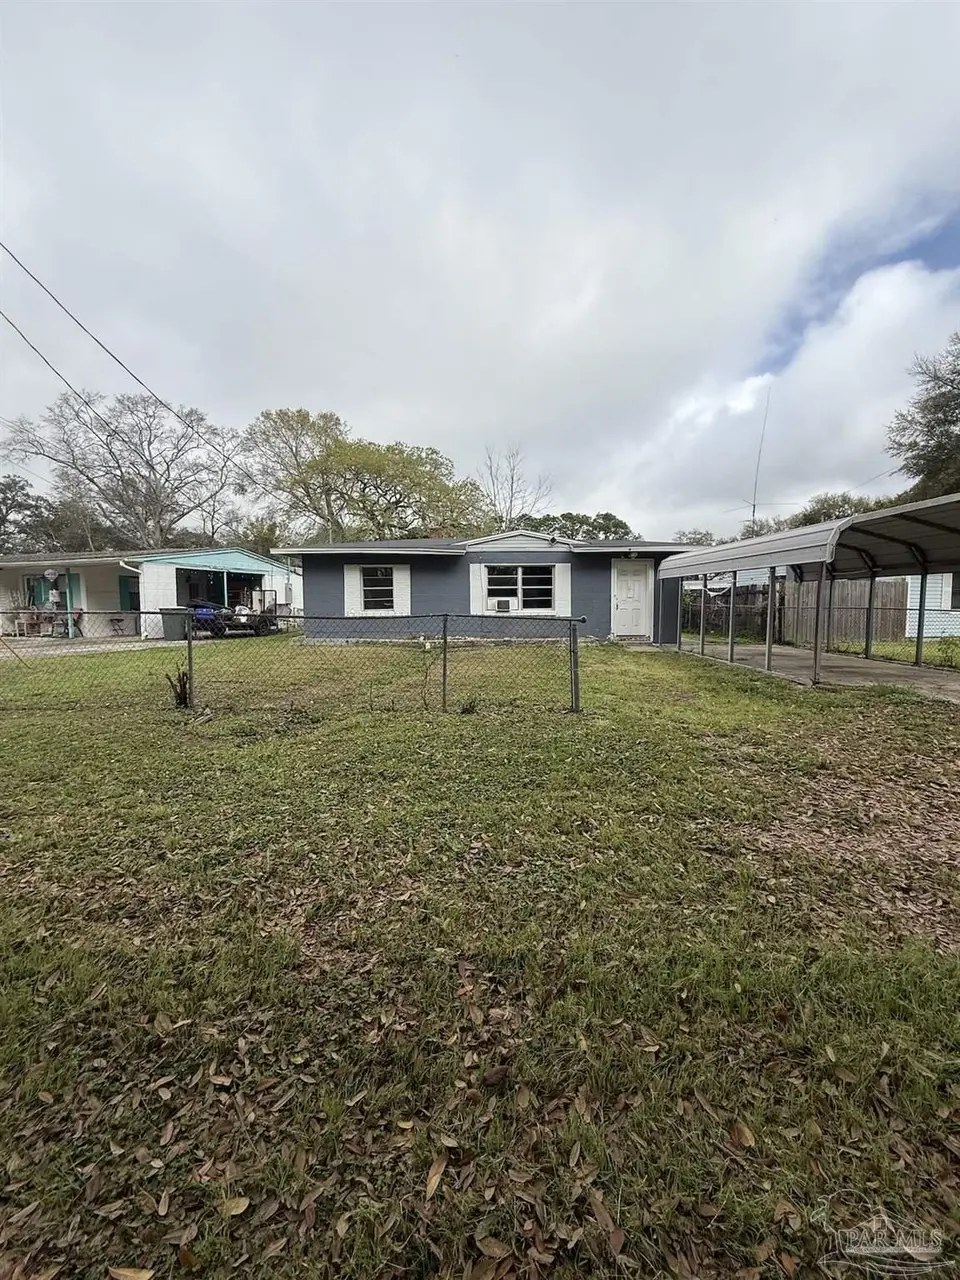
34 Randolph Dr · West Pensacola, FL
Flood risk 1/10 · Minimal
- FEMA flood zone
- X (unshaded)
- Chance of flooding over 30 yrs
- 0.0%
- Est. flood insurance / yr
- $507 – $1,088
Fire risk 2/10 · Minimal
- Est. fire insurance / yr
- $947 – $1,759
Heat risk 10/10 · Severe
- Hot days now (above 105°F)
- 7 days/yr
- Hot days in 30 yrs
- 22 days/yr
Wind risk 9/10 · Severe
- Chance of severe wind over 30 yrs
- 99.0%
Air-quality risk 1/10 · Minimal
- Unhealthy air days now
- 0 days/yr
- Unhealthy air days in 30 yrs
- 0 days/yr
Risk factors via First Street. Map © Google.
Why this score? — see what drove the D grade
The composite is a weighted blend of 9 inputs, each scored 0–100. Each bar is that input's sub-score; the figure is the points it added to the 100-point composite (weight × sub-score).
- Cash flow +18.8/30.0
- DSCR +5.9/10.0
- 1% rule +4.4/10.0
- Schools +3.6/10.0
- Rent growth +3.5/5.0
- Livability +3.3/5.0
- Condition / age +2.5/5.0
- ARV discount +1.3/15.0
- Appreciation +0.0/10.0
$170,000
🖨 Deal sheet (PDF) 📄 Offer letter ✓ Due diligence
Listing remarks
Investment opportunity or a home to call your own? Look no further! This 3 bed/ 2 bath home is waiting for your own personal touches to make it your own. From your own personal laundry room to an extra bonus area in the house that you could make into an extra family room or living room area, the possibilities are endless. I can go on and on with more details about this property, but this is one you must truly see to believe. Schedule your appointment today, before this one slips away! * Buyer to verify school, tax, gross living area and room dimensions *
Key facts
- Extra bonus area
- 6,098 sq ft lot
- Parking
Tags
Property features AI
Finance
- HOA & community: No association
Exterior
- Parking: Carport (covered) with 1 total parking space
- Utilities: Public water; Public sewer; Electric with circuit breakers
- Home design: Single-story frame home; Resale property; Not attached to another property; Slab foundation
- Construction: Frame construction; Slab foundation; One level
- Exterior features: Composition roof; Paved, county-maintained public road
Interior
- Kitchen: Electric water heater
- Bedrooms: Primary bedroom on the first floor (approximately 12 x 12)
- Flooring: Laminate
- Bathrooms: 2 full bathrooms
- Heating & cooling: Central heating; Central air; Ceiling fan(s)
- Interior features: Living/dining combo; Laminate flooring
Neighborhood map
What this means for you Summary
Snapshot
- This is a 3-bed/1.0-bath single-family listed at $170k.
Deal economics
- At list price, monthly cash flow is $170 ($2k/yr) — positive.
- The deal already cash-flows at list — no discount required.
- To meet the 1% rule (rent ≥ 1% of price), the offer needs to be $160k (5.8% below list).
- Recommended offer: $160k (5.8% below list) — sets the bar for 1% rule.
Location & tenants
- Location reads 66/100 on livability (#629 in FL) — a middle-class / working-renter tenant base. Strengths: cost of living A+, housing A+, health & safety B+; Watch: crime D, amenities F, commute F.
- Escambia (suburban): math 40% / reading 45% proficiency, ranked #56 of 73 in FL (top 77%) — families likely to look elsewhere, expect single-tenant / working-renter base with shorter leases.
- Zoned schools: West Pensacola Elementary School (math 38% / reading 42%, grade F, #1,491 of 2,144 statewide, top 70%, 459 students, 85% FRL); Warrington Middle School (math 19% / reading 24%, grade F, #553 of 571 statewide, top 97%, 573 students, 87% FRL); Escambia High School (math 19% / reading 29%, grade F, #529 of 667 statewide, top 80%, 1,655 students, 62% FRL) — zoned schools average 78% FRL vs 58% district-wide (20 pts higher); higher-poverty schools than district average — tighter screening recommended.
- Zoned-school proficiency averages 28% at this address vs 42% district-wide (-14 pts) — the specific schools serving this property underperform the Escambia average; the district grade overstates school quality for this exact location.
- Market conditions: Rents rising (+3.9%/yr); 267 active listings in the ZIP; 15 comparable units currently listed for rent nearby; rentals at typical pace (median 25d on market — plan ~3-4 weeks tenant-placement turnaround); 1,479 units permitted in Escambia County in 2024 (0 in 5+ unit buildings).
- This rent runs 31% of the median local income ($62k/yr) — at the standard rent-burdened threshold; future hikes will face affordability resistance.
Forward outlook
- Local home prices are declining (-3.0%/yr); year-one equity from $1k of loan paydown is wiped out by about $5k of value loss. Plan a longer hold.
- Escambia County population projected at +13% by 2050 — modest demand growth; plan on rents tracking national, not racing it.
Negotiation context
- It's been on market 60 days — a 3% lower offer ($165k) is reasonable based on typical stale-listing flexibility.
- 2 sale attempts since 2y ago with the ask held roughly flat each time — persistent listings suggest the price (not the market) is what's stuck; bring a comps-based counter.
- Current owner paid $34k; list at $170k implies a 403% gain — meaningful room to come down on a strong offer.
Risks & watch-outs
- Watch-outs: built in 1953 — expect roof / HVAC / electrical / plumbing capex.
- Climate carrying-cost: severe wind risk, 99% chance of damaging wind over 30y; extreme-heat days projected 7→22/yr by 2055 (HVAC capex compounding) — expect insurance premiums to compound above CPI over the hold.
Questions for the listing agent
- It's been on market 60 days. Have you received any prior offers? Is the seller open to a 6% concession, seller financing, or rate buy-down credit?
- Built in 1953 — when were the roof, HVAC, electrical panel, plumbing, and water heater last replaced?
- Is there a deadline driving the sale (1031 exchange, divorce, estate, relocation)? That informs how much negotiation room exists.
- Schools are F-rated, which usually means shorter tenancies and higher turnover. Who's the typical renter profile here, and what's been the actual vacancy rate?
- Crime grade is D in this area — have there been break-ins, vandalism, or insurance claims at this property in the last 3 years? What carrier currently insures it and at what premium?
- The area grade is low — what's the realistic commute time and amenity access for the typical tenant pool here? Any planned neighborhood developments (good or bad) we should know about?
- What's the average days-on-market for RENTAL listings here right now (not sales)? A rising rental-DOM trend means longer vacancies and softer asking-rent achievability than the comps imply.
- What's the recent tenant-quality profile in this submarket — average credit score on applications, eviction rate, late-payment / NSF rate, and stable-employment percentage? A property-management company in the area should have these aggregated.
- How much new for-sale + rental construction is in the pipeline within 1–3 miles? Heavy new supply typically softens prices + rents 12–24 months out; constrained supply supports both.
Investment metrics
- 1% rule
- 0.94% ✗
- Cap rate
- 7.50%
- Cash-on-cash
- 4.30%
- DSCR
- 1.19
- GRM
- 8.8
CMA / ARV
- ARV (median comp)
- $149,363
- List price
- $170,000
- Delta
- 13.82%
- Verdict
- OVERPRICED
- Comps
- 20 within 1.0 mi
Show comp detail 12 sales within ~0.75 mi
| Address | Dist | Beds/Ba | Sqft | Sold | Price | $/sf | Match |
|---|---|---|---|---|---|---|---|
| 35 Randolph Dr | 0.03mi | 4/2.0 (+1) | 1,182 (-5%) | 2mo | $167,900 | $142 | 79 |
| 4915 Tulip Dr | 0.47mi | 3/2.0 | 1,229 (-2%) | 1mo | $186,500 | $152 | 70 |
| 18 Besma Dr | 0.18mi | 4/1.0 (+1) | 1,342 (+7%) | 5mo | $95,000 | $71 | 70 |
| 1416 N 48th Ave | 0.26mi | 3/2.0 | 1,123 (-10%) | 1mo | $159,000 | $142 | 66 |
| 4519 Martha Ave | 0.40mi | 3/1.0 | 1,176 (-6%) | 8mo | $187,000 | $159 | 65 |
| 10 Tennessee Dr | 0.55mi | 3/2.0 | 1,318 (+5%) | 1mo | $260,000 | $197 | 60 |
| 1308 N 48th Ave | 0.28mi | 3/1.0 | 1,111 (-11%) | 11mo | $110,000 | $99 | 59 |
| 6 Georgia Dr | 0.59mi | 4/2.0 (+1) | 1,206 (-4%) | 3mo | $157,000 | $130 | 55 |
| 4953 Martha Ave | 0.55mi | 3/2.0 | 1,120 (-10%) | 4mo | $220,000 | $196 | 50 |
| 110 Tomahawk Trl | 0.50mi | 3/2.0 | 1,376 (+10%) | 8mo | $151,000 | $110 | 49 |
| 1106 N 50th Ave | 0.58mi | 3/2.0 | 1,086 (-13%) | 5mo | $190,000 | $175 | 43 |
| 4905 State St | 0.59mi | 3/1.0 | 1,074 (-14%) | 11mo | $185,000 | $172 | 40 |
Match score weights: distance 35% · size 25% · config 20% · recency 20%. Top-matched comps best support the ARV.
Projected returns pro-forma
-3.0% appreciation · 3.85% rent growth · sell at horizon
- IRR
- -8.7%
- Equity multiple
- 0.68×
- Total profit
- $-15,339
- Equity at exit
- $25,348
- IRR
- 1.8%
- Equity multiple
- 1.13×
- Total profit
- $6,281
- Equity at exit
- $14,698
Cash invested: $47,600 (down + closing). Projections, not guarantees.
Landlord ↔ Tenant lean methodology
- Overall (STATE)
- 87 Strongly Landlord-Friendly
- State Florida
- 87 Strongly Landlord-Friendly · R+3
- County
- — inherits STATE
- City
- — inherits STATE
ZIP-level market 32506
- Home prices YoY
- -22.5%
- Rents YoY
- 3.9%
- Active inventory
- 267
- Price-to-rent
- 8.8×
Monthly cashflow live
- Estimated rent
- $1,601 high interval (Pro) →
- Mortgage (P&I)
- −$891
- Tax from tax record
- −$132 /mo · $1,587/yr
- Insurance
- −$71
- HOA
- −$0
- Vacancy / Maint / Mgmt
- −$336
- Net cashflow
- $170
Break-even live
Sensitivity live
| Price | -10% $267 | -5% $219 | +0% $170 | +5% $122 | +10% $74 |
|---|---|---|---|---|---|
| Rent | -10% $44 | -5% $107 | +0% $170 | +5% $234 | +10% $297 |
| Rate | -1.0pp $256 | -0.5pp $214 | base $170 | +0.5pp $126 | +1.0pp $82 |
UW: 25.0% down · 7.5% · 30yr · 1.5% tax · 5.0% vac · 8.0% maint · 8.0% mgmt
Financing live
Cash to close
- Down payment
- $42,500
- Closing costs
- $5,100
- Reserves months
- —
- Total cash needed
- —
Loan-product check · same deal, 3 products live
Conventional
25% down · 7.5% · 30yr
- Down + closing
- —
- Monthly P&I
- —
- Monthly cashflow
- —
- DSCR
- —
- Eligible?
- —
Personal DTI + credit; lowest rate.
DSCR
20% down · 8.5% · 30yr
- Down + closing
- —
- Monthly P&I
- —
- Monthly cashflow
- —
- DSCR
- —
- Eligible?
- —
No personal income docs; deal must DSCR.
Hard money
10% down · 12.0% · 12mo
- Down + closing
- —
- Monthly P&I
- —
- Monthly cashflow
- —
- DSCR
- —
- Eligible?
- —
Short-term bridge; refi at stabilization.
Rent comps 15 comps
| Address | Beds | Baths | Sqft | Rent | $/sqft | DOM | Units | Dist |
|---|---|---|---|---|---|---|---|---|
| 101 Vanderbilt Rd Pensacola, FL | 3.0 | 2.0 | 1104 | $1,850 | $1.68 | 23d | 1 | 0.31mi |
| 4519 Martha Ave Pensacola, FL | 3.0 | 1.0 | 1104 | $1,600 | $1.45 | 25d | 1 | 0.38mi |
| 707 New York Dr Pensacola, FL | 2.0 | 1.0 | 1266 | $1,185 | $0.94 | 25d | 1 | 0.88mi |
| 221 Edison Dr Pensacola, FL | 3.0 | 1.0 | 1500 | $1,598 | $1.07 | 25d | 1 | 0.94mi |
| 852 Garnet St Pensacola, FL | 3.0 | 1.5 | 1150 | $1,150 | $1.00 | 15d | 1 | 1.04mi |
| 3740 Frontera Cir Pensacola, FL | 3.0 | 1.0 | 1024 | $1,295 | $1.26 | 25d | 1 | 1.21mi |
| 5501 Mayfair Dr Pensacola, FL | 3.0 | 1.0 | 912 | $1,295 | $1.42 | 25d | 1 | 1.27mi |
| 4600 Twin Oaks Dr Pensacola, FL | 1.0–2.0 | 1.0 | 838 | $1,499 | $1.79 | 15d | 29 | 1.27mi |
| 3296 Two Sisters Way Pensacola, FL | 4.0 | 2.5 | 1856 | $1,795 | $0.97 | 25d | 1 | 1.31mi |
| 190 N Old Corry Field Rd Pensacola, FL | 1.0–2.0 | 1.0–2.0 | 915 | $1,174 | $1.28 | 15d | 3 | 1.31mi |
| 3216 Two Sisters Way Pensacola, FL | 3.0 | 2.0 | 1117 | $1,700 | $1.52 | 25d | 1 | 1.32mi |
| 316 Teakwood Cir Pensacola, FL | 2.0 | 1.5 | 1024 | $1,350 | $1.32 | 15d | 1 | 1.35mi |
| 419 N Wentworth St Pensacola, FL | 2.0 | 1.0 | 1100 | $1,195 | $1.09 | 25d | 1 | 1.42mi |
| 3418 Luke St Pensacola, FL | 4.0 | 2.0 | 1620 | $1,800 | $1.11 | 25d | 1 | 1.45mi |
| 3417 W Fisher St Unit C Pensacola, FL | 3.0 | 2.0 | 1106 | $1,350 | $1.22 | 25d | 1 | 1.46mi |
Listing history 21 events
-
2026-06-21days on market $170,000 Active 60 DOM
-
2026-06-18days on market $170,000 Active 57 DOM
-
2026-06-17days on market $170,000 Active 56 DOM
-
2026-06-16days on market $170,000 Active 55 DOM
-
2026-06-15days on market $170,000 Active 54 DOM
-
2026-06-14days on market $170,000 Active 52 DOM
-
2026-06-10days on market $170,000 Active 49 DOM
-
2026-06-09days on market $170,000 Active 48 DOM
-
2026-06-08days on market $170,000 Active 47 DOM
-
2026-06-07days on market $170,000 Active 46 DOM
-
2026-06-03days on market $170,000 Active 42 DOM
-
2026-06-02days on market $170,000 Active 41 DOM
-
2026-06-01pricedays on market $170,000 Active 40 DOM
-
2026-05-31days on market $175,000 Active 39 DOM
-
2026-05-31days on market $175,000 Active 38 DOM
-
2026-04-22$175,000 Active 562-char remark
-
2025-03-01historical
-
2024-11-22$210,000 Active
-
1985-11-01soldstatus $33,800
-
1982-03-01soldstatus $29,900
-
1980-08-01soldstatus $25,000
ⓘ Source: listings_history table (triggers on properties + properties_extension) + one-shot
backfill from property_details.listing_events for pre-trigger history.
Tax reassessment forecast FL · Resets to sale price
- Current annual tax
- $1,587 · $132/mo
- Projected year-2 tax
- $1,587 · $132/mo
- Expected delta
- $0/yr ($0/mo · 0.0%)
ⓘ Screening estimate from a state-policy table — verify with the county assessor before closing.
Climate risk First Street
- Flood 1/10 Low FEMA zone X (unshaded) · 0% chance over 30 yrs
- Wildfire 2/10 Low
- Heat 10/10 Extreme 7 d/yr ≥105°F today · 22 d/yr by 30 yrs out
- Wind 9/10 Extreme 99% chance of damaging wind over 30 yrs
- Air quality 1/10 Low 0 unhealthy d/yr today · 0 by 30 yrs out
Nearby sold comps map
Loading sold comps map…
Walkable amenities ~0.75 mi
Loading nearby amenities…
Taxation est. · year 1
- Rental income
- $19,215
- − Mortgage interest
- −$9,523
- − Property taxes
- −$1,587
- − Insurance
- −$850
- − Repairs & maintenance
- −$1,537
- − Management
- −$1,537
- − Depreciation
- −$4,945
- Taxable loss
- −$765
- Est. tax savings @ 24.0%
- +$184
- After-tax cash flow
- $2,228/yr
For passive investors: Depreciation is non-cash, so a rental often shows a tax loss while cash-flowing — sheltering income. Rental losses are passive: they offset passive income freely, and up to $25,000/yr can offset ordinary (W-2) income if you actively participate and your MAGI is under $100k (phasing out to $0 by $150k); unused losses carry forward. On sale, claimed depreciation is recaptured at up to 25%, and gains may owe capital-gains tax (a 1031 exchange can defer both). Figures are a year-1 estimate at your 24.0% rate — not tax advice; consult a CPA.
Schools (NCES district)
- District
- Escambia
- NCES district ID
- 1200510
- Math proficiency
- 40% ▼ -9.00%
- Reading proficiency
- 45% ▼ -4.00%
- Median HH income
- $44,649
- Composite
- 36.04/100
- National rank
- #4773
- State rank
- #56 of 73 in FL
Livability — West Pensacola
- Score
- 66/100
- State rank
- #629
- US rank
- #12275
Category grades
Schools grade is shown separately in the Schools card above.
Census & demographics
- Census place
- West Pensacola, FL
- County
- Escambia County · 301,722 people
- Metro
- Pensacola-Ferry Pass-Brent, FL
- Population (ZIP)
- 34,549
- Household income
- $62,486
- Rent vs Own
- Severe rent burden
- 1359.0
Population outlook (Escambia County) Hauer SSP2
- Today (2025)
- 334,637 people
- By 2030
- 345,779 · +3.3%
- By 2040
- 364,828 · +9.0%
- By 2050
- 378,514 · +13.1%
- By 2075
- 403,220 · +20.5%
- By 2100
- 386,125 · +15.4%
Race, ethnicity, and origin ACS 2023
- Neighborhood character
- Diverse neighborhood (Simpson 0.60)
- Race & ethnicity
- White 60% Black 18% Two or more races 11% Hispanic / Latino 6% Asian 6%
- Hispanic origin (detail)
- Mexican 3%
- Common ancestry
- Lithuanian 4% Slovak 2% Italian 2%
- Foreign-born
- 9% · Canada, China, Vietnam
- Languages at home
- 89% English-only · Spanish 4% Tagalog/Filipino 2% Other Indo-European 1%
Political lean MEDSL · Escambia
- 2024 margin
- R (+19.5) · D 39.7% · R 59.2% · Other 1.1%
- 2008→2024 swing
- -0.2pp no change · 2008: -19.3pp · 2024: -19.5pp
- All cycles
- 2024: R+19.5 2020: R+15.1 2016: R+20.6 2012: R+20.6 2008: R+19.3
Not yet ingested
- Civics
- —
Market trends
- HPI YoY
- ▼ -71.86%
- Current HPI
- 247.6085
- Rent YoY
- ▲ 3.85%
- Metro
- Pensacola-Ferry Pass-Brent, FL
- State GDP YoY
- ▲ 3.28%
- F500 in state
- 36
Industry mix (Fortune 500 HQ in FL)
| Industry | F500 HQs | Revenue |
|---|---|---|
| Industrial Technology | 2 | $29B |
|
||
| Insurance | 2 | $17B |
|
||
| Retail | 1 | $60B |
|
||
| Technology Distribution | 1 | $58B |
|
||
| Homebuilding | 1 | $35B |
|
||
| Technology Manufacturing | 1 | $35B |
|
||
Price history
+580.0% since first listed7 events — show timeline
- 2026-06-01 Price Changed $170,000 PARMLS
- 2026-04-22 Listed $175,000 PARMLS
- 2025-03-01 Listing Removed — FORTMLS
- 2024-11-22 Listed $210,000 FORTMLS
- 1985-11-01 Sold (Public Records) $33,800 Public Records
- 1982-03-01 Sold (Public Records) $29,900 Public Records
- 1980-08-01 Sold (Public Records) $25,000 Public Records
Property tax history
+6.5%/yrLatest (2025): $1,587 · +12.1% YoY. Source: county tax records.
Cash-flow waterfall
monthlySold comps — $/sqft
last 12 mo · ≤1 miLoading sold comps…