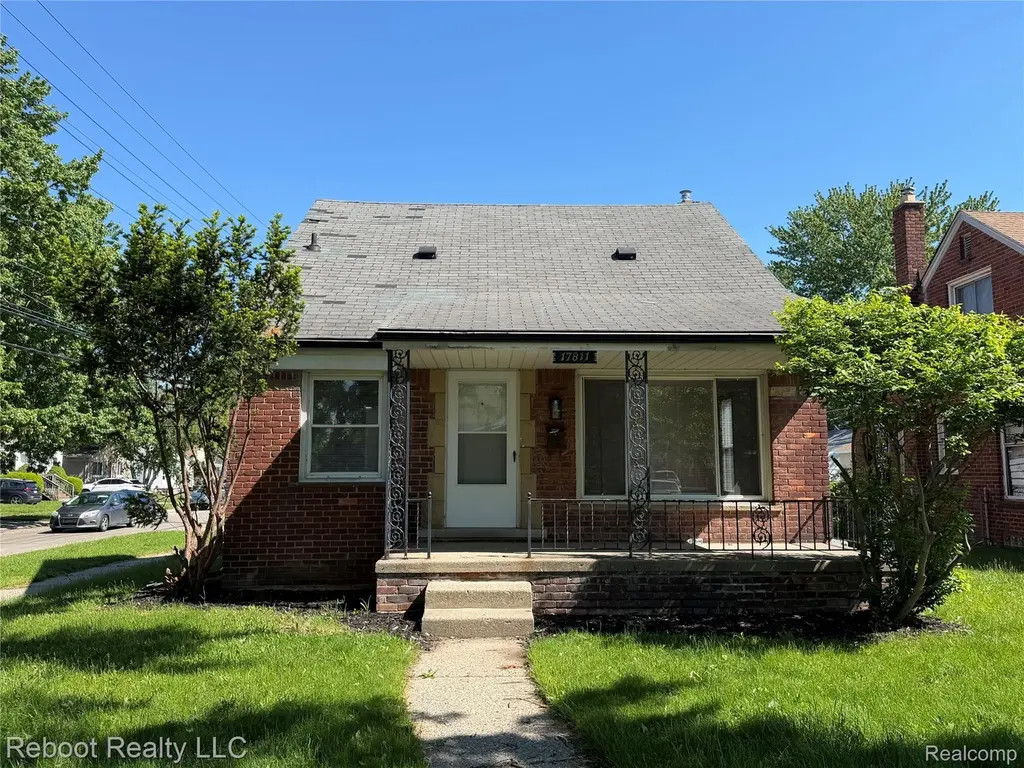
17811 Lincoln Dr · Roseville, MI
Flood risk 1/10 · Minimal
- FEMA flood zone
- X (unshaded)
- Chance of flooding over 30 yrs
- 0.0%
- Est. flood insurance / yr
- $473 – $860
Fire risk 1/10 · Minimal
- Est. fire insurance / yr
- $784 – $1,456
Heat risk 3/10 · Minor
- Hot days now (above 96°F)
- 7 days/yr
- Hot days in 30 yrs
- 15 days/yr
Wind risk 1/10 · Minimal
- Chance of severe wind over 30 yrs
- —
Air-quality risk 4/10 · Minor
- Unhealthy air days now
- 4 days/yr
- Unhealthy air days in 30 yrs
- 5 days/yr
Risk factors via First Street. Map © Google.
Why this score? — see what drove the F grade
The composite is a weighted blend of 9 inputs, each scored 0–100. Each bar is that input's sub-score; the figure is the points it added to the 100-point composite (weight × sub-score).
- Cash flow +5.7/30.0
- Livability +3.6/5.0
- 1% rule +3.2/10.0
- Rent growth +2.6/5.0
- Condition / age +2.5/5.0
- Schools +1.5/10.0
- ARV discount +1.3/15.0
- DSCR +0.1/10.0
- Appreciation +0.0/10.0
$184,999
🖨 Deal sheet (PDF) 📄 Offer letter ✓ Due diligence
Listing remarks MLS
Welcome to this well-maintained brick bungalow located at 17811 Lincoln Dr. This spacious two-story home is an excellent starter home featuring a functional layout with hardwood flooring throughout much of the main level, fresh paint, updated lighting fixtures, and a finished basement offering additional living and entertaining space. The upper level features a large open layout with brand-new carpeting and built-in storage, ideal for a primary suite, flex space, or home office. The main floor includes bright bedrooms, a full bathroom with classic tile finishes, and abundant natural light throughout. Additional updates include a new water heater installed in 2025 and a brand-new roof currently being installed for added peace of mind and will be completed before 5-30-2026 Outside, enjoy the covered front porch, spacious yard, long driveway, and detached 2-car garage with ample storage and workspace potential. Conveniently located near shopping, dining, schools, and major expressways with quick access to Downtown Detroit and surrounding Metro Detroit communities. Seller is a licensed real estate agent.
Key facts
- Hardwood flooring
- Brick bungalow
- Large open layout
Tags
Property features AI
Finance
- Other: Home warranty included
Exterior
- Parking: Detached 2-car garage; Driveway; Garage door opener
- Utilities: Public water; Public sewer
- Home design: Single-family residence; Ground-level entry
- Construction: Brick construction; Block foundation
- Exterior features: Paved driveway
Interior
- Kitchen: Dishwasher; Free-standing electric range; Free-standing refrigerator; Range hood
- Bathrooms: 1 full bathroom; 1 half bathroom
- Heating & cooling: Forced air heating (natural gas); No central air
- Interior features: Finished basement; Range hood
- Laundry & utility: Washer; Dryer
Neighborhood map
What this means for you Summary
Snapshot
- This is a 3-bed/1.5-bath single-family listed at $185k.
Deal economics
- At list price, monthly cash flow is $-377 ($-5k/yr) — negative.
- To cash-flow at today's rent, offer at most $126k (32.0% below list).
- To meet the 1% rule (rent ≥ 1% of price), the offer needs to be $151k (18.2% below list).
- Recommended offer: $126k (32.0% below list) — sets the bar for cash-flow.
- Cap rate 3.8% vs local median 5.9% in Roseville — below-typical yield; the buyer is paying a premium for something (appreciation thesis, condition, location) that the cap rate doesn't capture.
Location & tenants
- Location reads 72/100 on livability (#258 in MI) — a middle-class / working-renter tenant base. Strengths: commute A+, cost of living A+, housing A+; Watch: health & safety D+, employment D, crime F.
- Roseville Community Schools (suburban): math 11% / reading 24% proficiency, ranked #483 of 540 in MI (top 89%) — low school quality limits family demand, transient renter base, plan for 1-2y turnover; 60% free/reduced lunch — lower-income household profile, screen leases tightly.
- Zoned schools: Roseville High School (math 12% / reading 27%, grade F, #622 of 713 statewide, top 88%, 1,216 students, 70% FRL).
- Market conditions: Rents flat; 269 active listings in the ZIP; 33 comparable units currently listed for rent nearby; rentals at typical pace (median 21d on market — plan ~3-4 weeks tenant-placement turnaround); 1,321 units permitted in Macomb County in 2024 (86 in 5+ unit buildings).
Forward outlook
- Local home prices are declining (-3.0%/yr); year-one equity from $1k of loan paydown is wiped out by about $6k of value loss. Plan a longer hold.
- Macomb County population projected at +9% by 2050 — modest demand growth; plan on rents tracking national, not racing it.
Negotiation context
- Only 5 days on market — expect competitive offers; lowballing is unlikely to land.
- 5 sale attempts since 22y ago with the ask held roughly flat each time — persistent listings suggest the price (not the market) is what's stuck; bring a comps-based counter.
- Current owner paid $136k; 36% above their basis — modest negotiation headroom, anchor on the comps not their cost.
Risks & watch-outs
- Watch-outs: property tax is 3.4% of price; built in 1952 — expect roof / HVAC / electrical / plumbing capex.
Questions for the listing agent
- What do current leases actually rent for vs. the listed asking? Can we see a recent rent roll and the last 12 months of T-12 income?
- Built in 1952 — when were the roof, HVAC, electrical panel, plumbing, and water heater last replaced?
- Property tax is high relative to price — has the assessment been appealed recently, and will the sale trigger a re-assessment?
- Is there a deadline driving the sale (1031 exchange, divorce, estate, relocation)? That informs how much negotiation room exists.
- Schools are F-rated, which usually means shorter tenancies and higher turnover. Who's the typical renter profile here, and what's been the actual vacancy rate?
- Crime grade is F in this area — have there been break-ins, vandalism, or insurance claims at this property in the last 3 years? What carrier currently insures it and at what premium?
- The area grade is low — what's the realistic commute time and amenity access for the typical tenant pool here? Any planned neighborhood developments (good or bad) we should know about?
- What's the average days-on-market for RENTAL listings here right now (not sales)? A rising rental-DOM trend means longer vacancies and softer asking-rent achievability than the comps imply.
- What's the recent tenant-quality profile in this submarket — average credit score on applications, eviction rate, late-payment / NSF rate, and stable-employment percentage? A property-management company in the area should have these aggregated.
- How much new for-sale + rental construction is in the pipeline within 1–3 miles? Heavy new supply typically softens prices + rents 12–24 months out; constrained supply supports both.
Investment metrics
- 1% rule
- 0.82% ✗
- Cap rate
- 3.85%
- Cash-on-cash
- -8.73%
- DSCR
- 0.61
- GRM
- 10.2
CMA / ARV
- ARV (on-the-fly)
- $162,688
- Comps found
- 12
Show comp detail 12 sales within ~0.75 mi
| Address | Dist | Beds/Ba | Sqft | Sold | Price | $/sf | Match |
|---|---|---|---|---|---|---|---|
| 28889 Hillview St | 0.21mi | 3/1.0 | 1,288 (-2%) | 2mo | $117,000 | $91 | 84 |
| 29295 Hillview St | 0.49mi | 3/1.0 | 1,285 (-2%) | 4mo | $140,000 | $109 | 68 |
| 29570 Rosemont St | 0.63mi | 3/1.5 | 1,301 (-1%) | 1mo | $161,500 | $124 | 68 |
| 17891 Birmingham St St | 0.40mi | 3/1.0 | 1,399 (+7%) | 2mo | $169,900 | $121 | 67 |
| 28222 Bohn St | 0.42mi | 3/2.0 | 1,408 (+7%) | 4mo | $200,000 | $142 | 63 |
| 28076 Schram St | 0.69mi | 3/1.5 | 1,400 (+7%) | 3mo | $245,000 | $175 | 54 |
| 29450 Ruthdale St | 0.68mi | 4/2.0 (+1) | 1,424 (+8%) | 0mo | $222,600 | $156 | 47 |
| 27375 Edward St | 0.63mi | 3/1.0 | 1,476 (+12%) | 1mo | $106,100 | $72 | 47 |
| 17751 Pasadena St | 0.73mi | 3/2.5 | 1,440 (+10%) | 4mo | $300,000 | $208 | 42 |
| 28059 Schram St | 0.67mi | 3/1.0 | 1,119 (-15%) | 3mo | $135,000 | $121 | 40 |
| 29920 Pinehurst St | 0.73mi | 3/1.0 | 1,128 (-14%) | 2mo | $159,000 | $141 | 39 |
| 29820 Quinkert St | 0.75mi | 3/1.0 | 1,492 (+14%) | 2mo | $136,000 | $91 | 39 |
Match score weights: distance 35% · size 25% · config 20% · recency 20%. Top-matched comps best support the ARV.
Projected returns pro-forma
-3.0% appreciation · 0.39% rent growth · sell at horizon
- IRR
- -35.4%
- Equity multiple
- -0.11×
- Total profit
- $-57,641
- Equity at exit
- $27,584
- IRR
- -73.6%
- Equity multiple
- -0.84×
- Total profit
- $-95,343
- Equity at exit
- $15,995
Cash invested: $51,800 (down + closing). Projections, not guarantees.
Landlord ↔ Tenant lean methodology
- Overall (STATE)
- 62 Landlord-Friendly
- State Michigan
- 62 Landlord-Friendly · EVEN
- County
- — inherits STATE
- City
- — inherits STATE
ZIP-level market 48066
- Rents YoY
- 0.4%
- Active inventory
- 269
- Price-to-rent
- 10.2×
Monthly cashflow live
- Estimated rent
- $1,513 high interval (Pro) →
- Mortgage (P&I)
- −$970
- Tax from tax record
- −$525 /mo · $6,295/yr
- Insurance
- −$77
- HOA
- −$0
- Vacancy / Maint / Mgmt
- −$318
- Net cashflow
- $-377
Break-even live
Sensitivity live
| Price | -10% $-272 | -5% $-324 | +0% $-377 | +5% $-429 | +10% $-481 |
|---|---|---|---|---|---|
| Rent | -10% $-496 | -5% $-436 | +0% $-377 | +5% $-317 | +10% $-257 |
| Rate | -1.0pp $-284 | -0.5pp $-330 | base $-377 | +0.5pp $-425 | +1.0pp $-473 |
UW: 25.0% down · 7.5% · 30yr · 1.5% tax · 5.0% vac · 8.0% maint · 8.0% mgmt
Financing live
Cash to close
- Down payment
- $46,250
- Closing costs
- $5,550
- Reserves months
- —
- Total cash needed
- —
Loan-product check · same deal, 3 products live
Conventional
25% down · 7.5% · 30yr
- Down + closing
- —
- Monthly P&I
- —
- Monthly cashflow
- —
- DSCR
- —
- Eligible?
- —
Personal DTI + credit; lowest rate.
DSCR
20% down · 8.5% · 30yr
- Down + closing
- —
- Monthly P&I
- —
- Monthly cashflow
- —
- DSCR
- —
- Eligible?
- —
No personal income docs; deal must DSCR.
Hard money
10% down · 12.0% · 12mo
- Down + closing
- —
- Monthly P&I
- —
- Monthly cashflow
- —
- DSCR
- —
- Eligible?
- —
Short-term bridge; refi at stabilization.
Rent comps 33 comps
| Address | Beds | Baths | Sqft | Rent | $/sqft | DOM | Units | Dist |
|---|---|---|---|---|---|---|---|---|
| 28320 Hillview St Roseville, MI | 3.0 | 1.0 | 1224 | $1,500 | $1.23 | 1d | 1 | 0.09mi |
| 28744 Maple St Roseville, MI | 3.0 | 1.0 | 1050 | $1,295 | $1.23 | 45d | 1 | 0.19mi |
| 18410 Tranquil St Roseville, MI | 3.0 | 1.0 | 1140 | $1,800 | $1.58 | 45d | 1 | 0.36mi |
| 18410 Tranquil St Roseville, MI | 3.0 | 1.0 | 1140 | $1,800 | $1.58 | 16d | 1 | 0.36mi |
| 17405 Ivanhoe St Roseville, MI | 3.0 | 1.0 | 969 | $1,600 | $1.65 | 45d | 1 | 0.39mi |
| 17392 Tennyson St Roseville, MI | 3.0 | 1.0 | 900 | $1,649 | $1.83 | 4d | 1 | 0.46mi |
| 28232 Floral St Unit 1032343P Roseville, MI | 3.0 | 1.0 | 1496 | $6,419 | $4.29 | 0d | 1 | 0.57mi |
| 18635 Meier St Unit : Back Roseville, MI | 2.0 | 1.0 | 900 | $1,100 | $1.22 | 26d | 1 | 0.63mi |
| 16651 Twelve Mile Rd Roseville, MI | 2.0–3.0 | 1.5 | 957 | $1,720 | $1.80 | 0d | 1 | 0.79mi |
| 27881 O Neil Roseville, MI | 3.0 | 1.0 | 1300 | $1,300 | $1.00 | 0d | 1 | 0.88mi |
| 27881 O Neil Roseville, MI | 3.0 | 1.0 | 1300 | $1,300 | $1.00 | 26d | 1 | 0.88mi |
| 16944 E 11 Mile Rd Unit C2 Roseville, MI | 2.0 | 1.0 | 900 | $1,295 | $1.44 | 26d | 1 | 0.91mi |
| 19236 Florida St Roseville, MI | 2.0 | 1.0 | 1160 | $1,700 | $1.47 | 0d | 1 | 0.92mi |
| 16840 E Eleven Mile Rd Unit 104 Roseville, MI | 2.0 | 1.0 | 900 | $1,200 | $1.33 | 45d | 1 | 0.94mi |
| 16840 E Eleven Mile Rd Roseville, MI | 2.0 | 1.0 | 900 | $1,300 | $1.44 | 23d | 3 | 0.94mi |
| 16840 E Eleven Mile Rd Roseville, MI | 2.0 | 1.0 | 900 | $1,300 | $1.44 | 26d | 3 | 0.94mi |
| 16840 E 11 Mile Rd Unit 109 Roseville, MI | 2.0 | 1.0 | 900 | $1,400 | $1.56 | 45d | 1 | 0.94mi |
| 16840 E Eleven Mile Rd Unit 103 Roseville, MI | 2.0 | 1.0 | 900 | $1,250 | $1.39 | 45d | 1 | 0.94mi |
| 27547 O Neil Roseville, MI | 3.0 | 1.0 | 1014 | $1,350 | $1.33 | 6d | 1 | 0.95mi |
| 27067 Lawnwood St Roseville, MI | 3.0 | 1.0 | 960 | $1,500 | $1.56 | 45d | 1 | 0.99mi |
| 30512 Oakridge Manor Dr Roseville, MI | 2.0 | 1.5 | 1002 | $1,350 | $1.35 | 26d | 1 | 1.06mi |
| 26251 Pinehurst St Unit 251d Roseville, MI | 2.0 | 1.0 | 1000 | $1,200 | $1.20 | 45d | 1 | 1.10mi |
| 26221 Pinehurst St Roseville, MI | 2.0 | 1.0 | 1000 | $1,200 | $1.20 | 1d | 1 | 1.11mi |
| 30583 Hidden Pines Ln Roseville, MI | 2.0 | 2.0 | 1100 | $1,250 | $1.14 | 18d | 1 | 1.17mi |
| 30773 Hidden Pines Ln Roseville, MI | 2.0 | 2.0 | 1142 | $1,500 | $1.31 | 45d | 1 | 1.19mi |
| 30657 Hidden Pines Ln Roseville, MI | 2.0 | 2.0 | 1174 | $1,650 | $1.41 | 21d | 1 | 1.19mi |
| 30761 Hidden Pines Ln Roseville, MI | 2.0 | 1.0 | 877 | $1,295 | $1.48 | 0d | 1 | 1.19mi |
| 27241 Woodmont St Roseville, MI | 3.0 | 1.0 | 924 | $1,550 | $1.68 | 3d | 1 | 1.19mi |
| 17134 E Thirteen Mile Rd Roseville, MI | 1.0–2.0 | 1.0 | 825 | $1,269 | $1.54 | 3d | 16 | 1.24mi |
| 26511 Grandmont St Roseville, MI | 3.0 | 1.0 | 960 | $1,495 | $1.56 | 6d | 1 | 1.40mi |
| 19040 E 13 Mile Rd Roseville, MI | 3.0 | 1.0 | 1008 | $1,550 | $1.54 | 0d | 1 | 1.40mi |
| 19054 E 13 Mile Rd Roseville, MI | 3.0 | 1.0 | 1066 | $1,600 | $1.50 | 0d | 1 | 1.41mi |
| 26536 Kathy St Roseville, MI | 3.0 | 1.0 | 1000 | $1,499 | $1.50 | 26d | 1 | 1.44mi |
Listing history 13 events
-
2026-06-01status $184,999 Pending 5 DOM
-
2026-05-31days on market $184,999 Active 5 DOM
-
2026-05-26$184,999 Active
-
2026-05-25$184,999 Active 1117-char remark
Show marketing remark (1117 chars)
Welcome to this well-maintained brick bungalow located at 17811 Lincoln Dr. This spacious two-story home is an excellent starter home featuring a functional layout with hardwood flooring throughout much of the main level, fresh paint, updated lighting fixtures, and a finished basement offering additional living and entertaining space. The upper level features a large open layout with brand-new carpeting and built-in storage, ideal for a primary suite, flex space, or home office. The main floor includes bright bedrooms, a full bathroom with classic tile finishes, and abundant natural light throughout. Additional updates include a new water heater installed in 2025 and a brand-new roof currently being installed for added peace of mind and will be completed before 5-30-2026 Outside, enjoy the covered front porch, spacious yard, long driveway, and detached 2-car garage with ample storage and workspace potential. Conveniently located near shopping, dining, schools, and major expressways with quick access to Downtown Detroit and surrounding Metro Detroit communities. Seller is a licensed real estate agent.
-
2005-12-28soldstatus $136,000 407-char remark
Show marketing remark (407 chars)
This full brick home is truly outstanding. Lg updated kitchen w/ oak cab, island w/ dshwr, appliances stay & a lg eating area. Nicely decorated w/ beautiful HW flrs, spacious knotty pine finished master bdrm w/ 3-closets. New furn & AC in 04. Copper plmg, vinyl windows, roof only 9-yrs old. Mercury light on oversized garage w/ opener. Tile tub surround in nice bath. Duct work cleaned in 2002.
-
2005-07-05soldstatus $136,000
-
2005-06-20soldstatus $136,000
-
2005-04-25historical
-
2005-03-08$136,900 407-char remark
Show marketing remark (407 chars)
This full brick home is truly outstanding. Lg updated kitchen w/ oak cab, island w/ dshwr, appliances stay & a lg eating area. Nicely decorated w/ beautiful HW flrs, spacious knotty pine finished master bdrm w/ 3-closets. New furn & AC in 04. Copper plmg, vinyl windows, roof only 9-yrs old. Mercury light on oversized garage w/ opener. Tile tub surround in nice bath. Duct work cleaned in 2002.
-
2005-02-08$136,900
-
2005-02-01historical
-
2004-11-02$145,000
-
1991-01-22soldstatus $61,000
ⓘ Source: listings_history table (triggers on properties + properties_extension) + one-shot
backfill from property_details.listing_events for pre-trigger history.
Tax reassessment forecast MI · Partial reset (capped growth)
- Current annual tax
- $6,295 · $525/mo
- Projected year-2 tax
- $6,295 · $525/mo
- Expected delta
- $0/yr ($0/mo · 0.0%)
ⓘ Screening estimate from a state-policy table — verify with the county assessor before closing.
Climate risk First Street
- Flood 1/10 Low FEMA zone X (unshaded) · 0% chance over 30 yrs
- Wildfire 1/10 Low
- Heat 3/10 Moderate 7 d/yr ≥96°F today · 15 d/yr by 30 yrs out
- Wind 1/10 Low
- Air quality 4/10 Moderate 4 unhealthy d/yr today · 5 by 30 yrs out
Nearby sold comps map
Loading sold comps map…
Walkable amenities ~0.75 mi
Loading nearby amenities…
Taxation est. · year 1
- Rental income
- $18,153
- − Mortgage interest
- −$10,363
- − Property taxes
- −$6,295
- − Insurance
- −$925
- − Repairs & maintenance
- −$1,452
- − Management
- −$1,452
- − Depreciation
- −$5,382
- Taxable loss
- −$7,716
- Est. tax savings @ 24.0%
- +$1,852
- After-tax cash flow
- $-2,669/yr
For passive investors: Depreciation is non-cash, so a rental often shows a tax loss while cash-flowing — sheltering income. Rental losses are passive: they offset passive income freely, and up to $25,000/yr can offset ordinary (W-2) income if you actively participate and your MAGI is under $100k (phasing out to $0 by $150k); unused losses carry forward. On sale, claimed depreciation is recaptured at up to 25%, and gains may owe capital-gains tax (a 1031 exchange can defer both). Figures are a year-1 estimate at your 24.0% rate — not tax advice; consult a CPA.
Schools (NCES district)
- District
- Roseville Community Schools
- NCES district ID
- 2630210
- Math proficiency
- 11% ▼ -8.00%
- Reading proficiency
- 24% ▼ -7.00%
- Median HH income
- $41,590
- Composite
- 14.98/100
- National rank
- #9363
- State rank
- #483 of 540 in MI
Livability — Roseville
- Score
- 72/100
- State rank
- #258
- US rank
- #6400
Category grades
Schools grade is shown separately in the Schools card above.
Census & demographics
- Census place
- Roseville, MI
- County
- Macomb County · 638,552 people
- City population
- 47,123
- Metro
- Detroit-Warren-Dearborn, MI
- Population (ZIP)
- 47,123
- Household income
- $62,182
- Rent vs Own
- Severe rent burden
- 1712.0
Population outlook (Macomb County) Hauer SSP2
- Today (2025)
- 925,296 people
- By 2030
- 948,226 · +2.5%
- By 2040
- 983,961 · +6.3%
- By 2050
- 1,010,200 · +9.2%
- By 2075
- 1,076,222 · +16.3%
- By 2100
- 1,077,065 · +16.4%
Race, ethnicity, and origin ACS 2023
- Neighborhood character
- Predominantly White (65%)
- Race & ethnicity
- White 65% Black 23% Two or more races 7% Hispanic / Latino 4% Asian 2%
- Common ancestry
- Romanian 12% Lithuanian 4% Slovak 2%
- Foreign-born
- 5% · Canada
- Languages at home
- 93% English-only · Spanish 2% Russian/Polish/Slavic 1% Other Indo-European 1%
Political lean MEDSL · Macomb
- 2024 margin
- R (+13.7) · D 42.2% · R 55.9% · Other 1.9%
- 2008→2024 swing
- -22.3pp toward R · 2008: 8.6pp · 2024: -13.7pp
- All cycles
- 2024: R+13.7 2020: R+8.1 2016: R+11.6 2012: D+4.0 2008: D+8.6
Not yet ingested
- Civics
- —
Market trends
- HPI YoY
- ▼ -232.95%
- Current HPI
- 217.4171
- Rent YoY
- ▲ 0.39%
- Metro
- Detroit-Warren-Dearborn, MI
- State GDP YoY
- ▲ 1.37%
- F500 in state
- 28
Industry mix (Fortune 500 HQ in MI)
| Industry | F500 HQs | Revenue |
|---|---|---|
| Automotive Parts | 3 | $48B |
|
||
| Automotive | 2 | $372B |
|
||
| Chemicals | 1 | $45B |
|
||
| Automotive Retail | 1 | $29B |
|
||
| Healthcare / Medical Devices | 1 | $23B |
|
||
| Automotive Technology | 1 | $20B |
|
||
Price history
+203.3% since first listed11 events — show timeline
- 2026-05-26 Listed $184,999 REALCOMP
- 2026-05-25 Listed $184,999 MiRealSource-MiMLS
- 2005-12-28 Sold (MLS) $136,000 REALCOMP
- 2005-07-05 Sold (Public Records) $136,000 Public Records
- 2005-06-20 Sold (MLS) $136,000 MiRealSource-MiMLS
- 2005-04-25 Listing Removed — MiRealSource-MiMLS
- 2005-03-08 Listed $136,900 REALCOMP
- 2005-02-08 Listed $136,900 MiRealSource-MiMLS
- 2005-02-01 Listing Removed — MiRealSource-MiMLS
- 2004-11-02 Listed $145,000 MiRealSource-MiMLS
- 1991-01-22 Sold (Public Records) $61,000 Public Records
Property tax history
+12.7%/yrLatest (2025): $6,295 · +4.0% YoY. Source: county tax records.
Cash-flow waterfall
monthlySold comps — $/sqft
last 12 mo · ≤1 miLoading sold comps…