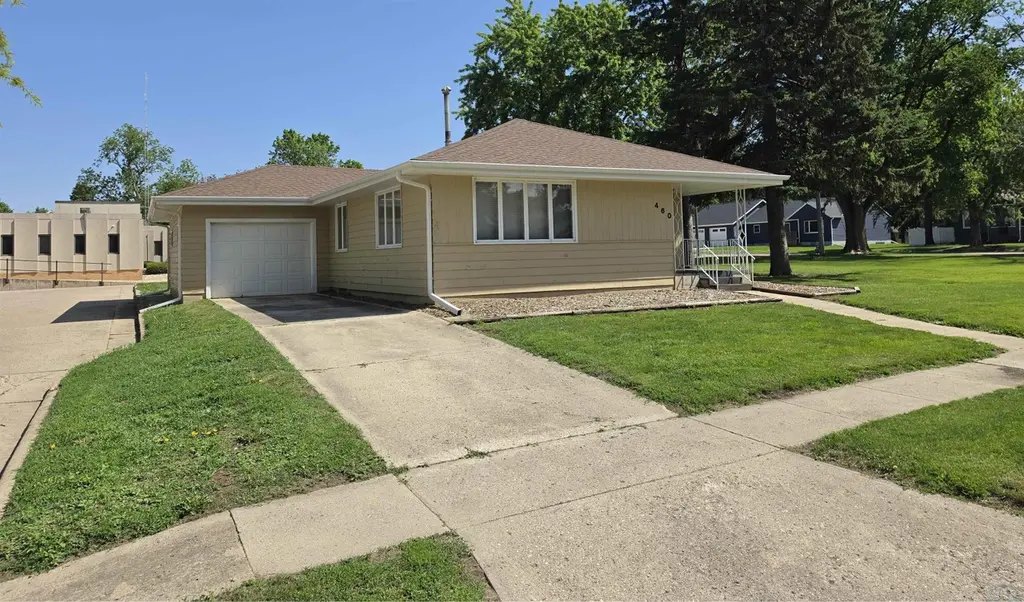
460 & 480 2nd St St NE · Primghar, IA
Flood risk 1/10 · Minimal
- FEMA flood zone
- X (unshaded)
- Chance of flooding over 30 yrs
- 0.0%
- Est. flood insurance / yr
- $473 – $860
Fire risk 1/10 · Minimal
- Est. fire insurance / yr
- $902 – $1,676
Heat risk 2/10 · Minimal
- Hot days now (above 101°F)
- 7 days/yr
- Hot days in 30 yrs
- 15 days/yr
Wind risk 2/10 · Minimal
- Chance of severe wind over 30 yrs
- —
Air-quality risk 1/10 · Minimal
- Unhealthy air days now
- 0 days/yr
- Unhealthy air days in 30 yrs
- 0 days/yr
Risk factors via First Street. Map © Google.
Why this score? — see what drove the C- grade
The composite is a weighted blend of 9 inputs, each scored 0–100. Each bar is that input's sub-score; the figure is the points it added to the 100-point composite (weight × sub-score).
- ARV discount +15.0/15.0
- Cash flow +9.1/30.0
- Appreciation +8.1/10.0
- Schools +5.5/10.0
- Livability +3.8/5.0
- DSCR +2.5/10.0
- Rent growth +2.5/5.0
- Condition / age +2.5/5.0
- 1% rule +1.5/10.0
$137,000
🖨 Deal sheet (PDF) 📄 Offer letter ✓ Due diligence
Listing remarks
Check out this great opportunity to purchase a three bedroom ranch style home that includes the beautiful open corner lot next to it. The home has a nice layout with a spacious living room to the front of the home. There is a dedicated dining area in the center of the home that has a built-in hutch. The kitchen and dining area are divided by breakfast bar, making a great place to sit and enjoy a quick meal or a place to sit and visit while meals are being prepared in the kitchen. All three of the bedrooms are located on the main floor with a bathroom in the middle. The basement offers a lot of untapped potential for added living space if the buyer would want to finish it off. This property
Key facts
- Large open lot
- Built-in hutch
- Open corner lot
Tags
Property features AI
Exterior
- Parking: Attached garage with concrete parking (1 garage space)
- Utilities: Public water; Public sewer
- Home design: Single-family residential; Wood siding; Shingle roof
- Construction: Wood siding construction
- Exterior features: Level lot; In-ground pool
Interior
- Bathrooms: 1 full bathroom
- Heating & cooling: Natural gas forced air heating; Central air conditioning
- Interior features: Built-in features; Full basement
Neighborhood map
What this means for you Summary
Snapshot
- This is a 2-bed/1.0-bath single-family listed at $137k.
Deal economics
- At list price, monthly cash flow is $-104 ($-1k/yr) — negative.
- To cash-flow at today's rent, offer at most $119k (13.5% below list).
- To meet the 1% rule (rent ≥ 1% of price), the offer needs to be $90k (34.7% below list).
- Recommended offer: $90k (34.7% below list) — sets the bar for 1% rule.
Location & tenants
- Location reads 76/100 on livability (#193 in IA, #3,535 nationally) — a middle-class / working-renter tenant base. Strengths: crime A+, cost of living A+, housing A+; Watch: amenities F, commute F.
- South O'Brien Community School District (rural): math 64% / reading 66% proficiency, ranked #196 of 289 in IA (top 68%) — acceptable for families but not a draw, mixed tenant base, ~2y average lease.
- Zoned schools: South O'Brien Elem Sch Primghar Center (math 67% / reading 67%, grade B+, #273 of 616 statewide, top 51%, 324 students, 38% FRL); South O'Brien Secondary School (math 62% / reading 66%, grade B-, #235 of 336 statewide, top 71%, 252 students, 30% FRL).
- Market conditions: 14 active listings in the ZIP; 1 comparable units currently listed for rent nearby; 13 units permitted in O'Brien County in 2024 (0 in 5+ unit buildings).
Forward outlook
- In year one you build about $9k of equity ($947 loan paydown + $8k appreciation (6.2% local appreciation)).
- O'Brien County population projected at -11% by 2050 — secular population decline; favor cash flow + early exit over multi-decade hold.
- By year 4, paydown + projected appreciation supports a ~$32k cash-out refi (75% LTV) — recoverable capital for the next deal without selling this one.
Negotiation context
- Only 12 days on market — expect competitive offers; lowballing is unlikely to land.
- 6 sale attempts since 3y ago with the ask held roughly flat each time — persistent listings suggest the price (not the market) is what's stuck; bring a comps-based counter.
Risks & watch-outs
- Watch-outs: built in 1958 — expect roof / HVAC / electrical / plumbing capex.
Questions for the listing agent
- What do current leases actually rent for vs. the listed asking? Can we see a recent rent roll and the last 12 months of T-12 income?
- Built in 1958 — when were the roof, HVAC, electrical panel, plumbing, and water heater last replaced?
- Is there a deadline driving the sale (1031 exchange, divorce, estate, relocation)? That informs how much negotiation room exists.
- Schools are B-rated — typically a magnet for longer-tenancy family renters. What's the average tenant stay here, and is there a school-zone premium baked into asking?
- What's the average days-on-market for RENTAL listings here right now (not sales)? A rising rental-DOM trend means longer vacancies and softer asking-rent achievability than the comps imply.
- What's the recent tenant-quality profile in this submarket — average credit score on applications, eviction rate, late-payment / NSF rate, and stable-employment percentage? A property-management company in the area should have these aggregated.
- How much new for-sale + rental construction is in the pipeline within 1–3 miles? Heavy new supply typically softens prices + rents 12–24 months out; constrained supply supports both.
Investment metrics
- 1% rule
- 0.65% ✗
- Cap rate
- 5.38%
- Cash-on-cash
- -3.27%
- DSCR
- 0.85
- GRM
- 12.8
CMA / ARV
- ARV (on-the-fly)
- $182,771
- Comps found
- 2
Show comp detail 2 sales within ~0.75 mi
| Address | Dist | Beds/Ba | Sqft | Sold | Price | $/sf | Match |
|---|---|---|---|---|---|---|---|
| 240 3rd St St NE | 0.34mi | 2/2.0 | 1,076 (+14%) | 2mo | $107,000 | $99 | 56 |
| 655 S Mccormack Ave | 0.46mi | 2/1.5 | 1,069 (+13%) | 1mo | $206,000 | $193 | 54 |
Match score weights: distance 35% · size 25% · config 20% · recency 20%. Top-matched comps best support the ARV.
Projected returns pro-forma
6.17% appreciation · 3.0% rent growth · sell at horizon
- IRR
- 13.1%
- Equity multiple
- 1.89×
- Total profit
- $34,197
- Equity at exit
- $87,577
- IRR
- 13.6%
- Equity multiple
- 3.75×
- Total profit
- $105,308
- Equity at exit
- $160,085
Cash invested: $38,360 (down + closing). Projections, not guarantees.
Landlord ↔ Tenant lean methodology
- Overall (STATE)
- 83 Strongly Landlord-Friendly
- State Iowa
- 83 Strongly Landlord-Friendly · R+6
- County
- — inherits STATE
- City
- — inherits STATE
ZIP-level market 51245
- Home prices YoY
- 4.3%
- Active inventory
- 14
- Price-to-rent
- 12.8×
Monthly cashflow live
- Estimated rent
- $895 medium interval (Pro) →
- Mortgage (P&I)
- −$718
- Tax from tax record
- −$36 /mo · $432/yr
- Insurance
- −$57
- HOA
- −$0
- Vacancy / Maint / Mgmt
- −$188
- Net cashflow
- $-104
Break-even live
Sensitivity live
| Price | -10% $-27 | -5% $-66 | +0% $-104 | +5% $-143 | +10% $-182 |
|---|---|---|---|---|---|
| Rent | -10% $-175 | -5% $-140 | +0% $-104 | +5% $-69 | +10% $-34 |
| Rate | -1.0pp $-35 | -0.5pp $-70 | base $-104 | +0.5pp $-140 | +1.0pp $-176 |
UW: 25.0% down · 7.5% · 30yr · 1.5% tax · 5.0% vac · 8.0% maint · 8.0% mgmt
Financing live
Cash to close
- Down payment
- $34,250
- Closing costs
- $4,110
- Reserves months
- —
- Total cash needed
- —
Loan-product check · same deal, 3 products live
Conventional
25% down · 7.5% · 30yr
- Down + closing
- —
- Monthly P&I
- —
- Monthly cashflow
- —
- DSCR
- —
- Eligible?
- —
Personal DTI + credit; lowest rate.
DSCR
20% down · 8.5% · 30yr
- Down + closing
- —
- Monthly P&I
- —
- Monthly cashflow
- —
- DSCR
- —
- Eligible?
- —
No personal income docs; deal must DSCR.
Hard money
10% down · 12.0% · 12mo
- Down + closing
- —
- Monthly P&I
- —
- Monthly cashflow
- —
- DSCR
- —
- Eligible?
- —
Short-term bridge; refi at stabilization.
Rent comps 1 comps
| Address | Beds | Baths | Sqft | Rent | $/sqft | DOM | Units | Dist |
|---|---|---|---|---|---|---|---|---|
| 460 2nd St NW Primghar, IA | 2.0 | 1.0 | 947 | $895 | $0.95 | 45d | 1 | 0.03mi |
Listing history 10 events
-
2026-06-21days on market $137,000 Active 12 DOM
-
2026-06-21days on market $137,000 Active 11 DOM
-
2026-06-18days on market $137,000 Active 9 DOM
-
2026-06-17days on market $137,000 Active 8 DOM
-
2026-06-16days on market $137,000 Active 7 DOM
-
2026-06-15days on market $137,000 Active 6 DOM
-
2026-06-13days on market $137,000 Active 4 DOM
-
2026-06-12days on market $137,000 Active 3 DOM
-
2026-06-09remarks 699-char remark
-
2026-06-09$137,000 Active 1 DOM
ⓘ Source: listings_history table (triggers on properties + properties_extension) + one-shot
backfill from property_details.listing_events for pre-trigger history.
Tax reassessment forecast IA · Partial reset (capped growth)
- Current annual tax
- $432 · $36/mo
- Projected year-2 tax
- $1,291 · $108/mo
- Expected delta
- +$859/yr (+$72/mo · 198.9%)
ⓘ Screening estimate from a state-policy table — verify with the county assessor before closing.
Climate risk First Street
- Flood 1/10 Low FEMA zone X (unshaded) · 0% chance over 30 yrs
- Wildfire 1/10 Low
- Heat 2/10 Low 7 d/yr ≥101°F today · 15 d/yr by 30 yrs out
- Wind 2/10 Low
- Air quality 1/10 Low 0 unhealthy d/yr today · 0 by 30 yrs out
Nearby sold comps map
Loading sold comps map…
Walkable amenities ~0.75 mi
Loading nearby amenities…
Taxation est. · year 1
- Rental income
- $10,740
- − Mortgage interest
- −$7,674
- − Property taxes
- −$432
- − Insurance
- −$685
- − Repairs & maintenance
- −$859
- − Management
- −$859
- − Depreciation
- −$3,985
- Taxable loss
- −$3,755
- Est. tax savings @ 24.0%
- +$901
- After-tax cash flow
- $-353/yr
For passive investors: Depreciation is non-cash, so a rental often shows a tax loss while cash-flowing — sheltering income. Rental losses are passive: they offset passive income freely, and up to $25,000/yr can offset ordinary (W-2) income if you actively participate and your MAGI is under $100k (phasing out to $0 by $150k); unused losses carry forward. On sale, claimed depreciation is recaptured at up to 25%, and gains may owe capital-gains tax (a 1031 exchange can defer both). Figures are a year-1 estimate at your 24.0% rate — not tax advice; consult a CPA.
Schools (NCES district)
- District
- South O'Brien Community School District
- NCES district ID
- 1900026
- Math proficiency
- 64% ▼ -6.00%
- Reading proficiency
- 66% ▼ -7.00%
- Median HH income
- $50,412
- Composite
- 55.26/100
- National rank
- #1267
- State rank
- #196 of 289 in IA
Livability — Primghar
- Score
- 76/100
- State rank
- #193
- US rank
- #3535
Category grades
Schools grade is shown separately in the Schools card above.
Census & demographics
- Census place
- Primghar, IA
- Population (ZIP)
- 1,264
Population outlook (O'Brien County) Hauer SSP2
- Today (2025)
- 13,353 people
- By 2030
- 13,040 · -2.3%
- By 2040
- 12,422 · -7.0%
- By 2050
- 11,887 · -11.0%
- By 2075
- 11,132 · -16.6%
- By 2100
- 10,176 · -23.8%
Race, ethnicity, and origin ACS 2023
- Neighborhood character
- Predominantly White (95%)
- Race & ethnicity
- White 95% Black 3% Two or more races 1%
- Common ancestry
- Iranian 13% Portuguese 4% Slovak 2%
- Foreign-born
- 1% · Canada
Political lean MEDSL · O'Brien
- 2024 margin
- Solid R (+60.9) · D 19.0% · R 80.0% · Other 1.0%
- 2008→2024 swing
- -26.1pp toward R · 2008: -34.9pp · 2024: -60.9pp
- All cycles
- 2024: R+60.9 2020: R+56.8 2016: R+60.2 2012: R+45.2 2008: R+34.9
Not yet ingested
- Civics
- —
Market trends
- HPI YoY
- ▲ 6.17%
- Current HPI
- 148.8467
- Rent YoY
- —
- Metro
- —
- State GDP YoY
- ▲ 2.48%
- F500 in state
- 4
Industry mix (Fortune 500 HQ in IA)
| Industry | F500 HQs | Revenue |
|---|---|---|
| Financial Services | 1 | $16B |
|
||
| Retail / Convenience | 1 | $15B |
|
||
Price history
+73.4% since first listed16 events — show timeline
- 2026-06-08 Listed $137,000 NWIA
- 2026-06-02 Price Changed $875 TURBOTENANT
- 2026-05-03 Listed for Rent $895 TURBOTENANT
- 2026-05-02 Rental Removed $895 BUILDIUM
- 2026-04-30 Price Changed $895 BUILDIUM
- 2026-04-26 Listed for Rent $925 BUILDIUM
- 2026-04-26 Rental Removed $925 TURBOTENANT
- 2026-04-16 Price Changed $925 TURBOTENANT
- 2026-04-07 Price Changed $950 TURBOTENANT
- 2026-03-26 Listed for Rent $999 TURBOTENANT
- 2026-03-25 Rental Removed $999 BUILDIUM
- 2026-03-25 Listed for Rent $999 BUILDIUM
- 2024-01-31 Pending — NWIA
- 2023-10-11 Price Changed $69,900 NWIA
- 2023-09-29 Price Changed $72,500 NWIA
- 2023-08-31 Listed $79,000 NWIA
Property tax history
+4.1%/yrLatest (2025): $432 · +1.4% YoY. Source: county tax records.
Cash-flow waterfall
monthlySold comps — $/sqft
last 12 mo · ≤1 miLoading sold comps…