11684 Dogwood Dr · Lost Bridge Village, AR
Flood risk 1/10 · Minimal
- FEMA flood zone
- X (unshaded)
- Chance of flooding over 30 yrs
- 0.0%
- Est. flood insurance / yr
- $473 – $860
Fire risk 1/10 · Minimal
- Est. fire insurance / yr
- $1,499 – $2,785
Heat risk 4/10 · Minor
- Hot days now (above 105°F)
- 7 days/yr
- Hot days in 30 yrs
- 21 days/yr
Wind risk 2/10 · Minimal
- Chance of severe wind over 30 yrs
- 2.0%
Air-quality risk 1/10 · Minimal
- Unhealthy air days now
- 0 days/yr
- Unhealthy air days in 30 yrs
- 0 days/yr
Risk factors via First Street. Map © Google.
Why this score? — see what drove the B+ grade
The composite is a weighted blend of 9 inputs, each scored 0–100. Each bar is that input's sub-score; the figure is the points it added to the 100-point composite (weight × sub-score).
- Cash flow +26.6/30.0
- ARV discount +15.0/15.0
- DSCR +9.1/10.0
- Appreciation +8.8/10.0
- 1% rule +6.5/10.0
- Schools +3.9/10.0
- Livability +2.9/5.0
- Rent growth +2.5/5.0
- Condition / age +2.5/5.0
$449,000
🖨 Deal sheet (PDF) 📄 Offer letter ✓ Due diligence
Listing remarks
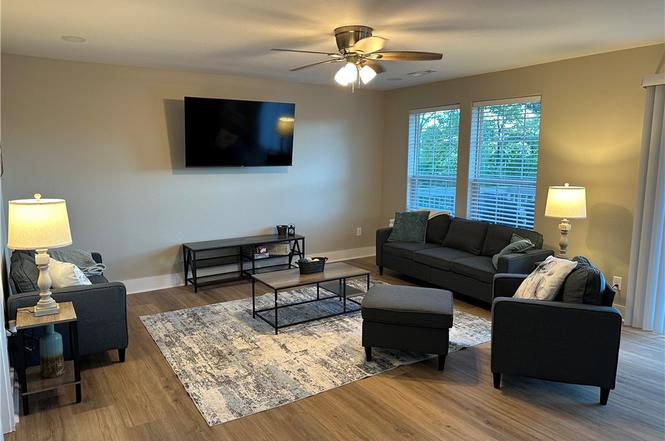
Must sell! Will entertain all offers. Beautiful lake views in this totally remodeled home! Two separate living areas with kitchens. All 4 bedrooms have their own full bathrooms. Walkout patio on the bottom floor and a full deck on the main floor. Currently being rented on Vacasa and ready to be your next passive income opportunity! See below for list of all new furnishings. New LP smart siding, new luxury vinyl floor, new quartz countertops, all new fixtures and cabinets, new roof, new water heaters, new central heat and A/C units, new appliances. Propane tank is prewired to hook up a Generac.
Key facts
- Lake views
- Full deck
- New lp smart siding
Tags
Property features AI
Finance
- HOA & community: Monthly association fee; Community features: lake access, pool
Exterior
- Parking: Concrete driveway
- Security: Fire alarm; Smoke detectors
- Utilities: Cable available; Electricity available; Public water; Sewer available
- Home design: 2 stories; Age unknown; Has view
- Construction: Architectural shingle roof; Construction details: see remarks; Slab foundation
- Exterior features: Concrete driveway; Deck; Patio; Corner lot; Views; Shared road frontage; View of Beaver Lake; Community pool
Interior
- Kitchen: Dishwasher; Electric oven; Electric range; Microwave; Garbage disposal; Refrigerator; Plumbed for ice maker; ENERGY STAR qualified appliances
- Flooring: Luxury vinyl plank; Tile
- Bathrooms: 4 full bathrooms
- Heating & cooling: Central air; Heat pump; Electric heating
- Interior features: Ceiling fans; Programmable thermostat; Quartz countertops; Walk-in closet(s); Window treatments; Blinds
- Laundry & utility: Washer hookup; Dryer hookup; Washer; Dryer; Electric water heater
Neighborhood map
What this means for you Summary
Snapshot
- This is a 4-bed/4.0-bath single-family listed at $449k.
Deal economics
- At list price, monthly cash flow is $1k ($14k/yr) — positive.
- The deal already cash-flows at list — no discount required.
- Meets the 1% rule at list price ($5k rent vs $449k).
- Recommended offer: $409k (9.0% below list) — sets the bar for market timing.
- Cap rate 9.5% vs local median 2.8% in Lost Bridge Village — top-decile yield for the area; either an underpriced asset or a hidden risk that comps aren't pricing in. Stress-test before assuming the spread holds.
Location & tenants
- Location reads 57/100 on livability (#348 in AR) — a working-class tenant base; expect higher turnover. Strengths: housing A+, crime B+, employment B; Watch: cost of living C-, schools F, amenities F.
- Rogers School District (urban): math 45% / reading 45% proficiency, ranked #31 of 238 in AR (top 13%) — families likely to look elsewhere, expect single-tenant / working-renter base with shorter leases.
- Market conditions: 130 active listings in the ZIP; 1 comparable units currently listed for rent nearby; 4,359 units permitted in Benton County in 2024 (402 in 5+ unit buildings).
Forward outlook
- In year one you build about $37k of equity ($3k loan paydown + $34k appreciation (7.6% local appreciation)).
- Benton County population projected at +56% by 2050 — long-run rental-demand tailwind backs the buy-and-hold thesis.
- At projected returns (7.6% appreciation + 3.0% rent growth), your $126k cash investment doubles in ~3 years — after that, you're playing with house money.
- By year 2, paydown + projected appreciation supports a ~$60k cash-out refi (75% LTV) — recoverable capital for the next deal without selling this one.
Negotiation context
- It's been on market 100 days — a 9% lower offer ($409k) is reasonable based on typical stale-listing flexibility.
- 2 sale attempts since 3y ago; this cycle's ask has dropped $26k (5%) from the opening price — seller is motivated, your offer sets the floor, not the list.
- Current owner paid $290k; list at $449k implies a 55% gain — meaningful room to come down on a strong offer.
Questions for the listing agent
- It's been on market 100 days. Have you received any prior offers? Is the seller open to a 9% concession, seller financing, or rate buy-down credit?
- Why hasn't it sold? Are there any deal-killer items the seller is aware of (foundation, flood, title, zoning, code violations)?
- Is there a deadline driving the sale (1031 exchange, divorce, estate, relocation)? That informs how much negotiation room exists.
- Schools are F-rated, which usually means shorter tenancies and higher turnover. Who's the typical renter profile here, and what's been the actual vacancy rate?
- What's the average days-on-market for RENTAL listings here right now (not sales)? A rising rental-DOM trend means longer vacancies and softer asking-rent achievability than the comps imply.
- What's the recent tenant-quality profile in this submarket — average credit score on applications, eviction rate, late-payment / NSF rate, and stable-employment percentage? A property-management company in the area should have these aggregated.
- How much new for-sale + rental construction is in the pipeline within 1–3 miles? Heavy new supply typically softens prices + rents 12–24 months out; constrained supply supports both.
Investment metrics
- 1% rule
- 1.15% ✓
- Cap rate
- 9.49%
- Cash-on-cash
- 11.41%
- DSCR
- 1.51
- GRM
- 7.2
CMA / ARV
- ARV (on-the-fly)
- $688,800
- Comps found
- 6
Show comp detail 6 sales within ~0.75 mi
| Address | Dist | Beds/Ba | Sqft | Sold | Price | $/sf | Match |
|---|---|---|---|---|---|---|---|
| 21299 Black Oak Dr | 0.58mi | 3/3.0 (-1) | 2,372 (-1%) | 3mo | $675,000 | $285 | 60 |
| 12210 Dogwood Dr | 0.69mi | 4/3.0 | 2,350 (-2%) | 1mo | $320,000 | $136 | 59 |
| 21418 Pine Dr | 0.52mi | 4/2.5 | 2,688 (+12%) | 5mo | $668,000 | $249 | 46 |
| 21393 Black Oak Dr | 0.61mi | 4/2.5 | 2,240 (-7%) | 13mo | $880,000 | $393 | 44 |
| 11435 Oak Leaf Cir | 0.44mi | 3/2.5 (-1) | 2,140 (-11%) | 22mo | $615,000 | $287 | 32 |
| 21283 NW Maple Dr | 0.67mi | 3/2.5 (-1) | 2,091 (-13%) | 6mo | $636,500 | $304 | 31 |
Match score weights: distance 35% · size 25% · config 20% · recency 20%. Top-matched comps best support the ARV.
Projected returns pro-forma
7.61% appreciation · 3.0% rent growth · sell at horizon
- IRR
- 28.1%
- Equity multiple
- 2.99×
- Total profit
- $249,864
- Equity at exit
- $329,197
- IRR
- 25.3%
- Equity multiple
- 6.31×
- Total profit
- $668,151
- Equity at exit
- $642,399
Cash invested: $125,720 (down + closing). Projections, not guarantees.
Landlord ↔ Tenant lean methodology
- Overall (STATE)
- 92 Strongly Landlord-Friendly
- State Arkansas
- 92 Strongly Landlord-Friendly · R+14
- County
- — inherits STATE
- City
- — inherits STATE
ZIP-level market 72732
- Home prices YoY
- 2.1%
- Active inventory
- 130
- Price-to-rent
- 7.2×
Monthly cashflow live
- Estimated rent
- $5,184 medium interval (Pro) →
- Mortgage (P&I)
- −$2,355
- Tax from tax record
- −$358 /mo · $4,296/yr
- Insurance
- −$187
- HOA
- −$0
- Vacancy / Maint / Mgmt
- −$1,089
- Net cashflow
- $1,196
Break-even live
Sensitivity live
| Price | -10% $1,450 | -5% $1,323 | +0% $1,196 | +5% $1,069 | +10% $942 |
|---|---|---|---|---|---|
| Rent | -10% $786 | -5% $991 | +0% $1,196 | +5% $1,400 | +10% $1,605 |
| Rate | -1.0pp $1,422 | -0.5pp $1,310 | base $1,196 | +0.5pp $1,079 | +1.0pp $961 |
UW: 25.0% down · 7.5% · 30yr · 1.5% tax · 5.0% vac · 8.0% maint · 8.0% mgmt
Financing live
Cash to close
- Down payment
- $112,250
- Closing costs
- $13,470
- Reserves months
- —
- Total cash needed
- —
Loan-product check · same deal, 3 products live
Conventional
25% down · 7.5% · 30yr
- Down + closing
- —
- Monthly P&I
- —
- Monthly cashflow
- —
- DSCR
- —
- Eligible?
- —
Personal DTI + credit; lowest rate.
DSCR
20% down · 8.5% · 30yr
- Down + closing
- —
- Monthly P&I
- —
- Monthly cashflow
- —
- DSCR
- —
- Eligible?
- —
No personal income docs; deal must DSCR.
Hard money
10% down · 12.0% · 12mo
- Down + closing
- —
- Monthly P&I
- —
- Monthly cashflow
- —
- DSCR
- —
- Eligible?
- —
Short-term bridge; refi at stabilization.
Rent comps 1 comps
| Address | Beds | Baths | Sqft | Rent | $/sqft | DOM | Units | Dist |
|---|---|---|---|---|---|---|---|---|
| 12310 Slate Gap Rd Unit 1221931P Garfield, AR | 4.0 | 2.5 | 2798 | $5,184 | $1.85 | 14d | 1 | 0.88mi |
Listing history 26 events
-
2026-06-21days on market $449,000 Active 100 DOM
-
2026-06-18days on market $449,000 Active 97 DOM
-
2026-06-17days on market $449,000 Active 96 DOM
-
2026-06-16days on market $449,000 Active 95 DOM
-
2026-06-15days on market $449,000 Active 94 DOM
-
2026-06-14days on market $449,000 Active 92 DOM
-
2026-06-13days on market $449,000 Active 91 DOM
-
2026-06-10days on market $449,000 Active 89 DOM
-
2026-06-09days on market $449,000 Active 88 DOM
-
2026-06-08days on market $449,000 Active 87 DOM
-
2026-06-07days on market $449,000 Active 86 DOM
-
2026-06-05pricedays on market $449,000 Active 83 DOM
-
2026-06-03days on market $475,000 Active 82 DOM
-
2026-06-02days on market $475,000 Active 81 DOM
-
2026-06-01days on market $475,000 Active 80 DOM
-
2026-05-31days on market $475,000 Active 79 DOM
-
2026-05-31days on market $475,000 Active 78 DOM
-
2026-03-13$475,000 Active
-
2025-05-27price $495,000
-
2025-05-01price $525,000
-
2024-11-25price $549,000
-
2024-09-04price $599,000
-
2023-08-30soldstatus $290,000 Closed
-
2023-08-03status Pending
-
2023-08-01$300,000 Active
-
1999-03-17soldstatus $84,000
ⓘ Source: listings_history table (triggers on properties + properties_extension) + one-shot
backfill from property_details.listing_events for pre-trigger history.
Tax reassessment forecast AR · Resets to sale price
- Current annual tax
- $4,296 · $358/mo
- Projected year-2 tax
- $4,296 · $358/mo
- Expected delta
- $0/yr ($0/mo · 0.0%)
ⓘ Screening estimate from a state-policy table — verify with the county assessor before closing.
Climate risk First Street
- Flood 1/10 Low FEMA zone X (unshaded) · 0% chance over 30 yrs
- Wildfire 1/10 Low
- Heat 4/10 Moderate 7 d/yr ≥105°F today · 21 d/yr by 30 yrs out
- Wind 2/10 Low 2% chance of damaging wind over 30 yrs
- Air quality 1/10 Low 0 unhealthy d/yr today · 0 by 30 yrs out
Nearby sold comps map
Loading sold comps map…
Walkable amenities ~0.75 mi
Loading nearby amenities…
Taxation est. · year 1
- Rental income
- $62,208
- − Mortgage interest
- −$25,151
- − Property taxes
- −$4,296
- − Insurance
- −$2,245
- − Repairs & maintenance
- −$4,977
- − Management
- −$4,977
- − Depreciation
- −$13,062
- Taxable income
- $7,501
- Est. tax owed @ 24.0%
- −$1,800
- After-tax cash flow
- $12,548/yr
For passive investors: Depreciation is non-cash, so a rental often shows a tax loss while cash-flowing — sheltering income. Rental losses are passive: they offset passive income freely, and up to $25,000/yr can offset ordinary (W-2) income if you actively participate and your MAGI is under $100k (phasing out to $0 by $150k); unused losses carry forward. On sale, claimed depreciation is recaptured at up to 25%, and gains may owe capital-gains tax (a 1031 exchange can defer both). Figures are a year-1 estimate at your 24.0% rate — not tax advice; consult a CPA.
Schools (NCES district)
- District
- Rogers School District
- NCES district ID
- 0511970
- Math proficiency
- 45% ▼ -9.00%
- Reading proficiency
- 45% ▼ -9.00%
- Median HH income
- $51,712
- Composite
- 38.81/100
- National rank
- #4113
- State rank
- #31 of 238 in AR
Livability — Lost Bridge Village
- Score
- 57/100
- State rank
- #348
- US rank
- #21912
Category grades
Schools grade is shown separately in the Schools card above.
Census & demographics
- Census place
- Lost Bridge Village, AR
- Population (ZIP)
- 5,493
Population outlook (Benton County) Hauer SSP2
- Today (2025)
- 318,683 people
- By 2030
- 353,481 · +10.9%
- By 2040
- 425,280 · +33.4%
- By 2050
- 497,239 · +56.0%
- By 2075
- 662,114 · +107.8%
- By 2100
- 776,431 · +143.6%
Race, ethnicity, and origin ACS 2023
- Neighborhood character
- Diverse neighborhood (Simpson 0.56)
- Race & ethnicity
- White 65% Two or more races 27% Hispanic / Latino 11% Native American 1%
- Hispanic origin (detail)
- Mexican 7%
- Common ancestry
- Italian 3% Danish 2% Lithuanian 1%
- Foreign-born
- 3% · Canada
- Languages at home
- 97% English-only · Spanish 3%
Political lean MEDSL · Benton
- 2024 margin
- Strong R (+27.0) · D 35.2% · R 62.1% · Other 2.7%
- 2008→2024 swing
- +9.6pp toward D · 2008: -36.5pp · 2024: -27.0pp
- All cycles
- 2024: R+27.0 2020: R+26.4 2016: R+34.9 2012: R+40.4 2008: R+36.5
Not yet ingested
- Civics
- —
Market trends
- HPI YoY
- ▲ 7.61%
- Current HPI
- 368.3932
- Rent YoY
- —
- Metro
- —
- State GDP YoY
- ▲ 3.80%
- F500 in state
- 10
Industry mix (Fortune 500 HQ in AR)
| Industry | F500 HQs | Revenue |
|---|---|---|
| Retail | 1 | $681B |
|
||
| Food / Agriculture | 1 | $53B |
|
||
| Retail / Energy | 1 | $22B |
|
||
| Transportation / Logistics | 1 | $12B |
|
||
| Energy | 1 | $4B |
|
||
Price history
+465.5% since first listed9 events — show timeline
- 2026-03-13 Listed $475,000 NWARMLS
- 2025-05-27 Price Changed $495,000 NWARMLS
- 2025-05-01 Price Changed $525,000 NWARMLS
- 2024-11-25 Price Changed $549,000 NWARMLS
- 2024-09-04 Price Changed $599,000 NWARMLS
- 2023-08-30 Sold (MLS) $290,000 NWARMLS
- 2023-08-03 Pending — NWARMLS
- 2023-08-01 Listed $300,000 NWARMLS
- 1999-03-17 Sold (Public Records) $84,000 Public Records
Property tax history
+9.7%/yrLatest (2025): $4,296 · +27.3% YoY. Source: county tax records.
Cash-flow waterfall
monthlySold comps — $/sqft
last 12 mo · ≤1 miLoading sold comps…