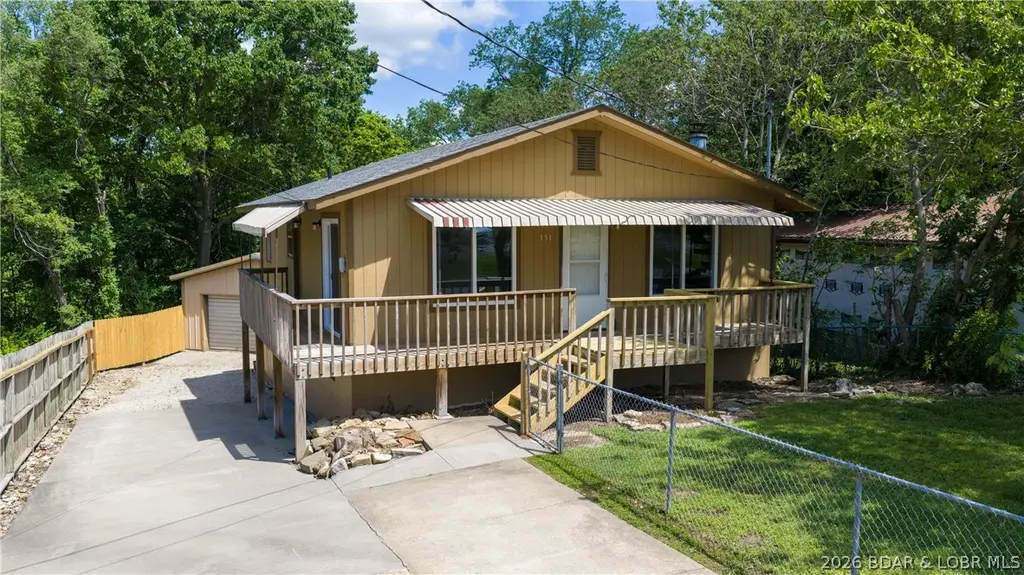
151 Illinois St NE · Camdenton, MO
Flood risk 1/10 · Minimal
- FEMA flood zone
- X (unshaded)
- Chance of flooding over 30 yrs
- 0.0%
- Est. flood insurance / yr
- $473 – $860
Fire risk 5/10 · Moderate
- Est. fire insurance / yr
- $1,054 – $1,958
Heat risk 4/10 · Minor
- Hot days now (above 108°F)
- 7 days/yr
- Hot days in 30 yrs
- 19 days/yr
Wind risk 2/10 · Minimal
- Chance of severe wind over 30 yrs
- 0.0%
Air-quality risk 2/10 · Minimal
- Unhealthy air days now
- 1 days/yr
- Unhealthy air days in 30 yrs
- 1 days/yr
Risk factors via First Street. Map © Google.
Why this score? — see what drove the D grade
The composite is a weighted blend of 9 inputs, each scored 0–100. Each bar is that input's sub-score; the figure is the points it added to the 100-point composite (weight × sub-score).
- ARV discount +15.0/15.0
- Cash flow +9.9/30.0
- Schools +4.0/10.0
- Livability +3.4/5.0
- DSCR +2.8/10.0
- Rent growth +2.5/5.0
- Condition / age +2.5/5.0
- 1% rule +1.6/10.0
- Appreciation +0.0/10.0
$279,900
🖨 Deal sheet (PDF) 📄 Offer letter ✓ Due diligence
Listing remarks
Completely remodeled and move-in ready, this in-town home offers the perfect blend of modern updates and everyday functionality. Featuring 4 bedrooms, 2 bathrooms, and 1,722 square feet of living space, the home has been thoughtfully updated throughout to provide a fresh, clean feel. An additional 386 square feet offers a blank canvas—ideal for a second living area, home office, gym, or whatever fits your needs. Enjoy the convenience of city water and sewer, plus a location within walking distance to Camdenton shopping, restaurants, and schools. Outside, a 24x24 detached shop provides excellent space for storage, hobbies, or a workshop setup. Whether you’re looking for extra roo
Key facts
- Move-in ready
- Remodeled
- Modern updates
Tags
Property features AI
Finance
- HOA & community: No community amenities listed
Exterior
- Parking: Detached garage with workshop; 2 garage spaces; Open parking; Concrete parking surfaces
- Utilities: Public water; Public sewer
- Home design: Single-family detached residence; Two stories; Updated/remodeled; Wood siding construction; Shingle roof
- Construction: Wood siding; Shingle roof; Built as a two-story home
- Exterior features: Covered deck; Workshop (separate structure)
Interior
- Kitchen: Cooktop; Dishwasher; Microwave; Range/oven; Refrigerator
- Bathrooms: 2 full bathrooms
- Heating & cooling: Heat pump heating; Electric heating; Central air conditioning
- Interior features: Unfurnished; Fireplace (1); Full basement
Neighborhood map
What this means for you Summary
Snapshot
- This is a 4-bed/2.0-bath other listed at $280k.
Deal economics
- At list price, monthly cash flow is $-175 ($-2k/yr) — negative.
- To cash-flow at today's rent, offer at most $249k (11.0% below list).
- To meet the 1% rule (rent ≥ 1% of price), the offer needs to be $185k (33.7% below list).
- Recommended offer: $185k (33.7% below list) — sets the bar for 1% rule.
- Cap rate 5.5% vs local median 1.7% in Camdenton — top-decile yield for the area; either an underpriced asset or a hidden risk that comps aren't pricing in. Stress-test before assuming the spread holds.
Location & tenants
- Location reads 68/100 on livability (#186 in MO) — a middle-class / working-renter tenant base. Strengths: cost of living A+, housing A+; Watch: employment D, schools D-, amenities F.
- Camdenton R-III (rural): math 46% / reading 48% proficiency, ranked #68 of 324 in MO (top 21%) — families likely to look elsewhere, expect single-tenant / working-renter base with shorter leases.
- Market conditions: 416 active listings in the ZIP; 272 units permitted in Camden County in 2024 (0 in 5+ unit buildings).
- This rent runs 36% of the median local income ($62k/yr) — at the standard rent-burdened threshold; future hikes will face affordability resistance.
Forward outlook
- Local home prices are declining (-3.0%/yr); year-one equity from $2k of loan paydown is wiped out by about $8k of value loss. Plan a longer hold.
- Camden County population projected to shrink 6% by 2050 — rents likely to lag national; underwrite the cash flow, not the appreciation.
Negotiation context
- It's been on market 51 days — a 3% lower offer ($272k) is reasonable based on typical stale-listing flexibility.
Risks & watch-outs
- Climate carrying-cost: moderate wildfire risk — expect insurance premiums to compound above CPI over the hold.
Questions for the listing agent
- What do current leases actually rent for vs. the listed asking? Can we see a recent rent roll and the last 12 months of T-12 income?
- It's been on market 51 days. Have you received any prior offers? Is the seller open to a 34% concession, seller financing, or rate buy-down credit?
- Is there a deadline driving the sale (1031 exchange, divorce, estate, relocation)? That informs how much negotiation room exists.
- Schools are D-rated, which usually means shorter tenancies and higher turnover. Who's the typical renter profile here, and what's been the actual vacancy rate?
- The area grade is low — what's the realistic commute time and amenity access for the typical tenant pool here? Any planned neighborhood developments (good or bad) we should know about?
- What's the average days-on-market for RENTAL listings here right now (not sales)? A rising rental-DOM trend means longer vacancies and softer asking-rent achievability than the comps imply.
- What's the recent tenant-quality profile in this submarket — average credit score on applications, eviction rate, late-payment / NSF rate, and stable-employment percentage? A property-management company in the area should have these aggregated.
- How much new for-sale + rental construction is in the pipeline within 1–3 miles? Heavy new supply typically softens prices + rents 12–24 months out; constrained supply supports both.
Investment metrics
- 1% rule
- 0.66% ✗
- Cap rate
- 5.54%
- Cash-on-cash
- -2.68%
- DSCR
- 0.88
- GRM
- 12.6
CMA / ARV
- ARV (median comp)
- $439,316
- List price
- $279,900
- Delta
- -36.29%
- Verdict
- UNDERPRICED
- Comps
- 2 within 1.0 mi
Projected returns pro-forma
-3.0% appreciation · 3.0% rent growth · sell at horizon
- IRR
- -20.8%
- Equity multiple
- 0.28×
- Total profit
- $-56,636
- Equity at exit
- $41,734
- IRR
- -14.3%
- Equity multiple
- 0.18×
- Total profit
- $-64,268
- Equity at exit
- $24,201
Cash invested: $78,372 (down + closing). Projections, not guarantees.
Landlord ↔ Tenant lean methodology
- Overall (STATE)
- 81 Strongly Landlord-Friendly
- State Missouri
- 81 Strongly Landlord-Friendly · R+10
- County
- — inherits STATE
- City
- — inherits STATE
ZIP-level market 65020
- Home prices YoY
- -32.9%
- Active inventory
- 416
- Price-to-rent
- 12.6×
Monthly cashflow live
- Estimated rent
- $1,854 medium interval (Pro) →
- Mortgage (P&I)
- −$1,468
- Tax from tax record
- −$55 /mo · $663/yr
- Insurance
- −$117
- HOA
- −$0
- Vacancy / Maint / Mgmt
- −$389
- Net cashflow
- $-175
Break-even live
Sensitivity live
| Price | -10% $-16 | -5% $-95 | +0% $-175 | +5% $-254 | +10% $-333 |
|---|---|---|---|---|---|
| Rent | -10% $-321 | -5% $-248 | +0% $-175 | +5% $-101 | +10% $-28 |
| Rate | -1.0pp $-34 | -0.5pp $-104 | base $-175 | +0.5pp $-247 | +1.0pp $-321 |
UW: 25.0% down · 7.5% · 30yr · 1.5% tax · 5.0% vac · 8.0% maint · 8.0% mgmt
Financing live
Cash to close
- Down payment
- $69,975
- Closing costs
- $8,397
- Reserves months
- —
- Total cash needed
- —
Loan-product check · same deal, 3 products live
Conventional
25% down · 7.5% · 30yr
- Down + closing
- —
- Monthly P&I
- —
- Monthly cashflow
- —
- DSCR
- —
- Eligible?
- —
Personal DTI + credit; lowest rate.
DSCR
20% down · 8.5% · 30yr
- Down + closing
- —
- Monthly P&I
- —
- Monthly cashflow
- —
- DSCR
- —
- Eligible?
- —
No personal income docs; deal must DSCR.
Hard money
10% down · 12.0% · 12mo
- Down + closing
- —
- Monthly P&I
- —
- Monthly cashflow
- —
- DSCR
- —
- Eligible?
- —
Short-term bridge; refi at stabilization.
Listing history 19 events
-
2026-06-21days on market $279,900 Active 51 DOM
-
2026-06-19days on market $279,900 Active 49 DOM
-
2026-06-18days on market $279,900 Active 48 DOM
-
2026-06-17days on market $279,900 Active 47 DOM
-
2026-06-16days on market $279,900 Active 46 DOM
-
2026-06-15days on market $279,900 Active 45 DOM
-
2026-06-14days on market $279,900 Active 43 DOM
-
2026-06-12days on market $279,900 Active 42 DOM
-
2026-06-09days on market $279,900 Active 39 DOM
-
2026-06-08days on market $279,900 Active 38 DOM
-
2026-06-07days on market $279,900 Active 37 DOM
-
2026-06-05days on market $279,900 Active 34 DOM
-
2026-06-03days on market $279,900 Active 33 DOM
-
2026-06-02days on market $279,900 Active 32 DOM
-
2026-06-01days on market $279,900 Active 31 DOM
-
2026-05-31days on market $279,900 Active 30 DOM
-
2026-05-30days on market $279,900 Active 29 DOM
-
2026-05-01$279,900 Active 780-char remark
-
1989-05-01soldstatus
ⓘ Source: listings_history table (triggers on properties + properties_extension) + one-shot
backfill from property_details.listing_events for pre-trigger history.
Tax reassessment forecast MO · Resets to sale price
- Current annual tax
- $663 · $55/mo
- Projected year-2 tax
- $2,715 · $226/mo
- Expected delta
- +$2,052/yr (+$171/mo · 309.5%)
ⓘ Screening estimate from a state-policy table — verify with the county assessor before closing.
Climate risk First Street
- Flood 1/10 Low FEMA zone X (unshaded) · 0% chance over 30 yrs
- Wildfire 5/10 Major
- Heat 4/10 Moderate 7 d/yr ≥108°F today · 19 d/yr by 30 yrs out
- Wind 2/10 Low 0% chance of damaging wind over 30 yrs
- Air quality 2/10 Low 1 unhealthy d/yr today · 1 by 30 yrs out
Nearby sold comps map
Loading sold comps map…
Walkable amenities ~0.75 mi
Loading nearby amenities…
Taxation est. · year 1
- Rental income
- $22,253
- − Mortgage interest
- −$15,679
- − Property taxes
- −$663
- − Insurance
- −$1,400
- − Repairs & maintenance
- −$1,780
- − Management
- −$1,780
- − Depreciation
- −$8,143
- Taxable loss
- −$7,191
- Est. tax savings @ 24.0%
- +$1,726
- After-tax cash flow
- $-371/yr
For passive investors: Depreciation is non-cash, so a rental often shows a tax loss while cash-flowing — sheltering income. Rental losses are passive: they offset passive income freely, and up to $25,000/yr can offset ordinary (W-2) income if you actively participate and your MAGI is under $100k (phasing out to $0 by $150k); unused losses carry forward. On sale, claimed depreciation is recaptured at up to 25%, and gains may owe capital-gains tax (a 1031 exchange can defer both). Figures are a year-1 estimate at your 24.0% rate — not tax advice; consult a CPA.
Schools (NCES district)
- District
- Camdenton R-III
- NCES district ID
- 2906990
- Math proficiency
- 46% ▲ 10.00%
- Reading proficiency
- 48% ▲ 1.00%
- Median HH income
- $46,496
- Composite
- 39.96/100
- National rank
- #3838
- State rank
- #68 of 324 in MO
Livability — Camdenton
- Score
- 68/100
- State rank
- #186
- US rank
- #9869
Category grades
Schools grade is shown separately in the Schools card above.
Census & demographics
- Census place
- Camdenton, MO
- County
- Camden County · 21,945 people
- City population
- 14,748
- Metro
- nan
- Population (ZIP)
- 14,748
- Household income
- $62,392
- Rent vs Own
- Severe rent burden
- 166.0
Population outlook (Camden County) Hauer SSP2
- Today (2025)
- 44,585 people
- By 2030
- 44,476 · -0.2%
- By 2040
- 43,513 · -2.4%
- By 2050
- 41,705 · -6.5%
- By 2075
- 36,903 · -17.2%
- By 2100
- 30,164 · -32.3%
Race, ethnicity, and origin ACS 2023
- Neighborhood character
- Predominantly White (90%)
- Race & ethnicity
- White 90% Hispanic / Latino 5% Two or more races 4%
- Hispanic origin (detail)
- Mexican 3%
- Common ancestry
- Lithuanian 4% Slovak 2% Romanian 2%
- Foreign-born
- 2% · Canada
- Languages at home
- 95% English-only · Spanish 2% German/W. Germanic 1% Russian/Polish/Slavic 1%
Political lean MEDSL · Camden
- 2024 margin
- Solid R (+54.3) · D 22.4% · R 76.7%
- 2008→2024 swing
- -25.8pp toward R · 2008: -28.5pp · 2024: -54.3pp
- All cycles
- 2024: R+54.3 2020: R+53.2 2016: R+54.2 2012: R+39.3 2008: R+28.5
Not yet ingested
- Civics
- —
Market trends
- HPI YoY
- ▼ -90.71%
- Current HPI
- 185.4254
- Rent YoY
- —
- Metro
- nan
- State GDP YoY
- ▲ 1.84%
- F500 in state
- 20
Industry mix (Fortune 500 HQ in MO)
| Industry | F500 HQs | Revenue |
|---|---|---|
| Healthcare | 1 | $163B |
|
||
| Insurance | 1 | $21B |
|
||
| Industrial Technology | 1 | $17B |
|
||
| Retail | 1 | $16B |
|
||
| Industrial Distribution | 1 | $10B |
|
||
| Utilities | 1 | $9B |
|
||
Price history
2 events — show timeline
- 2026-05-01 Listed $279,900 LOBR
- 1989-05-01 Sold (Public Records) — Public Records
Property tax history
+0.7%/yrLatest (2025): $663 · +0.0% YoY. Source: county tax records.
Cash-flow waterfall
monthlySold comps — $/sqft
last 12 mo · ≤1 miLoading sold comps…