 Duplex
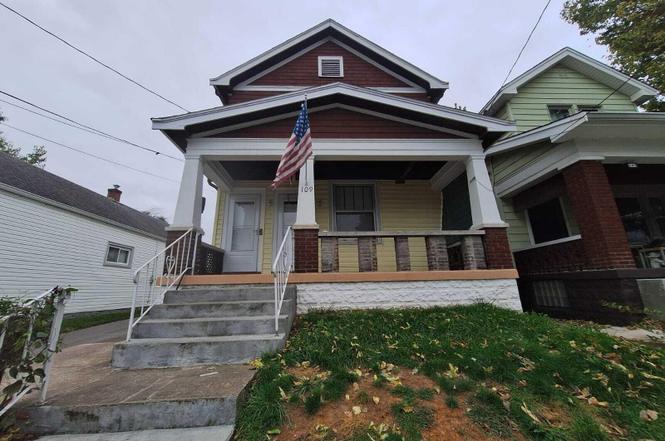
109 Daniels St · Covington, KY
Flood risk 1/10 · Minimal
- FEMA flood zone
- X (unshaded)
- Chance of flooding over 30 yrs
- 0.0%
- Est. flood insurance / yr
- $507 – $1,088
Fire risk 1/10 · Minimal
- Est. fire insurance / yr
- $839 – $1,559
Heat risk 5/10 · Moderate
- Hot days now (above 102°F)
- 7 days/yr
- Hot days in 30 yrs
- 20 days/yr
Wind risk 2/10 · Minimal
- Chance of severe wind over 30 yrs
- 1.0%
Air-quality risk 3/10 · Minor
- Unhealthy air days now
- 2 days/yr
- Unhealthy air days in 30 yrs
- 3 days/yr
Risk factors via First Street. Map © Google.
Why this score? — see what drove the C- grade
The composite is a weighted blend of 9 inputs, each scored 0–100. Each bar is that input's sub-score; the figure is the points it added to the 100-point composite (weight × sub-score).
- Cash flow +26.6/30.0
- DSCR +9.1/10.0
- 1% rule +6.4/10.0
- Livability +4.3/5.0
- Rent growth +2.5/5.0
- Condition / age +2.5/5.0
- Schools +1.5/10.0
- ARV discount +0.0/15.0
- Appreciation +0.0/10.0
$244,999
🖨 Deal sheet (PDF) 📄 Offer letter ✓ Due diligence
Multi-family units
County records classify this as Multi-Family (2-4 Unit). Listing-text estimate: 2 units. confirmed
Listing remarks MLS
Very Nice Duplex!updated-newer Vinyl Floors,Cabinets,Carpet.4 Rooms Each W/Full Bath.Currently Ren As Two 2 Br Units For $400 Each.Easy To Rent.Very Large Full Basement W/Laundry Area.2 Stoves/2 Refrigerators
Key facts
- Cash flow potential
- Two units
- Rental income
Tags
Property features AI
Finance
- Financial info: 2 total units
Exterior
- Parking: Off-street parking
- Utilities: Public water; Public sewer; Natural gas available
- Home design: Multi-family property; Two levels
- Construction: Built in 1945; Vinyl and wood siding; Shingle roof; Block foundation; Double-hung windows with wood frames
- Exterior features: Irregular lot; 0.06 acre lot
Interior
- Kitchen: Electric range; Refrigerator
- Bathrooms: 1 full bathroom
- Heating & cooling: Forced air heating; Window air conditioning
- Interior features: Fireplace; Full basement
Neighborhood map
What this means for you Summary
Snapshot
- This is a 2 × 3-bed/1.0-bath units multifamily listed at $245k.
Deal economics
- At list price, monthly cash flow is $657 ($8k/yr) — positive. Per door: $328/mo.
- The deal already cash-flows at list — no discount required.
- Meets the 1% rule at list price ($3k rent vs $245k).
- Recommended offer: $230k (6.0% below list) — sets the bar for market timing.
- Cap rate 9.5% vs local median 5.3% in Covington — top-decile yield for the area; either an underpriced asset or a hidden risk that comps aren't pricing in. Stress-test before assuming the spread holds.
Location & tenants
- Location reads 86/100 on livability (#40 in KY, #376 nationally) — a professional / high-income tenant draw. Strengths: amenities A+, commute A+, cost of living A+; Watch: employment D+.
- Covington Independent (suburban): math 10% / reading 27% proficiency, ranked #162 of 165 in KY (top 98%) — low school quality limits family demand, transient renter base, plan for 1-2y turnover; 78% free/reduced lunch — lower-income household profile, screen leases tightly.
- Zoned schools: Latonia Elementary School (math 12% / reading 32%, grade F, #525 of 676 statewide, top 82%, 285 students, 87% FRL); Holmes Middle School (math 8% / reading 26%, grade F, #211 of 217 statewide, top 97%, 656 students, 84% FRL); Holmes High School (math 12% / reading 17%, grade F, #227 of 254 statewide, top 89%, 878 students, 80% FRL).
- Market conditions: 161 active listings in the ZIP; 699 units permitted in Kenton County in 2024 (287 in 5+ unit buildings).
Forward outlook
- Local home prices are declining (-3.0%/yr); year-one equity from $2k of loan paydown is wiped out by about $7k of value loss. Plan a longer hold.
- Kenton County population projected at +5% by 2050 — modest demand growth; plan on rents tracking national, not racing it.
- At projected returns (-3.0% appreciation + 3.0% rent growth), your $69k cash investment doubles in ~10 years — after that, you're playing with house money.
Negotiation context
- It's been on market 81 days — a 6% lower offer ($230k) is reasonable based on typical stale-listing flexibility.
- 3 sale attempts since 27y ago; this cycle's ask has dropped $15k (6%) from the opening price — seller is motivated, your offer sets the floor, not the list.
- Current owner paid $67k; list at $245k implies a 267% gain — meaningful room to come down on a strong offer.
Risks & watch-outs
- Watch-outs: built in 1945 — expect roof / HVAC / electrical / plumbing capex.
- Climate carrying-cost: extreme-heat days projected 7→20/yr by 2055 (HVAC capex compounding) — expect insurance premiums to compound above CPI over the hold.
Questions for the listing agent
- It's been on market 81 days. Have you received any prior offers? Is the seller open to a 6% concession, seller financing, or rate buy-down credit?
- Can we see the unit-by-unit rent roll, current vacancy, and any below-market leases? What's the average tenancy length?
- What capital expenditures (roof, boiler, parking lot, exteriors) have been made in the last 5 years, and what's planned in the next 2?
- Built in 1945 — when were the roof, HVAC, electrical panel, plumbing, and water heater last replaced?
- Why hasn't it sold? Are there any deal-killer items the seller is aware of (foundation, flood, title, zoning, code violations)?
- Is there a deadline driving the sale (1031 exchange, divorce, estate, relocation)? That informs how much negotiation room exists.
- What's the average days-on-market for RENTAL listings here right now (not sales)? A rising rental-DOM trend means longer vacancies and softer asking-rent achievability than the comps imply.
- What's the recent tenant-quality profile in this submarket — average credit score on applications, eviction rate, late-payment / NSF rate, and stable-employment percentage? A property-management company in the area should have these aggregated.
- How much new apartment / multifamily construction is in the pipeline within 1–3 miles? Heavy new supply (>2% of stock underway) typically softens rents 12–24 months out; light construction supports rent growth.
Investment metrics
- 1% rule
- 1.14% ✓
- Cap rate
- 9.51%
- Cash-on-cash
- 11.49%
- DSCR
- 1.51
- GRM
- 7.3
CMA / ARV
- ARV (on-the-fly)
- $165,432
- Comps found
- 1
Show comp detail 1 sale within ~0.75 mi
| Address | Dist | Beds/Ba | Sqft | Sold | Price | $/sf | Match |
|---|---|---|---|---|---|---|---|
| 708-710 W 35th St | 0.66mi | 5/2.0 (-1) | 1,278 (-13%) | 20mo | $144,250 | $113 | 27 |
Match score weights: distance 35% · size 25% · config 20% · recency 20%. Top-matched comps best support the ARV.
Projected returns pro-forma
-3.0% appreciation · 3.0% rent growth · sell at horizon
- IRR
- 0.8%
- Equity multiple
- 1.03×
- Total profit
- $2,074
- Equity at exit
- $36,530
- IRR
- 10.4%
- Equity multiple
- 1.81×
- Total profit
- $55,466
- Equity at exit
- $21,183
Cash invested: $68,600 (down + closing). Projections, not guarantees.
Landlord ↔ Tenant lean methodology
- Overall (STATE)
- 83 Strongly Landlord-Friendly
- State Kentucky
- 83 Strongly Landlord-Friendly · R+16
- County
- — inherits STATE
- City
- — inherits STATE
ZIP-level market 41015
- Active inventory
- 161
- Price-to-rent
- 14.6×
Monthly cashflow live
- Estimated rent
- $2,790 medium interval (Pro) →
- Mortgage (P&I)
- −$1,285
- Tax from tax record
- −$161 /mo · $1,927/yr
- Insurance
- −$102
- HOA
- −$0
- Vacancy / Maint / Mgmt
- −$586
- Net cashflow
- $657
Break-even live
Sensitivity live
| Price | -10% $795 | -5% $726 | +0% $657 | +5% $587 | +10% $518 |
|---|---|---|---|---|---|
| Rent | -10% $436 | -5% $546 | +0% $657 | +5% $767 | +10% $877 |
| Rate | -1.0pp $780 | -0.5pp $719 | base $657 | +0.5pp $593 | +1.0pp $529 |
2-unit breakdown (identical units grouped — click to expand)
| Units | Beds | Baths | Est. rent |
|---|---|---|---|
| 2× units | 3 | 1 | $2,790 |
| #1 | 3 | 1 | $1,395 |
| #2 | 3 | 1 | $1,395 |
| Total (2 units) | $2,790 | ||
UW: 25.0% down · 7.5% · 30yr · 1.5% tax · 5.0% vac · 8.0% maint · 8.0% mgmt
Financing live
Cash to close
- Down payment
- $61,250
- Closing costs
- $7,350
- Reserves months
- —
- Total cash needed
- —
Loan-product check · same deal, 3 products live
Conventional
25% down · 7.5% · 30yr
- Down + closing
- —
- Monthly P&I
- —
- Monthly cashflow
- —
- DSCR
- —
- Eligible?
- —
Personal DTI + credit; lowest rate.
DSCR
20% down · 8.5% · 30yr
- Down + closing
- —
- Monthly P&I
- —
- Monthly cashflow
- —
- DSCR
- —
- Eligible?
- —
No personal income docs; deal must DSCR.
Hard money
10% down · 12.0% · 12mo
- Down + closing
- —
- Monthly P&I
- —
- Monthly cashflow
- —
- DSCR
- —
- Eligible?
- —
Short-term bridge; refi at stabilization.
Listing history 9 events
-
2026-05-23status Pending
-
2026-04-09status Active
-
2026-03-26status Pending
-
2026-03-11price $244,999
-
2026-02-16$259,999 Active
-
2000-01-11soldstatus $66,700
-
2000-01-07soldstatus $66,700 208-char remark
Show marketing remark (208 chars)
Very Nice Duplex!updated-newer Vinyl Floors,Cabinets,Carpet.4 Rooms Each W/Full Bath.Currently Ren As Two 2 Br Units For $400 Each.Easy To Rent.Very Large Full Basement W/Laundry Area.2 Stoves/2 Refrigerators
-
1999-11-09$69,900 208-char remark
Show marketing remark (208 chars)
Very Nice Duplex!updated-newer Vinyl Floors,Cabinets,Carpet.4 Rooms Each W/Full Bath.Currently Ren As Two 2 Br Units For $400 Each.Easy To Rent.Very Large Full Basement W/Laundry Area.2 Stoves/2 Refrigerators
-
1995-08-21soldstatus $47,000
ⓘ Source: listings_history table (triggers on properties + properties_extension) + one-shot
backfill from property_details.listing_events for pre-trigger history.
Tax reassessment forecast KY · Resets to sale price
- Current annual tax
- $1,927 · $161/mo
- Projected year-2 tax
- $2,107 · $176/mo
- Expected delta
- +$180/yr (+$15/mo · 9.3%)
ⓘ Screening estimate from a state-policy table — verify with the county assessor before closing.
Climate risk First Street
- Flood 1/10 Low FEMA zone X (unshaded) · 0% chance over 30 yrs
- Wildfire 1/10 Low
- Heat 5/10 Major 7 d/yr ≥102°F today · 20 d/yr by 30 yrs out
- Wind 2/10 Low 100% chance of damaging wind over 30 yrs
- Air quality 3/10 Moderate 2 unhealthy d/yr today · 3 by 30 yrs out
Nearby sold comps map
Loading sold comps map…
Walkable amenities ~0.75 mi
Loading nearby amenities…
Taxation est. · year 1
- Rental income
- $33,480
- − Mortgage interest
- −$13,724
- − Property taxes
- −$1,927
- − Insurance
- −$1,225
- − Repairs & maintenance
- −$2,678
- − Management
- −$2,678
- − Depreciation
- −$7,127
- Taxable income
- $4,120
- Est. tax owed @ 24.0%
- −$989
- After-tax cash flow
- $6,891/yr
For passive investors: Depreciation is non-cash, so a rental often shows a tax loss while cash-flowing — sheltering income. Rental losses are passive: they offset passive income freely, and up to $25,000/yr can offset ordinary (W-2) income if you actively participate and your MAGI is under $100k (phasing out to $0 by $150k); unused losses carry forward. On sale, claimed depreciation is recaptured at up to 25%, and gains may owe capital-gains tax (a 1031 exchange can defer both). Figures are a year-1 estimate at your 24.0% rate — not tax advice; consult a CPA.
Schools (NCES district)
- District
- Covington Independent
- NCES district ID
- 2101350
- Math proficiency
- 10% ▼ -20.00%
- Reading proficiency
- 27% ▼ -14.00%
- Median HH income
- $33,681
- Composite
- 15.04/100
- National rank
- #9353
- State rank
- #162 of 165 in KY
Livability — Covington
- Score
- 86/100
- State rank
- #40
- US rank
- #376
Category grades
Schools grade is shown separately in the Schools card above.
Census & demographics
- Census place
- Covington, KY
- City population
- 34,373
- Population (ZIP)
- 20,396
Population outlook (Kenton County) Hauer SSP2
- Today (2025)
- 174,205 people
- By 2030
- 177,897 · +2.1%
- By 2040
- 182,671 · +4.9%
- By 2050
- 183,543 · +5.4%
- By 2075
- 178,977 · +2.7%
- By 2100
- 159,920 · -8.2%
Race, ethnicity, and origin ACS 2023
- Neighborhood character
- Predominantly White (90%)
- Race & ethnicity
- White 90% Two or more races 6% Black 3% Hispanic / Latino 2%
- Common ancestry
- Lithuanian 2% Romanian 2% Slovak 2%
- Foreign-born
- 2% · Canada
- Languages at home
- 97% English-only · Arabic 1% French/Haitian/Cajun 1%
Political lean MEDSL · Kenton
- 2024 margin
- Strong R (+21.7) · D 38.2% · R 59.9% · Other 1.9%
- 2008→2024 swing
- -0.9pp no change · 2008: -20.9pp · 2024: -21.7pp
- All cycles
- 2024: R+21.7 2020: R+19.3 2016: R+26.1 2012: R+24.3 2008: R+20.9
Not yet ingested
- Civics
- —
Market trends
- HPI YoY
- ▼ -110.37%
- Current HPI
- 203.7263
- Rent YoY
- —
- Metro
- —
- State GDP YoY
- ▲ 1.81%
- F500 in state
- 4
Industry mix (Fortune 500 HQ in KY)
| Industry | F500 HQs | Revenue |
|---|---|---|
| Healthcare | 1 | $118B |
|
||
| Food / Beverage | 1 | $7B |
|
||
Price history
+421.3% since first listed9 events — show timeline
- 2026-05-23 Pending — NKMLS
- 2026-04-09 Relisted — NKMLS
- 2026-03-26 Pending — NKMLS
- 2026-03-11 Price Changed $244,999 NKMLS
- 2026-02-16 Listed $259,999 NKMLS
- 2000-01-11 Sold (Public Records) $66,700 Public Records
- 2000-01-07 Sold (MLS) $66,700 NKMLS
- 1999-11-09 Listed $69,900 NKMLS
- 1995-08-21 Sold (Public Records) $47,000 Public Records
Property tax history
+14.4%/yrLatest (2025): $1,927 · +0.7% YoY. Source: county tax records.
Cash-flow waterfall
monthlySold comps — $/sqft
last 12 mo · ≤1 miLoading sold comps…