808 N Garfield Ave · Rotan, TX
Flood risk 1/10 · Minimal
- FEMA flood zone
- —
- Chance of flooding over 30 yrs
- 0.0%
- Est. flood insurance / yr
- —
Fire risk 5/10 · Moderate
- Est. fire insurance / yr
- $1,222 – $2,270
Heat risk 7/10 · Major
- Hot days now (above 106°F)
- 5 days/yr
- Hot days in 30 yrs
- 16 days/yr
Wind risk 3/10 · Minor
- Chance of severe wind over 30 yrs
- 6.0%
Air-quality risk 2/10 · Minimal
- Unhealthy air days now
- 2 days/yr
- Unhealthy air days in 30 yrs
- 2 days/yr
Risk factors via First Street. Map © Google.
Why this score? — see what drove the D+ grade
The composite is a weighted blend of 9 inputs, each scored 0–100. Each bar is that input's sub-score; the figure is the points it added to the 100-point composite (weight × sub-score).
- Cash flow +15.0/30.0
- ARV discount +7.5/15.0
- 1% rule +5.0/10.0
- DSCR +5.0/10.0
- Schools +4.4/10.0
- Appreciation +4.3/10.0
- Livability +3.0/5.0
- Rent growth +2.5/5.0
- Condition / age +2.5/5.0
$14,900
🖨 Deal sheet 📄 Offer letter ✓ Due diligence
Listing remarks MLS
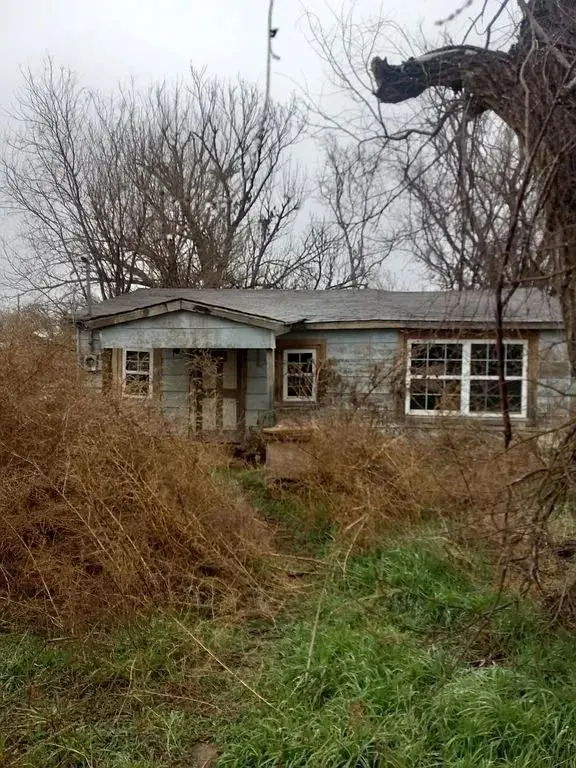
Gem in the rough. Handyman special. Extremely reasonable price for this fixer upper. Bring your decorating ideas now. Convenient in town location. Just a short distance to shopping and amenities. This property offers tremendous upside potential for the right buyer. Only seller time constraints makes this property available.
Key facts
- In town location
- 7,013 sq ft lot
- Built 1950
Tags
Neighborhood map
What this means for you Summary
Snapshot
- This is a 2-bed/1.0-bath single-family listed at $15k.
Deal economics
- At list price, monthly cash flow is $555 ($7k/yr) — positive.
- The deal already cash-flows at list — no discount required.
- Meets the 1% rule at list price ($821 rent vs $15k).
- Recommended offer: $14k (6.0% below list) — sets the bar for market timing.
Location & tenants
- Location reads 59/100 on livability (#1,123 in TX) — a working-class tenant base; expect higher turnover. Strengths: cost of living A+, crime A-, housing A-; Watch: health & safety C-, schools D+, employment D.
- Rotan ISD (rural): math 50% / reading 50% proficiency, ranked #405 of 1,141 in TX (top 36%) — acceptable for families but not a draw, mixed tenant base, ~2y average lease.
- Market conditions: 17 active listings in the ZIP.
Forward outlook
- Local home prices are declining (-1.4%/yr); year-one equity from $103 of loan paydown is wiped out by about $213 of value loss. Plan a longer hold.
- Fisher County population projected to shrink 7% by 2050 — rents likely to lag national; underwrite the cash flow, not the appreciation.
- At projected returns (-1.4% appreciation + 3.0% rent growth), your $4k cash investment doubles in ~1 year — after that, you're playing with house money.
Negotiation context
- It's been on market 85 days — a 6% lower offer ($14k) is reasonable based on typical stale-listing flexibility.
Risks & watch-outs
- Watch-outs: built in 1950 — expect roof / HVAC / electrical / plumbing capex.
- Climate carrying-cost: moderate wildfire risk; extreme-heat days projected 5→16/yr by 2055 (HVAC capex compounding) — expect insurance premiums to compound above CPI over the hold.
Questions for the listing agent
- It's been on market 85 days. Have you received any prior offers? Is the seller open to a 6% concession, seller financing, or rate buy-down credit?
- Built in 1950 — when were the roof, HVAC, electrical panel, plumbing, and water heater last replaced?
- Why hasn't it sold? Are there any deal-killer items the seller is aware of (foundation, flood, title, zoning, code violations)?
- Is there a deadline driving the sale (1031 exchange, divorce, estate, relocation)? That informs how much negotiation room exists.
- Schools are D-rated, which usually means shorter tenancies and higher turnover. Who's the typical renter profile here, and what's been the actual vacancy rate?
- The area grade is low — what's the realistic commute time and amenity access for the typical tenant pool here? Any planned neighborhood developments (good or bad) we should know about?
- What's the average days-on-market for RENTAL listings here right now (not sales)? A rising rental-DOM trend means longer vacancies and softer asking-rent achievability than the comps imply.
- What's the recent tenant-quality profile in this submarket — average credit score on applications, eviction rate, late-payment / NSF rate, and stable-employment percentage? A property-management company in the area should have these aggregated.
- How much new for-sale + rental construction is in the pipeline within 1–3 miles? Heavy new supply typically softens prices + rents 12–24 months out; constrained supply supports both.
Investment metrics
- 1% rule
- 5.51% ✓
- Cap rate
- 50.98%
- Cash-on-cash
- 159.60%
- DSCR
- 8.10
- GRM
- 1.5
CMA / ARV
No comps found within radius.
Projected returns pro-forma
-1.43% appreciation · 3.0% rent growth · sell at horizon
- IRR
- —
- Equity multiple
- 9.13×
- Total profit
- $33,938
- Equity at exit
- $3,291
- IRR
- —
- Equity multiple
- 19.22×
- Total profit
- $76,011
- Equity at exit
- $3,201
Cash invested: $4,172 (down + closing). Projections, not guarantees.
Landlord ↔ Tenant lean methodology
- Overall (STATE)
- 87 Strongly Landlord-Friendly
- State Texas
- 87 Strongly Landlord-Friendly · R+5
- County
- — inherits STATE
- City
- — inherits STATE
ZIP-level market 79546
- Home prices YoY
- -1.8%
- Active inventory
- 17
- Price-to-rent
- 1.5×
Monthly cashflow live
- Estimated rent
- $821 medium interval (Pro) →
- Mortgage (P&I)
- −$78
- Tax from tax record
- −$10 /mo · $116/yr
- Insurance
- −$6
- HOA
- −$0
- Vacancy / Maint / Mgmt
- −$172
- Net cashflow
- $555
Break-even live
UW: 25.0% down · 7.5% · 30yr · 1.5% tax · 5.0% vac · 8.0% maint · 8.0% mgmt
Financing live
Cash to close
- Down payment
- $3,725
- Closing costs
- $447
- Reserves months
- —
- Total cash needed
- —
Loan-product check · same deal, 3 products live
Conventional
25% down · 7.5% · 30yr
- Down + closing
- —
- Monthly P&I
- —
- Monthly cashflow
- —
- DSCR
- —
- Eligible?
- —
Personal DTI + credit; lowest rate.
DSCR
20% down · 8.5% · 30yr
- Down + closing
- —
- Monthly P&I
- —
- Monthly cashflow
- —
- DSCR
- —
- Eligible?
- —
No personal income docs; deal must DSCR.
Hard money
10% down · 12.0% · 12mo
- Down + closing
- —
- Monthly P&I
- —
- Monthly cashflow
- —
- DSCR
- —
- Eligible?
- —
Short-term bridge; refi at stabilization.
Listing history 16 events
-
2026-06-18days on market $14,900 Active 85 DOM
-
2026-06-17days on market $14,900 Active 84 DOM
-
2026-06-16days on market $14,900 Active 83 DOM
-
2026-06-15days on market $14,900 Active 82 DOM
-
2026-06-15days on market $14,900 Active 81 DOM
-
2026-06-13days on market $14,900 Active 80 DOM
-
2026-06-12days on market $14,900 Active 79 DOM
-
2026-06-09days on market $14,900 Active 76 DOM
-
2026-06-08days on market $14,900 Active 75 DOM
-
2026-06-08days on market $14,900 Active 74 DOM
-
2026-06-05days on market $14,900 Active 72 DOM
-
2026-06-03days on market $14,900 Active 70 DOM
-
2026-06-02days on market $14,900 Active 69 DOM
-
2026-06-01days on market $14,900 Active 68 DOM
-
2026-05-31days on market $14,900 Active 67 DOM
-
2026-03-25$14,900 Active 325-char remark
Show marketing remark (325 chars)
Gem in the rough. Handyman special. Extremely reasonable price for this fixer upper. Bring your decorating ideas now. Convenient in town location. Just a short distance to shopping and amenities. This property offers tremendous upside potential for the right buyer. Only seller time constraints makes this property available.
ⓘ Source: listings_history table (triggers on properties + properties_extension) + one-shot
backfill from property_details.listing_events for pre-trigger history.
Tax reassessment forecast TX · Resets to sale price
- Current annual tax
- $116 · $10/mo
- Projected year-2 tax
- $273 · $23/mo
- Expected delta
- +$157/yr (+$13/mo · 135.1%)
ⓘ Screening estimate from a state-policy table — verify with the county assessor before closing.
Climate risk First Street
- Flood 1/10 Low 0% chance over 30 yrs
- Wildfire 5/10 Major
- Heat 7/10 Severe 5 d/yr ≥106°F today · 16 d/yr by 30 yrs out
- Wind 3/10 Moderate 6% chance of damaging wind over 30 yrs
- Air quality 2/10 Low 2 unhealthy d/yr today · 2 by 30 yrs out
Nearby sold comps map
Loading sold comps map…
Walkable amenities ~0.75 mi
Loading nearby amenities…
Taxation est. · year 1
- Rental income
- $9,857
- − Mortgage interest
- −$835
- − Property taxes
- −$116
- − Insurance
- −$74
- − Repairs & maintenance
- −$789
- − Management
- −$789
- − Depreciation
- −$433
- Taxable income
- $6,821
- Est. tax owed @ 24.0%
- −$1,637
- After-tax cash flow
- $5,022/yr
For passive investors: Depreciation is non-cash, so a rental often shows a tax loss while cash-flowing — sheltering income. Rental losses are passive: they offset passive income freely, and up to $25,000/yr can offset ordinary (W-2) income if you actively participate and your MAGI is under $100k (phasing out to $0 by $150k); unused losses carry forward. On sale, claimed depreciation is recaptured at up to 25%, and gains may owe capital-gains tax (a 1031 exchange can defer both). Figures are a year-1 estimate at your 24.0% rate — not tax advice; consult a CPA.
Schools (NCES district)
- District
- Rotan ISD
- NCES district ID
- 4838040
- Math proficiency
- 50% ▲ 10.00%
- Reading proficiency
- 50% ▲ 15.00%
- Median HH income
- $36,634
- Composite
- 43.53/100
- National rank
- #6447
- State rank
- #405 of 1141 in TX
Livability — Rotan
- Score
- 59/100
- State rank
- #1123
- US rank
- #19812
Category grades
Schools grade is shown separately in the Schools card above.
Census & demographics
- Census place
- Rotan, TX
- Population (ZIP)
- 1,662
Population outlook (Fisher County) Hauer SSP2
- Today (2025)
- 3,732 people
- By 2030
- 3,677 · -1.5%
- By 2040
- 3,556 · -4.7%
- By 2050
- 3,469 · -7.0%
- By 2075
- 3,429 · -8.1%
- By 2100
- 3,196 · -14.4%
Race, ethnicity, and origin ACS 2023
- Neighborhood character
- Diverse neighborhood (Simpson 0.56)
- Race & ethnicity
- White 54% Hispanic / Latino 39% Two or more races 19% Black 5%
- Hispanic origin (detail)
- Mexican 35%
- Common ancestry
- Italian 2% Slovak 2% Lithuanian 1%
- Foreign-born
- 4% · Canada
- Languages at home
- 81% English-only · Spanish 19%
Political lean MEDSL · Fisher
- 2024 margin
- Solid R (+63.3) · D 18.0% · R 81.3%
- 2008→2024 swing
- -41.1pp toward R · 2008: -22.2pp · 2024: -63.3pp
- All cycles
- 2024: R+63.3 2020: R+60.0 2016: R+50.1 2012: R+35.8 2008: R+22.2
Not yet ingested
- Civics
- —
Market trends
- HPI YoY
- ▼ -1.43%
- Current HPI
- 78.1423
- Rent YoY
- —
- Metro
- —
- State GDP YoY
- ▲ 3.95%
- F500 in state
- 110
Industry mix (Fortune 500 HQ in TX)
| Industry | F500 HQs | Revenue |
|---|---|---|
| Energy | 16 | $1,198B |
|
||
| Technology | 5 | $198B |
|
||
| Engineering / Construction | 4 | $72B |
|
||
| Energy Services | 3 | $60B |
|
||
| Utilities | 3 | $41B |
|
||
| Healthcare | 2 | $330B |
|
||
Price history
1 event — show timeline
- 2026-03-25 Listed $14,900 NTREIS
Property tax history
+3.6%/yrLatest (2025): $116 · +14.2% YoY. Source: county tax records.
Cash-flow waterfall
monthlySold comps — $/sqft
last 12 mo · ≤1 miLoading sold comps…