11280 Rust Rd · Rust, MI
Flood risk No data
- FEMA flood zone
- —
- Chance of flooding over 30 yrs
- —
- Est. flood insurance / yr
- —
Fire risk No data
- Est. fire insurance / yr
- —
Heat risk No data
- Hot days now (above threshold)
- —
- Hot days in 30 yrs
- —
Wind risk No data
- Chance of severe wind over 30 yrs
- —
Air-quality risk No data
- Unhealthy air days now
- —
- Unhealthy air days in 30 yrs
- —
Risk factors via First Street. Map © Google.
Why this score? — see what drove the D- grade
The composite is a weighted blend of 9 inputs, each scored 0–100. Each bar is that input's sub-score; the figure is the points it added to the 100-point composite (weight × sub-score).
- Appreciation +10.0/10.0
- ARV discount +8.8/15.0
- Cash flow +6.8/30.0
- Schools +2.6/10.0
- Rent growth +2.5/5.0
- Livability +2.5/5.0
- Condition / age +2.5/5.0
- 1% rule +1.8/10.0
- DSCR +1.0/10.0
$179,900
🖨 Deal sheet (PDF) 📄 Offer letter ✓ Due diligence
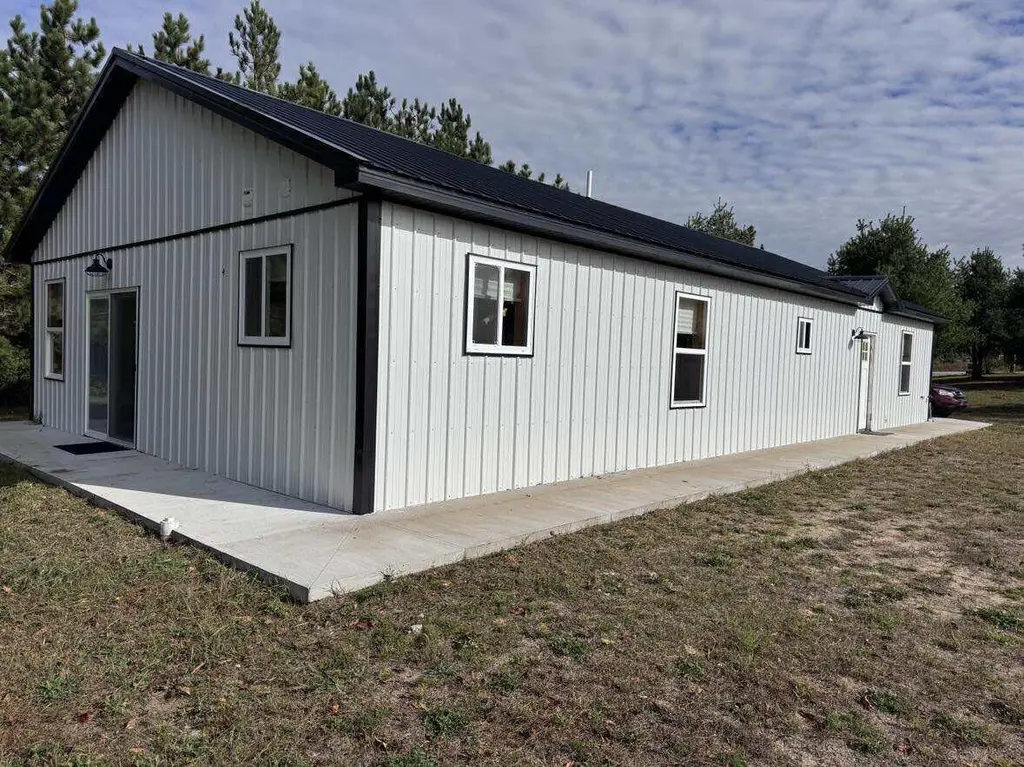
Listing remarks MLS
Unique barndominium offering modern comfort and energy efficiency on just over an acre of land! Enjoy sitting on the wrap around concrete porch. This well-built home features in-floor radiant heat for cozy year-round warmth, excellent insulation, and a durable metal roof for low-maintenance living. Large windows fill the space with natural light, creating a bright and inviting atmosphere. The on-demand water heater provides convenience and efficiency. Enjoy the charm of country living with modern amenities.
Key facts
- Durable metal roof
- Large windows
- Excellent insulation
Tags
Neighborhood map
What this means for you Summary
Snapshot
- This is a 3-bed/1.0-bath single-family listed at $180k.
Deal economics
- At list price, monthly cash flow is $-283 ($-3k/yr) — negative.
- To cash-flow at today's rent, offer at most $130k (27.8% below list).
- To meet the 1% rule (rent ≥ 1% of price), the offer needs to be $122k (32.0% below list).
- Recommended offer: $122k (32.0% below list) — sets the bar for 1% rule.
Location & tenants
- Location reads: area grade D — affects rentability + tenant quality, not the cash-flow math above.
- Hillman Community Schools (rural): math 22% / reading 40% proficiency, ranked #361 of 540 in MI (top 67%) — families likely to look elsewhere, expect single-tenant / working-renter base with shorter leases.
- Zoned schools: Hillman Elementary School (math 17% / reading 27%, grade F, #1,035 of 1,397 statewide, top 77%, 187 students, 61% FRL); Hillman Community Jrsr High School (math 27% / reading 47%, grade F, #334 of 713 statewide, top 51%, 228 students, 50% FRL) — zoned schools at 55% FRL track the district average.
- Market conditions: 38 active listings in the ZIP.
Forward outlook
- In year one you build about $19k of equity ($1k loan paydown + $18k appreciation (10.0% local appreciation)).
- Montmorency County population projected at -38% by 2050 — secular population decline; favor cash flow + early exit over multi-decade hold.
- By year 2, paydown + projected appreciation supports a ~$31k cash-out refi (75% LTV) — recoverable capital for the next deal without selling this one.
Negotiation context
- It's been on market 222 days — a 12% lower offer ($158k) is reasonable based on typical stale-listing flexibility.
Questions for the listing agent
- What do current leases actually rent for vs. the listed asking? Can we see a recent rent roll and the last 12 months of T-12 income?
- It's been on market 222 days. Have you received any prior offers? Is the seller open to a 32% concession, seller financing, or rate buy-down credit?
- Why hasn't it sold? Are there any deal-killer items the seller is aware of (foundation, flood, title, zoning, code violations)?
- Is there a deadline driving the sale (1031 exchange, divorce, estate, relocation)? That informs how much negotiation room exists.
- The area grade is low — what's the realistic commute time and amenity access for the typical tenant pool here? Any planned neighborhood developments (good or bad) we should know about?
- What's the average days-on-market for RENTAL listings here right now (not sales)? A rising rental-DOM trend means longer vacancies and softer asking-rent achievability than the comps imply.
- What's the recent tenant-quality profile in this submarket — average credit score on applications, eviction rate, late-payment / NSF rate, and stable-employment percentage? A property-management company in the area should have these aggregated.
- How much new for-sale + rental construction is in the pipeline within 1–3 miles? Heavy new supply typically softens prices + rents 12–24 months out; constrained supply supports both.
Investment metrics
- 1% rule
- 0.68% ✗
- Cap rate
- 4.40%
- Cash-on-cash
- -6.74%
- DSCR
- 0.70
- GRM
- 12.3
CMA / ARV
- ARV (median comp)
- $185,320
- List price
- $179,900
- Delta
- -2.92%
- Verdict
- FAIR
- Comps
- 4 within 2.0 mi
Projected returns pro-forma
10.0% appreciation · 3.0% rent growth · sell at horizon
- IRR
- 19.5%
- Equity multiple
- 2.59×
- Total profit
- $79,973
- Equity at exit
- $162,068
- IRR
- 17.9%
- Equity multiple
- 5.96×
- Total profit
- $249,728
- Equity at exit
- $349,506
Cash invested: $50,372 (down + closing). Projections, not guarantees.
Landlord ↔ Tenant lean methodology
- Overall (STATE)
- 62 Landlord-Friendly
- State Michigan
- 62 Landlord-Friendly · EVEN
- County
- — inherits STATE
- City
- — inherits STATE
ZIP-level market 49746
- Home prices YoY
- 5.7%
- Active inventory
- 38
- Price-to-rent
- 12.3×
Monthly cashflow live
- Estimated rent
- $1,223 medium interval (Pro) →
- Mortgage (P&I)
- −$943
- Tax from tax record
- −$231 /mo · $2,769/yr
- Insurance
- −$75
- HOA
- −$0
- Vacancy / Maint / Mgmt
- −$257
- Net cashflow
- $-283
Break-even live
Sensitivity live
| Price | -10% $-181 | -5% $-232 | +0% $-283 | +5% $-334 | +10% $-385 |
|---|---|---|---|---|---|
| Rent | -10% $-380 | -5% $-331 | +0% $-283 | +5% $-235 | +10% $-186 |
| Rate | -1.0pp $-192 | -0.5pp $-237 | base $-283 | +0.5pp $-330 | +1.0pp $-377 |
UW: 25.0% down · 7.5% · 30yr · 1.5% tax · 5.0% vac · 8.0% maint · 8.0% mgmt
Financing live
Cash to close
- Down payment
- $44,975
- Closing costs
- $5,397
- Reserves months
- —
- Total cash needed
- —
Loan-product check · same deal, 3 products live
Conventional
25% down · 7.5% · 30yr
- Down + closing
- —
- Monthly P&I
- —
- Monthly cashflow
- —
- DSCR
- —
- Eligible?
- —
Personal DTI + credit; lowest rate.
DSCR
20% down · 8.5% · 30yr
- Down + closing
- —
- Monthly P&I
- —
- Monthly cashflow
- —
- DSCR
- —
- Eligible?
- —
No personal income docs; deal must DSCR.
Hard money
10% down · 12.0% · 12mo
- Down + closing
- —
- Monthly P&I
- —
- Monthly cashflow
- —
- DSCR
- —
- Eligible?
- —
Short-term bridge; refi at stabilization.
Listing history 18 events
-
2026-06-21days on market $179,900 Active 222 DOM
-
2026-06-21days on market $179,900 Active 221 DOM
-
2026-06-18days on market $179,900 Active 219 DOM
-
2026-06-17days on market $179,900 Active 218 DOM
-
2026-06-16days on market $179,900 Active 217 DOM
-
2026-06-15days on market $179,900 Active 216 DOM
-
2026-06-13days on market $179,900 Active 214 DOM
-
2026-06-12statusdays on market $179,900 Active 213 DOM
-
2026-05-15status Pending 512-char remark
Show marketing remark (512 chars)
Unique barndominium offering modern comfort and energy efficiency on just over an acre of land! Enjoy sitting on the wrap around concrete porch. This well-built home features in-floor radiant heat for cozy year-round warmth, excellent insulation, and a durable metal roof for low-maintenance living. Large windows fill the space with natural light, creating a bright and inviting atmosphere. The on-demand water heater provides convenience and efficiency. Enjoy the charm of country living with modern amenities.
-
2026-05-10historical Active Under Contract 512-char remark
Show marketing remark (512 chars)
Unique barndominium offering modern comfort and energy efficiency on just over an acre of land! Enjoy sitting on the wrap around concrete porch. This well-built home features in-floor radiant heat for cozy year-round warmth, excellent insulation, and a durable metal roof for low-maintenance living. Large windows fill the space with natural light, creating a bright and inviting atmosphere. The on-demand water heater provides convenience and efficiency. Enjoy the charm of country living with modern amenities.
-
2025-11-20price $179,900 512-char remark
Show marketing remark (512 chars)
Unique barndominium offering modern comfort and energy efficiency on just over an acre of land! Enjoy sitting on the wrap around concrete porch. This well-built home features in-floor radiant heat for cozy year-round warmth, excellent insulation, and a durable metal roof for low-maintenance living. Large windows fill the space with natural light, creating a bright and inviting atmosphere. The on-demand water heater provides convenience and efficiency. Enjoy the charm of country living with modern amenities.
-
2025-10-14$199,000 Active 512-char remark
Show marketing remark (512 chars)
Unique barndominium offering modern comfort and energy efficiency on just over an acre of land! Enjoy sitting on the wrap around concrete porch. This well-built home features in-floor radiant heat for cozy year-round warmth, excellent insulation, and a durable metal roof for low-maintenance living. Large windows fill the space with natural light, creating a bright and inviting atmosphere. The on-demand water heater provides convenience and efficiency. Enjoy the charm of country living with modern amenities.
-
2025-09-17price $199,000
-
2025-07-03price $227,500
-
2025-05-08price $237,500
-
2025-04-14price $259,500
-
2025-01-27price $264,500
-
2025-01-06price $269,500
ⓘ Source: listings_history table (triggers on properties + properties_extension) + one-shot
backfill from property_details.listing_events for pre-trigger history.
Tax reassessment forecast MI · Partial reset (capped growth)
- Current annual tax
- $2,769 · $231/mo
- Projected year-2 tax
- $2,770 · $231/mo
- Expected delta
- +$1/yr ($0/mo · 0.0%)
ⓘ Screening estimate from a state-policy table — verify with the county assessor before closing.
Nearby sold comps map
Loading sold comps map…
Walkable amenities ~0.75 mi
Loading nearby amenities…
Taxation est. · year 1
- Rental income
- $14,675
- − Mortgage interest
- −$10,077
- − Property taxes
- −$2,769
- − Insurance
- −$900
- − Repairs & maintenance
- −$1,174
- − Management
- −$1,174
- − Depreciation
- −$5,233
- Taxable loss
- −$6,652
- Est. tax savings @ 24.0%
- +$1,597
- After-tax cash flow
- $-1,800/yr
For passive investors: Depreciation is non-cash, so a rental often shows a tax loss while cash-flowing — sheltering income. Rental losses are passive: they offset passive income freely, and up to $25,000/yr can offset ordinary (W-2) income if you actively participate and your MAGI is under $100k (phasing out to $0 by $150k); unused losses carry forward. On sale, claimed depreciation is recaptured at up to 25%, and gains may owe capital-gains tax (a 1031 exchange can defer both). Figures are a year-1 estimate at your 24.0% rate — not tax advice; consult a CPA.
Schools (NCES district)
- District
- Hillman Community Schools
- NCES district ID
- 2618360
- Math proficiency
- 22% ▬ 0.00%
- Reading proficiency
- 40% ▲ 3.00%
- Median HH income
- $37,668
- Composite
- 25.78/100
- National rank
- #7368
- State rank
- #361 of 540 in MI
Livability — Rust
No livability data for this city. (Only ~50 U.S. cities are tracked.)
Census & demographics
- Population (ZIP)
- 3,502
Population outlook (Montmorency County) Hauer SSP2
- Today (2025)
- 8,233 people
- By 2030
- 7,575 · -8.0%
- By 2040
- 6,202 · -24.7%
- By 2050
- 5,081 · -38.3%
- By 2075
- 3,119 · -62.1%
- By 2100
- 1,923 · -76.6%
Race, ethnicity, and origin ACS 2023
- Neighborhood character
- Predominantly White (95%)
- Race & ethnicity
- White 95% Two or more races 3% Hispanic / Latino 1% Native American 1%
- Common ancestry
- Romanian 9% Lithuanian 6% Slovak 2%
- Foreign-born
- 1% · Canada
Political lean MEDSL · Montmorency
- 2024 margin
- Solid R (+45.3) · D 26.6% · R 72.0% · Other 1.4%
- 2008→2024 swing
- -37.2pp toward R · 2008: -8.2pp · 2024: -45.3pp
- All cycles
- 2024: R+45.3 2020: R+43.4 2016: R+44.2 2012: R+17.4 2008: R+8.2
Not yet ingested
- Civics
- —
Market trends
- HPI YoY
- ▲ 11.19%
- Current HPI
- 208.751
- Rent YoY
- —
- Metro
- —
- State GDP YoY
- ▲ 1.37%
- F500 in state
- 28
Industry mix (Fortune 500 HQ in MI)
| Industry | F500 HQs | Revenue |
|---|---|---|
| Automotive Parts | 3 | $48B |
|
||
| Automotive | 2 | $372B |
|
||
| Chemicals | 1 | $45B |
|
||
| Automotive Retail | 1 | $29B |
|
||
| Healthcare / Medical Devices | 1 | $23B |
|
||
| Automotive Technology | 1 | $20B |
|
||
Price history
-33.2% since first listed10 events — show timeline
- 2026-05-15 Pending — WWMLS
- 2026-05-10 Contingent — WWMLS
- 2025-11-20 Price Changed $179,900 WWMLS
- 2025-10-14 Listed $199,000 WWMLS
- 2025-09-17 Price Changed $199,000 WWMLS
- 2025-07-03 Price Changed $227,500 WWMLS
- 2025-05-08 Price Changed $237,500 WWMLS
- 2025-04-14 Price Changed $259,500 WWMLS
- 2025-01-27 Price Changed $264,500 WWMLS
- 2025-01-06 Price Changed $269,500 WWMLS
Property tax history
+3094.4%/yrLatest (2024): $2,769 · +3094.4% YoY. Source: county tax records.
Cash-flow waterfall
monthlySold comps — $/sqft
last 12 mo · ≤1 miLoading sold comps…