42 Vintage · Irvine, CA
Flood risk No data
- FEMA flood zone
- —
- Chance of flooding over 30 yrs
- —
- Est. flood insurance / yr
- —
Fire risk No data
- Est. fire insurance / yr
- —
Heat risk No data
- Hot days now (above threshold)
- —
- Hot days in 30 yrs
- —
Wind risk No data
- Chance of severe wind over 30 yrs
- —
Air-quality risk No data
- Unhealthy air days now
- —
- Unhealthy air days in 30 yrs
- —
Risk factors via First Street. Map © Google.
Why this score? — see what drove the D- grade
The composite is a weighted blend of 9 inputs, each scored 0–100. Each bar is that input's sub-score; the figure is the points it added to the 100-point composite (weight × sub-score).
- ARV discount +15.0/15.0
- Schools +6.9/10.0
- Appreciation +6.2/10.0
- Livability +3.8/5.0
- Rent growth +2.5/5.0
- Condition / age +2.5/5.0
- Cash flow +1.9/30.0
- 1% rule +0.1/10.0
- DSCR +0.0/10.0
$655,000
🖨 Deal sheet (PDF) 📄 Offer letter ✓ Due diligence
Listing remarks
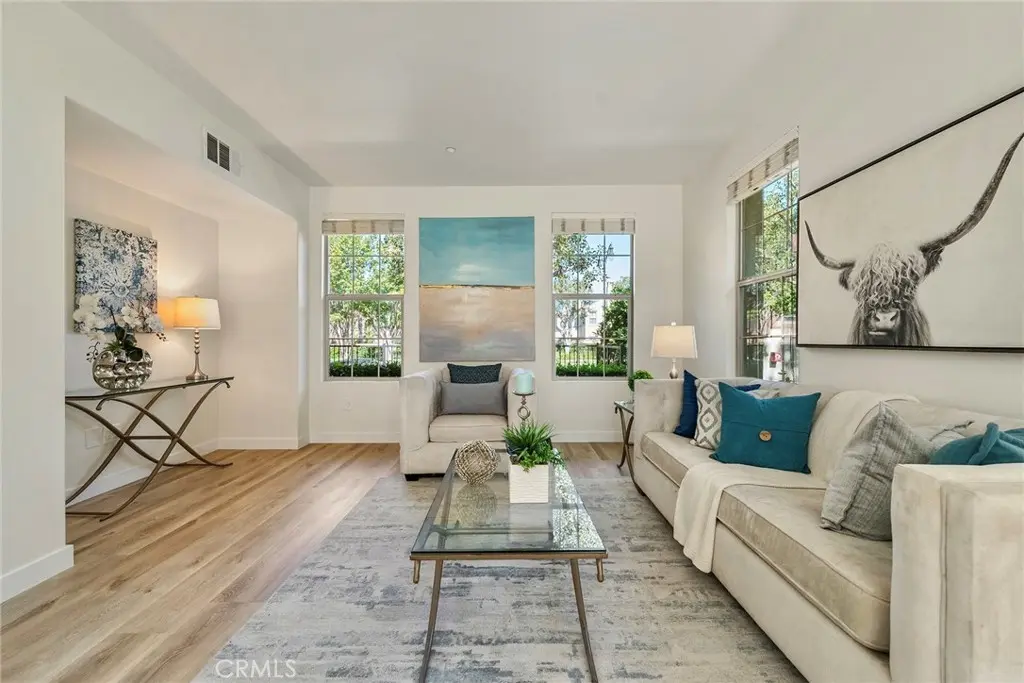
Live Auction! Bidding to start from $655,000! Traditional Non-distressed property. Cash or Finance ok! Seller will entertain offers prior to the Auction date. Welcome to the one that actually has it all — end unit, single level, fully remodeled, and nestled inside Woodbury, one of Irvine's most coveted master-planned communities. Step through the entry and you'll immediately feel it, the brightness, the openness, the quiet. The fully remodeled kitchen showcases crisp white cabinetry, a breakfast bar that doubles as a gathering spot, and a seamless flow into the living area that makes the space feel larger than it lives on paper. The primary suite is genuinely oversized, complete with
Key facts
- Half bath
- Single level
- End unit
Tags
Property features AI
Finance
- HOA & community: Part of Woodbury Community Association and Lombard Court Community Association; Monthly association fees (two assessments) with stated amounts; Community of 94 units; Association amenities include spa, pool, multiple courts, clubhouse, gym, playground, and maintained common areas; Mello-Roos assessments
Exterior
- Parking: Attached garage with direct access; Single-car garage (one garage space); Street parking available
- Security: Smoke detector(s); Carbon monoxide detector(s)
- Utilities: Public sewer; District/public water; Natural gas available; Electricity available; Cable available; Telephone in street; Water and sewer available
- Home design: Condominium end unit; Single-story (one level); Attached property; Has a view; Accessible with swing-in doors
- Construction: House structure with concrete and stucco construction; Drywall interior walls; Shingle roof; Built/recorded year from public records
- Exterior features: Private and association spa; Association-maintained pool; No perimeter fencing; Association amenities include pool, spa, tennis, pickleball, paddle tennis, sport courts, playground, barbecue/outdoor cooking areas, fire pit, picnic area, clubhouse with meeting room, gym, and maintained grounds; Community features include curbs, street lighting, sidewalks and park
Interior
- Kitchen: Family-style kitchen with breakfast counter/bar; Pots & pan drawers; Stone counters; Self-closing cabinet doors; Eating area open to living space
- Bedrooms: Main floor primary bedroom; All bedrooms on the ground level; Walk-in closet
- Flooring: Laminate flooring
- Bathrooms: One full bathroom (upgraded, remodeled) with shower-in-tub; One half bathroom; Double sinks in primary bath; Stone counters in baths
- Heating & cooling: Central heating (furnace); Central air conditioning
- Interior features: Built-in shelving/cabinets; Open floor plan; Tile counters; Double pane windows; No interior steps; Smoke and carbon monoxide detectors; Turnkey condition; Termite clearance
- Laundry & utility: Laundry room inside the unit; Washer hookup; Gas dryer hookup; Individual laundry room
Neighborhood map
What this means for you Summary
Snapshot
- This is a 1-bed/1.5-bath condo listed at $655k.
Deal economics
- At list price, monthly cash flow is $-2k ($-29k/yr) — negative.
- To cash-flow at today's rent, offer at most $222k (66.1% below list).
- To meet the 1% rule (rent ≥ 1% of price), the offer needs to be $332k (49.4% below list).
- Recommended offer: $222k (66.1% below list) — sets the bar for cash-flow.
- Cap rate 1.8% vs local median 1.2% in Irvine — top-decile yield for the area; either an underpriced asset or a hidden risk that comps aren't pricing in. Stress-test before assuming the spread holds.
Location & tenants
- Location reads 76/100 on livability (#100 in CA, #3,537 nationally) — a middle-class / working-renter tenant base. Strengths: crime A+, commute A+, employment A+; Watch: health & safety C-, cost of living F.
- Irvine Unified (urban): math 74% / reading 80% proficiency, ranked #31 of 517 in CA (top 6%) — strong family-tenant draw, lease renewals of 3-5y typical; only 10% free/reduced lunch — higher-income household profile.
- Zoned schools: Woodbury Elementary (1,069 students, 15% FRL); Jeffrey Trail Middle (1,077 students, 18% FRL); Portola High (math 76% / reading 85%, grade A, #40 of 1,170 statewide, top 3%, 2,293 students, 16% FRL).
- Market conditions: Rents flat; 151 active listings in the ZIP; 40 comparable units currently listed for rent nearby; rentals leasing fast (median 13d on market — plan ~1-2 weeks tenant-placement turnaround); high-income renter base; 6,974 units permitted in Orange County in 2024 (3,839 in 5+ unit buildings).
Forward outlook
- In year one you build about $21k of equity ($5k loan paydown + $16k appreciation (2.5% local appreciation)).
- Orange County population projected at +14% by 2050 — modest demand growth; plan on rents tracking national, not racing it.
- By year 3, paydown + projected appreciation supports a ~$52k cash-out refi (75% LTV) — recoverable capital for the next deal without selling this one.
Negotiation context
- Only 13 days on market — expect competitive offers; lowballing is unlikely to land.
- 4 sale attempts with the ask held roughly flat each time — persistent listings suggest the price (not the market) is what's stuck; bring a comps-based counter.
Questions for the listing agent
- What do current leases actually rent for vs. the listed asking? Can we see a recent rent roll and the last 12 months of T-12 income?
- What does the HOA fee cover, when was the last increase, and are there any pending special assessments or reserve-fund shortfalls?
- Any open or pending special assessments — roof, HVAC, plumbing, elevator, façade? What's the per-unit balance and payoff schedule, and is the seller paying it off at close or rolling it to the buyer?
- Is there a deadline driving the sale (1031 exchange, divorce, estate, relocation)? That informs how much negotiation room exists.
- Schools are A-rated — typically a magnet for longer-tenancy family renters. What's the average tenant stay here, and is there a school-zone premium baked into asking?
- The area grade is low — what's the realistic commute time and amenity access for the typical tenant pool here? Any planned neighborhood developments (good or bad) we should know about?
- What's the average days-on-market for RENTAL listings here right now (not sales)? A rising rental-DOM trend means longer vacancies and softer asking-rent achievability than the comps imply.
- What's the recent tenant-quality profile in this submarket — average credit score on applications, eviction rate, late-payment / NSF rate, and stable-employment percentage? A property-management company in the area should have these aggregated.
- How much new apartment / multifamily construction is in the pipeline within 1–3 miles? Heavy new supply (>2% of stock underway) typically softens rents 12–24 months out; light construction supports rent growth.
Investment metrics
- 1% rule
- 0.51% ✗
- Cap rate
- 1.80%
- Cash-on-cash
- -16.03%
- DSCR
- 0.29
- GRM
- 16.5
CMA / ARV
- ARV (median comp)
- $839,134
- List price
- $655,000
- Delta
- 1.29%
- Verdict
- FAIR
- Comps
- 20 within 1.0 mi
Projected returns pro-forma
2.48% appreciation · 0.13% rent growth · sell at horizon
- IRR
- -10.2%
- Equity multiple
- 0.43×
- Total profit
- $-103,843
- Equity at exit
- $275,592
- IRR
- -5.2%
- Equity multiple
- 0.24×
- Total profit
- $-138,813
- Equity at exit
- $410,555
Cash invested: $183,400 (down + closing). Projections, not guarantees.
Landlord ↔ Tenant lean methodology
- Overall (STATE)
- 18 Strongly Tenant-Friendly
- State California
- 18 Strongly Tenant-Friendly · D+13
- County
- — inherits STATE
- City
- — inherits STATE
ZIP-level market 92620
- Home prices YoY
- 0.5%
- Rents YoY
- 0.1%
- Active inventory
- 151
- Price-to-rent
- 16.5×
Monthly cashflow live
- Estimated rent
- $3,317 high interval (Pro) →
- Mortgage (P&I)
- −$3,435
- Tax from tax record
- −$888 /mo · $10,651/yr
- Insurance
- −$273
- HOA
- −$475
- Vacancy / Maint / Mgmt
- −$697
- Net cashflow
- $-2,450
Break-even live
Sensitivity live
| Price | -10% $-2,079 | -5% $-2,264 | +0% $-2,450 | +5% $-2,635 | +10% $-2,821 |
|---|---|---|---|---|---|
| Rent | -10% $-2,712 | -5% $-2,581 | +0% $-2,450 | +5% $-2,319 | +10% $-2,188 |
| Rate | -1.0pp $-2,120 | -0.5pp $-2,283 | base $-2,450 | +0.5pp $-2,620 | +1.0pp $-2,792 |
UW: 25.0% down · 7.5% · 30yr · 1.5% tax · 5.0% vac · 8.0% maint · 8.0% mgmt
Financing live
Cash to close
- Down payment
- $163,750
- Closing costs
- $19,650
- Reserves months
- —
- Total cash needed
- —
Loan-product check · same deal, 3 products live
Conventional
25% down · 7.5% · 30yr
- Down + closing
- —
- Monthly P&I
- —
- Monthly cashflow
- —
- DSCR
- —
- Eligible?
- —
Personal DTI + credit; lowest rate.
DSCR
20% down · 8.5% · 30yr
- Down + closing
- —
- Monthly P&I
- —
- Monthly cashflow
- —
- DSCR
- —
- Eligible?
- —
No personal income docs; deal must DSCR.
Hard money
10% down · 12.0% · 12mo
- Down + closing
- —
- Monthly P&I
- —
- Monthly cashflow
- —
- DSCR
- —
- Eligible?
- —
Short-term bridge; refi at stabilization.
Rent comps 40 comps
| Address | Beds | Baths | Sqft | Rent | $/sqft | DOM | Units | Dist |
|---|---|---|---|---|---|---|---|---|
| 37 Spanish Lace Irvine, CA | 1.0 | 2.0 | 1100 | $3,000 | $2.73 | 44d | 1 | 0.10mi |
| 76 Great Lawn Irvine, CA | 2.0 | 2.5 | 1154 | $3,800 | $3.29 | 6d | 1 | 0.17mi |
| 49 Canal Irvine, CA | 2.0 | 2.5 | 1021 | $5,800 | $5.68 | 44d | 1 | 0.40mi |
| 100 Grand Canal Irvine, CA | 1.0–2.0 | 1.0–2.5 | 901 | $2,565 | $2.85 | 0d | 108 | 0.45mi |
| 8 Iceberg Rose Irvine, CA | 2.0 | 2.5 | 1170 | $4,050 | $3.46 | 44d | 1 | 0.52mi |
| 42 Talisman Irvine, CA | 2.0 | 2.0 | 1165 | $3,700 | $3.18 | 3d | 1 | 0.54mi |
| 33 Iceberg Rose Irvine, CA | 2.0 | 2.0 | 1106 | $3,500 | $3.16 | 44d | 1 | 0.57mi |
| 39 Costa Brava Irvine, CA | 2.0 | 2.5 | 1170 | $4,000 | $3.42 | 25d | 1 | 0.60mi |
| 100 Simplicity Irvine, CA | 1.0–2.0 | 1.0–2.0 | 954 | $2,730 | $2.86 | 4d | 22 | 0.62mi |
| 19 Fulton Irvine, CA | 2.0 | 2.0 | 1475 | $4,300 | $2.92 | 0d | 1 | 0.66mi |
| 1000 Payton Irvine, CA | 1.0–2.0 | 1.0–2.0 | 856 | $2,665 | $3.11 | 0d | 25 | 0.69mi |
| 100 Piedmont Irvine, CA | 1.0–2.0 | 1.0–2.0 | 769 | $2,610 | $3.39 | 0d | 26 | 0.69mi |
| 100 Cantor Irvine, CA | 1.0–2.0 | 2.0–2.5 | 1000 | $3,705 | $3.70 | 2d | 14 | 0.76mi |
| 122 Overbrook Irvine, CA | 2.0 | 2.0 | 1129 | $3,600 | $3.19 | 44d | 1 | 0.77mi |
| 1300 Hayes St Irvine, CA | 1.0–2.0 | 1.0–2.0 | 882 | $2,405 | $2.73 | 0d | 23 | 0.80mi |
| 162 Overbrook Irvine, CA | 2.0 | 2.0 | 1129 | $4,200 | $3.72 | 44d | 1 | 0.82mi |
| 317 Huntington Irvine, CA | 2.0 | 2.0 | 1000 | $3,100 | $3.10 | 14d | 1 | 0.83mi |
| 70 Kempton Irvine, CA | 2.0 | 1.5 | 1129 | $3,600 | $3.19 | 44d | 1 | 0.86mi |
| 100 Mirasol Irvine, CA | 1.0–2.0 | 1.0–2.0 | 987 | $2,655 | $2.69 | 0d | 17 | 0.91mi |
| 5151 Walnut Ave #29 Irvine, CA | 2.0 | 3.0 | 1142 | $3,400 | $2.98 | 44d | 1 | 0.95mi |
| 100 Virtuoso Irvine, CA | 1.0–2.0 | 1.0–2.0 | 926 | $2,625 | $2.83 | 2d | 26 | 0.98mi |
| 4 Van Buren #313 Irvine, CA | 2.0 | 2.0 | 903 | $3,300 | $3.65 | 13d | 1 | 1.00mi |
| 100 Esperanza Irvine, CA | 1.0–2.0 | 1.0–2.0 | 906 | $2,495 | $2.75 | 0d | 22 | 1.00mi |
| 78 Rose Arch #21 Irvine, CA | 2.0 | 2.0 | 1300 | $3,950 | $3.04 | 44d | 1 | 1.02mi |
| 8 Albany Irvine, CA | 2.0 | 1.5 | 1011 | $3,100 | $3.07 | 8d | 1 | 1.03mi |
| 4 Austin Irvine, CA | 1.0–2.0 | 1.0–2.0 | 803 | $2,615 | $3.25 | 0d | 4 | 1.04mi |
| 74 Granite Path Irvine, CA | 2.0 | 2.0 | 1182 | $3,800 | $3.21 | 44d | 1 | 1.06mi |
| 80 Granite Path Irvine, CA | 2.0 | 2.0 | 1182 | $3,750 | $3.17 | 14d | 1 | 1.06mi |
| 31 Golden Glen St Irvine, CA | 2.0 | 2.0 | 1048 | $3,250 | $3.10 | 12d | 1 | 1.08mi |
| 230 Springview Irvine, CA | 2.0 | 1.0 | 809 | $2,600 | $3.21 | 44d | 1 | 1.09mi |
| 6500 Roosevelt Irvine, CA | 1.0–3.0 | 1.0–2.0 | 1014 | $2,720 | $2.68 | 0d | 248 | 1.09mi |
| 194 Rose Arch Irvine, CA | 2.0 | 2.5 | 1441 | $4,000 | $2.78 | 8d | 1 | 1.12mi |
| 247 Streamwood Irvine, CA | 2.0 | 1.0 | 887 | $3,250 | $3.66 | 19d | 1 | 1.15mi |
| 40 Lakepines Irvine, CA | 2.0 | 1.5 | 1204 | $3,300 | $2.74 | 19d | 1 | 1.18mi |
| 34 Elksford Ave Irvine, CA | 2.0 | 2.0 | 1078 | $3,280 | $3.04 | 44d | 1 | 1.18mi |
| 20 Lakepines Irvine, CA | 2.0 | 1.5 | 1204 | $3,300 | $2.74 | 19d | 1 | 1.18mi |
| 163 Pineview Irvine, CA | 1.0 | 1.0 | 934 | $3,200 | $3.43 | 11d | 1 | 1.22mi |
| 1178 Epic Irvine, CA | 2.0 | 2.0 | 958 | $3,990 | $4.16 | 21d | 1 | 1.22mi |
| 52 Bridgeport Irvine, CA | 2.0 | 2.0 | 948 | $3,600 | $3.80 | 3d | 1 | 1.25mi |
| 115 Fable Irvine, CA | 2.0 | 2.5 | 1267 | $3,700 | $2.92 | 3d | 1 | 1.27mi |
HOA detail condo
- Monthly dues
- $475 · $5,700/yr
- Assessments
- None detected in remarks — confirm with the listing agent.
Listing history 16 events
-
2026-06-21days on market $655,000 Active 13 DOM
-
2026-06-18days on market $655,000 Active 10 DOM
-
2026-06-17days on market $655,000 Active 9 DOM
-
2026-06-16days on market $655,000 Active 8 DOM
-
2026-06-15days on market $655,000 Active 7 DOM
-
2026-06-13days on market $655,000 Active 5 DOM
-
2026-06-13days on market $655,000 Active 4 DOM
-
2026-06-08remarks 693-char remark
-
2026-06-08pricedays on market $655,000 Active 1 DOM
-
2026-02-04$849,999 Active 497-char remark
-
2026-01-27historical
-
2025-11-20price $899,000
-
2025-09-09$919,000 Active
-
2025-08-08soldstatus $805,000
-
2025-08-07soldstatus $750,000 Closed
-
2025-07-14$750,000 Active
ⓘ Source: listings_history table (triggers on properties + properties_extension) + one-shot
backfill from property_details.listing_events for pre-trigger history.
Tax reassessment forecast CA · Resets to sale price
- Current annual tax
- $10,651 · $888/mo
- Projected year-2 tax
- $10,651 · $888/mo
- Expected delta
- $0/yr ($0/mo · 0.0%)
ⓘ Screening estimate from a state-policy table — verify with the county assessor before closing.
Nearby sold comps map
Loading sold comps map…
Walkable amenities ~0.75 mi
Loading nearby amenities…
Taxation est. · year 1
- Rental income
- $39,806
- − Mortgage interest
- −$36,690
- − Property taxes
- −$10,651
- − Insurance
- −$3,275
- − Repairs & maintenance
- −$3,184
- − Management
- −$3,184
- − HOA
- −$5,700
- − Depreciation
- −$19,055
- Taxable loss
- −$41,934
- Est. tax savings @ 24.0%
- +$10,064
- After-tax cash flow
- $-19,334/yr
For passive investors: Depreciation is non-cash, so a rental often shows a tax loss while cash-flowing — sheltering income. Rental losses are passive: they offset passive income freely, and up to $25,000/yr can offset ordinary (W-2) income if you actively participate and your MAGI is under $100k (phasing out to $0 by $150k); unused losses carry forward. On sale, claimed depreciation is recaptured at up to 25%, and gains may owe capital-gains tax (a 1031 exchange can defer both). Figures are a year-1 estimate at your 24.0% rate — not tax advice; consult a CPA.
Schools (NCES district)
- District
- Irvine Unified
- NCES district ID
- 0684500
- Math proficiency
- 74% ▲ 1.00%
- Reading proficiency
- 80% ▲ 3.00%
- Median HH income
- $92,078
- Composite
- 69.17/100
- National rank
- #319
- State rank
- #31 of 517 in CA
Livability — Irvine
- Score
- 76/100
- State rank
- #100
- US rank
- #3537
Category grades
Schools grade is shown separately in the Schools card above.
Census & demographics
- Census place
- Irvine, CA
- County
- Orange County · 3,096,323 people
- City population
- 287,839
- Metro
- Los Angeles-Long Beach-Anaheim, CA
- Population (ZIP)
- 61,631
- Household income
- $146,942
- Rent vs Own
- Severe rent burden
- 2240.0
Population outlook (Orange County) Hauer SSP2
- Today (2025)
- 3,477,456 people
- By 2030
- 3,613,117 · +3.9%
- By 2040
- 3,835,945 · +10.3%
- By 2050
- 3,968,736 · +14.1%
- By 2075
- 4,097,053 · +17.8%
- By 2100
- 3,903,633 · +12.3%
Race, ethnicity, and origin ACS 2023
- Neighborhood character
- Diverse neighborhood (Simpson 0.58)
- Race & ethnicity
- Asian 59% White 26% Two or more races 9% Hispanic / Latino 8% Black 1%
- Hispanic origin (detail)
- Mexican 6%
- Common ancestry
- Scotch-Irish 1% Italian 1% Romanian 1%
- Foreign-born
- 43% · China, South Korea, Vietnam
- Languages at home
- 45% English-only · Chinese 21% Other Indo-European 10% Korean 8%
Political lean MEDSL · Orange
- 2024 margin
- Toss-up / Even · D 49.7% · R 47.1% · Other 3.2%
- 2008→2024 swing
- +5.2pp toward D · 2008: -2.6pp · 2024: 2.6pp
- All cycles
- 2024: D+2.6 2020: D+9.0 2016: D+7.7 2012: R+8.3 2008: R+2.6
Not yet ingested
- Civics
- —
Market trends
- HPI YoY
- ▲ 2.48%
- Current HPI
- 499.7012
- Rent YoY
- ▲ 0.13%
- Metro
- Los Angeles-Long Beach-Anaheim, CA
- State GDP YoY
- ▲ 3.21%
- F500 in state
- 116
Industry mix (Fortune 500 HQ in CA)
| Industry | F500 HQs | Revenue |
|---|---|---|
| Technology | 27 | $1,492B |
|
||
| Financial Services | 3 | $174B |
|
||
| Retail | 3 | $44B |
|
||
| Insurance | 3 | $26B |
|
||
| Media / Entertainment | 2 | $115B |
|
||
| Pharmaceuticals / Biotech | 2 | $62B |
|
||
Price history
-12.7% since first listed9 events — show timeline
- 2026-06-08 Listed $655,000 CRMLS
- 2026-05-27 Listing Removed — CRMLS
- 2026-02-04 Listed $849,999 CRMLS
- 2026-01-27 Listing Removed — CRMLS
- 2025-11-20 Price Changed $899,000 CRMLS
- 2025-09-09 Listed $919,000 CRMLS
- 2025-08-08 Sold (Public Records) $805,000 Public Records
- 2025-08-07 Sold (MLS) $750,000 SDMLS
- 2025-07-14 Listed $750,000 SDMLS
Property tax history
+2.2%/yrLatest (2025): $10,651 · +1.8% YoY. Source: county tax records.
Cash-flow waterfall
monthlySold comps — $/sqft
last 12 mo · ≤1 miLoading sold comps…