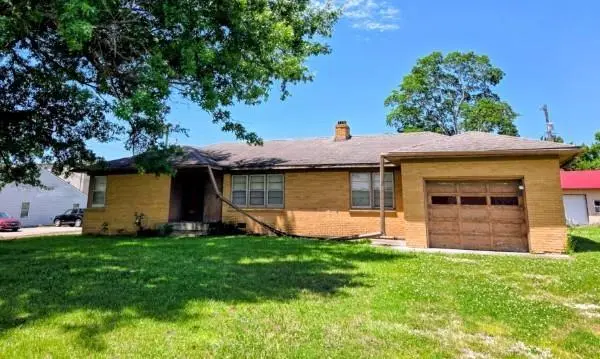
126 SW State Route 13 N/A · Warrensburg, MO
Flood risk No data
- FEMA flood zone
- —
- Chance of flooding over 30 yrs
- —
- Est. flood insurance / yr
- —
Fire risk No data
- Est. fire insurance / yr
- —
Heat risk No data
- Hot days now (above threshold)
- —
- Hot days in 30 yrs
- —
Wind risk No data
- Chance of severe wind over 30 yrs
- —
Air-quality risk No data
- Unhealthy air days now
- —
- Unhealthy air days in 30 yrs
- —
Risk factors via First Street. Map © Google.
Why this score? — see what drove the C+ grade
The composite is a weighted blend of 9 inputs, each scored 0–100. Each bar is that input's sub-score; the figure is the points it added to the 100-point composite (weight × sub-score).
- Cash flow +25.6/30.0
- DSCR +8.5/10.0
- ARV discount +7.5/15.0
- 1% rule +6.7/10.0
- Rent growth +4.2/5.0
- Livability +3.7/5.0
- Schools +3.2/10.0
- Condition / age +1.0/5.0
- Appreciation +0.0/10.0
$108,000
🖨 Deal sheet 📄 Offer letter ✓ Due diligence
Listing remarks
Property under contract prior to listing.
Key facts
- 0.42 acre lot
- Garage
- Built 1962
Neighborhood map
What this means for you Summary
Snapshot
- This is a 2-bed/1.0-bath single-family listed at $108k. Condition is rated poor.
Deal economics
- At list price, monthly cash flow is $256 ($3k/yr) — positive.
- The deal already cash-flows at list — no discount required.
- Meets the 1% rule at list price ($1k rent vs $108k).
- Cap rate 9.1% vs local median 3.2% in Warrensburg — top-decile yield for the area; either an underpriced asset or a hidden risk that comps aren't pricing in. Stress-test before assuming the spread holds.
Location & tenants
- Location reads 74/100 on livability (#71 in MO, #4,801 nationally) — a middle-class / working-renter tenant base. Strengths: cost of living A+, housing A+, health & safety A; Watch: crime D+, employment D+, commute F.
- Warrensburg R-VI (town): math 30% / reading 45% proficiency, ranked #184 of 324 in MO (top 57%) — families likely to look elsewhere, expect single-tenant / working-renter base with shorter leases.
- Market conditions: Rents rising fast (+6.7%/yr); 270 active listings in the ZIP; 80 units permitted in Johnson County in 2024 (27 in 5+ unit buildings).
Forward outlook
- Local home prices are declining (-3.0%/yr); year-one equity from $747 of loan paydown is wiped out by about $3k of value loss. Plan a longer hold.
- Johnson County population projected at +6% by 2050 — modest demand growth; plan on rents tracking national, not racing it.
- At projected returns (-3.0% appreciation + 6.7% rent growth), your $30k cash investment doubles in ~8 years — after that, you're playing with house money.
Negotiation context
- Only 1 days on market — expect competitive offers; lowballing is unlikely to land.
Questions for the listing agent
- Have any recent inspections been done? Can we get a copy of the seller's disclosures and any deferred-maintenance estimates?
- Built in 1962 — when were the roof, HVAC, electrical panel, plumbing, and water heater last replaced?
- Is there a deadline driving the sale (1031 exchange, divorce, estate, relocation)? That informs how much negotiation room exists.
- Schools are B-rated — typically a magnet for longer-tenancy family renters. What's the average tenant stay here, and is there a school-zone premium baked into asking?
- Crime grade is D in this area — have there been break-ins, vandalism, or insurance claims at this property in the last 3 years? What carrier currently insures it and at what premium?
- What's the average days-on-market for RENTAL listings here right now (not sales)? A rising rental-DOM trend means longer vacancies and softer asking-rent achievability than the comps imply.
- What's the recent tenant-quality profile in this submarket — average credit score on applications, eviction rate, late-payment / NSF rate, and stable-employment percentage? A property-management company in the area should have these aggregated.
- How much new for-sale + rental construction is in the pipeline within 1–3 miles? Heavy new supply typically softens prices + rents 12–24 months out; constrained supply supports both.
Investment metrics
- 1% rule
- 1.17% ✓
- Cap rate
- 9.14%
- Cash-on-cash
- 10.16%
- DSCR
- 1.45
- GRM
- 7.1
CMA / ARV
No comps found within radius.
Projected returns pro-forma
-3.0% appreciation · 6.68% rent growth · sell at horizon
- IRR
- 3.1%
- Equity multiple
- 1.12×
- Total profit
- $3,702
- Equity at exit
- $16,103
- IRR
- 15.9%
- Equity multiple
- 2.52×
- Total profit
- $45,872
- Equity at exit
- $9,338
Cash invested: $30,240 (down + closing). Projections, not guarantees.
Landlord ↔ Tenant lean methodology
- Overall (STATE)
- 81 Strongly Landlord-Friendly
- State Missouri
- 81 Strongly Landlord-Friendly · R+10
- County
- — inherits STATE
- City
- — inherits STATE
ZIP-level market 64093
- Home prices YoY
- -33.4%
- Rents YoY
- 6.7%
- Active inventory
- 270
- Price-to-rent
- 7.1×
Monthly cashflow live
- Estimated rent
- $1,269 medium interval (Pro) →
- Mortgage (P&I)
- −$566
- Tax est. 1.5%
- −$135 /mo · $1,620/yr
- Insurance
- −$45
- HOA
- −$0
- Vacancy / Maint / Mgmt
- −$266
- Net cashflow
- $256
Break-even live
UW: 25.0% down · 7.5% · 30yr · 1.5% tax · 5.0% vac · 8.0% maint · 8.0% mgmt
Financing live
Cash to close
- Down payment
- $27,000
- Closing costs
- $3,240
- Reserves months
- —
- Total cash needed
- —
Loan-product check · same deal, 3 products live
Conventional
25% down · 7.5% · 30yr
- Down + closing
- —
- Monthly P&I
- —
- Monthly cashflow
- —
- DSCR
- —
- Eligible?
- —
Personal DTI + credit; lowest rate.
DSCR
20% down · 8.5% · 30yr
- Down + closing
- —
- Monthly P&I
- —
- Monthly cashflow
- —
- DSCR
- —
- Eligible?
- —
No personal income docs; deal must DSCR.
Hard money
10% down · 12.0% · 12mo
- Down + closing
- —
- Monthly P&I
- —
- Monthly cashflow
- —
- DSCR
- —
- Eligible?
- —
Short-term bridge; refi at stabilization.
Listing history 2 events
-
2026-06-12remarks 41-char remark
-
2026-06-12$108,000 Pending 1 DOM
ⓘ Source: listings_history table (triggers on properties + properties_extension) + one-shot
backfill from property_details.listing_events for pre-trigger history.
Nearby sold comps map
Loading sold comps map…
Walkable amenities ~0.75 mi
Loading nearby amenities…
Taxation est. · year 1
- Rental income
- $15,227
- − Mortgage interest
- −$6,050
- − Property taxes
- −$1,620
- − Insurance
- −$540
- − Repairs & maintenance
- −$1,218
- − Management
- −$1,218
- − Depreciation
- −$3,142
- Taxable income
- $1,440
- Est. tax owed @ 24.0%
- −$345
- After-tax cash flow
- $2,728/yr
For passive investors: Depreciation is non-cash, so a rental often shows a tax loss while cash-flowing — sheltering income. Rental losses are passive: they offset passive income freely, and up to $25,000/yr can offset ordinary (W-2) income if you actively participate and your MAGI is under $100k (phasing out to $0 by $150k); unused losses carry forward. On sale, claimed depreciation is recaptured at up to 25%, and gains may owe capital-gains tax (a 1031 exchange can defer both). Figures are a year-1 estimate at your 24.0% rate — not tax advice; consult a CPA.
Condition & rehab AI · 1 photo
This property requires extensive repairs and updates across all systems and areas, significantly impacting its current value and marketability.
Repairs flagged
- Major roof — No visible roof structure
- Major exterior siding — No visible siding
- Major exterior paint — No visible paint
- Major interior walls — No visible interior walls
- Major interior paint — No visible interior paint
- Major bathrooms — No visible bathrooms
- Major kitchen — No visible kitchen
- Major HVAC/mechanicals — No visible HVAC or mechanical systems
- Major landscaping — No visible landscaping
Value-add opportunities
- Both roof replacement — Critical to the home's structural integrity and appearance
- Both exterior siding and paint — Improves curb appeal and home value
- Both interior walls and paint — Enhances the home's livability and aesthetic appeal
- Both bathroom and kitchen updates — Modernizes the home and increases its marketability
- Both HVAC and mechanical systems — Ensures comfort and energy efficiency
- Both landscaping and curb appeal — Enhances the home's curb appeal and overall aesthetic
Renovation cost estimate screening
| Repair item | Severity | Est. cost |
|---|---|---|
| roof · No visible roof structure | Major | $15,000–50,000 |
| exterior siding · No visible siding | Major | $15,000–50,000 |
| exterior paint · No visible paint | Major | $15,000–50,000 |
| interior walls · No visible interior walls | Major | $15,000–50,000 |
| interior paint · No visible interior paint | Major | $15,000–50,000 |
| bathrooms · No visible bathrooms | Major | $15,000–50,000 |
| kitchen · No visible kitchen | Major | $15,000–50,000 |
| HVAC/mechanicals · No visible HVAC or mechanical systems | Major | $15,000–50,000 |
| landscaping · No visible landscaping | Major | $15,000–50,000 |
| Total estimated repair cost · 9 items | $135,000–450,000 |
Value-add ROI direction
- Both roof replacement — Critical to the home's structural integrity and appearance ↑
- Both exterior siding and paint — Improves curb appeal and home value ↑
- Both interior walls and paint — Enhances the home's livability and aesthetic appeal ↑
- Both bathroom and kitchen updates — Modernizes the home and increases its marketability ↑
- Both HVAC and mechanical systems — Ensures comfort and energy efficiency ↑
- Both landscaping and curb appeal — Enhances the home's curb appeal and overall aesthetic ↑
ⓘ Cost ranges are severity-bucket heuristics (US national rule-of-thumb). Get contractor quotes + a written scope before underwriting a rehab budget.
Schools (NCES district)
- District
- Warrensburg R-VI
- NCES district ID
- 2931020
- Math proficiency
- 30% ▼ -11.00%
- Reading proficiency
- 45% ▼ -11.00%
- Median HH income
- $43,760
- Composite
- 31.77/100
- National rank
- #5895
- State rank
- #184 of 324 in MO
Livability — Warrensburg
- Score
- 74/100
- State rank
- #71
- US rank
- #4801
Category grades
Schools grade is shown separately in the Schools card above.
Census & demographics
- County
- Johnson County · 34,718 people
- City population
- 28,199
- Metro
- Warrensburg, MO
- Population (ZIP)
- 28,199
- Household income
- $61,094
- Rent vs Own
- Severe rent burden
- 855.0
Population outlook (Johnson County) Hauer SSP2
- Today (2025)
- 55,794 people
- By 2030
- 56,861 · +1.9%
- By 2040
- 58,239 · +4.4%
- By 2050
- 59,168 · +6.0%
- By 2075
- 62,222 · +11.5%
- By 2100
- 60,118 · +7.7%
Race, ethnicity, and origin ACS 2023
- Neighborhood character
- Predominantly White (84%)
- Race & ethnicity
- White 84% Two or more races 5% Hispanic / Latino 5% Black 4% Asian 2%
- Common ancestry
- Slovak 2% Italian 2% Serbian 2%
- Foreign-born
- 2% · South Korea
- Languages at home
- 95% English-only · Spanish 2% Other Asian/Pacific 1% Other Indo-European 1%
Political lean MEDSL · Johnson
- 2024 margin
- Solid R (+39.6) · D 29.5% · R 69.1% · Other 1.4%
- 2008→2024 swing
- -27.3pp toward R · 2008: -12.2pp · 2024: -39.6pp
- All cycles
- 2024: R+39.6 2020: R+36.8 2016: R+36.9 2012: R+24.2 2008: R+12.2
Not yet ingested
- Civics
- —
Market trends
- HPI YoY
- ▼ -90.22%
- Current HPI
- 179.7251
- Rent YoY
- ▲ 6.68%
- Metro
- Warrensburg, MO
- State GDP YoY
- ▲ 1.84%
- F500 in state
- 20
Industry mix (Fortune 500 HQ in MO)
| Industry | F500 HQs | Revenue |
|---|---|---|
| Healthcare | 1 | $163B |
|
||
| Insurance | 1 | $21B |
|
||
| Industrial Technology | 1 | $17B |
|
||
| Retail | 1 | $16B |
|
||
| Industrial Distribution | 1 | $10B |
|
||
| Utilities | 1 | $9B |
|
||
Price history
2 events — show timeline
- 2026-06-10 Pending — Heartland MLS as Distributed by MLS Grid
- 2026-06-09 Listed $108,000 Heartland MLS as Distributed by MLS Grid
Cash-flow waterfall
monthlySold comps — $/sqft
last 12 mo · ≤1 miLoading sold comps…