 🏗️ New Construction
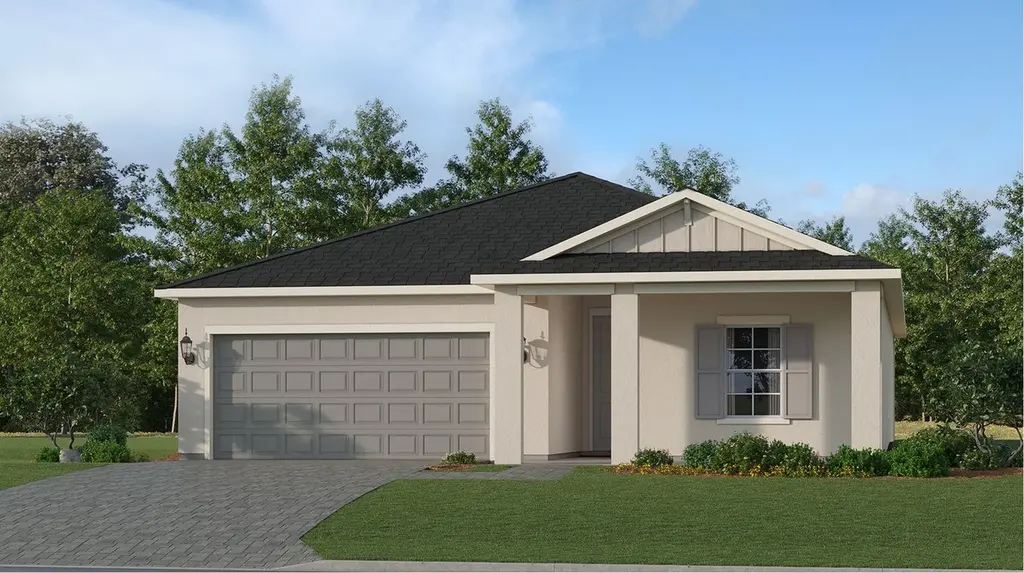
Carson Plan · Punta Gorda, FL
Flood risk No data
- FEMA flood zone
- —
- Chance of flooding over 30 yrs
- —
- Est. flood insurance / yr
- —
Fire risk No data
- Est. fire insurance / yr
- —
Heat risk No data
- Hot days now (above threshold)
- —
- Hot days in 30 yrs
- —
Wind risk No data
- Chance of severe wind over 30 yrs
- —
Air-quality risk No data
- Unhealthy air days now
- —
- Unhealthy air days in 30 yrs
- —
Risk factors via First Street. Map © Google.
Why this score? — see what drove the D grade
The composite is a weighted blend of 9 inputs, each scored 0–100. Each bar is that input's sub-score; the figure is the points it added to the 100-point composite (weight × sub-score).
- Cash flow +11.6/30.0
- ARV discount +7.5/15.0
- Schools +4.6/10.0
- Condition / age +4.0/5.0
- Livability +3.8/5.0
- DSCR +3.4/10.0
- 1% rule +3.3/10.0
- Rent growth +2.5/5.0
- Appreciation +0.0/10.0
$320,999
🖨 Deal sheet 📄 Offer letter ✓ Due diligence
Listing remarks
This new single-story home is perfect for residents who live an active lifestyle. Two secondary bedrooms share a bathroom in the hall at the front of the home, while a third is around the corner with a private bathroom. Down the foyer is the open living area, which includes a kitchen, dining room and family room with a covered patio. The owner's suite is tucked into the rear corner with an attached bathroom.
Key facts
- Attached bathroom
- Open living area
- Covered patio
Tags
Property features AI
Finance
- Financial info: List price $320,999
Exterior
- Parking: 2 covered garage spaces (2 parking spaces total)
- Home design: Carson plan (new construction, inventory type: Plan); Single-family home (Punta Gorda address)
- Construction: New construction (Carson plan)
- Exterior features: Living area of approximately 1,933 (per listing)
Interior
- Kitchen: Standard appliances included (per builder plan)
- Bedrooms: 4 bedrooms
- Bathrooms: 3 full bathrooms
- Interior features: Open living area of the Carson plan
- Laundry & utility: Laundry area included (per builder plan)
Neighborhood map
What this means for you Summary
Snapshot
- This is a 4-bed/3.0-bath single-family listed at $321k. Condition is rated good.
Deal economics
- At list price, monthly cash flow is $-124 ($-1k/yr) — negative.
- The deal already cash-flows at list — no discount required.
- Meets the 1% rule at list price ($3k rent vs $321k).
- Recommended offer: $316k (1.5% below list) — sets the bar for market timing.
- Cap rate 5.9% vs local median 2.8% in Punta Gorda — top-decile yield for the area; either an underpriced asset or a hidden risk that comps aren't pricing in. Stress-test before assuming the spread holds.
Location & tenants
- Location reads 76/100 on livability (#225 in FL, #3,567 nationally) — a middle-class / working-renter tenant base. Strengths: schools A+, crime A+, health & safety A+; Watch: cost of living D+, amenities D-, commute F.
- Charlotte (suburban): math 54% / reading 54% proficiency, ranked #22 of 73 in FL (top 30%) — acceptable for families but not a draw, mixed tenant base, ~2y average lease.
- Market conditions: 1481 active listings in the ZIP; 12 comparable units currently listed for rent nearby; rentals at typical pace (median 21d on market — plan ~3-4 weeks tenant-placement turnaround); solid renter incomes; 4,585 units permitted in Charlotte County in 2024 (703 in 5+ unit buildings).
- At $3,259/mo this rent would consume 51% of the median local household income ($77k/yr) (locally 226% of renters already pay >50% of income on rent) — very limited rent-growth headroom before tenants either downsize or default.
Forward outlook
- Local home prices are declining (-3.0%/yr); year-one equity from $3k of loan paydown is wiped out by about $12k of value loss. Plan a longer hold.
- Charlotte County population projected at +24% by 2050 — long-run rental-demand tailwind backs the buy-and-hold thesis.
Negotiation context
- It's been on market 16 days — a 2% lower offer ($316k) is reasonable based on typical stale-listing flexibility.
Questions for the listing agent
- What do current leases actually rent for vs. the listed asking? Can we see a recent rent roll and the last 12 months of T-12 income?
- Is there a deadline driving the sale (1031 exchange, divorce, estate, relocation)? That informs how much negotiation room exists.
- Schools are A-rated — typically a magnet for longer-tenancy family renters. What's the average tenant stay here, and is there a school-zone premium baked into asking?
- The area grade is low — what's the realistic commute time and amenity access for the typical tenant pool here? Any planned neighborhood developments (good or bad) we should know about?
- What's the average days-on-market for RENTAL listings here right now (not sales)? A rising rental-DOM trend means longer vacancies and softer asking-rent achievability than the comps imply.
- What's the recent tenant-quality profile in this submarket — average credit score on applications, eviction rate, late-payment / NSF rate, and stable-employment percentage? A property-management company in the area should have these aggregated.
- How much new for-sale + rental construction is in the pipeline within 1–3 miles? Heavy new supply typically softens prices + rents 12–24 months out; constrained supply supports both.
Investment metrics
- 1% rule
- 0.83% ✗
- Cap rate
- 5.91%
- Cash-on-cash
- -1.36%
- DSCR
- 0.94
- GRM
- 10.0
CMA / ARV
- ARV (on-the-fly)
- $390,466
- Comps found
- 5
Show comp detail 5 sales within ~0.75 mi
| Address | Dist | Beds/Ba | Sqft | Sold | Price | $/sf | Match |
|---|---|---|---|---|---|---|---|
| 13467 Turnleaf Blvd | 0.12mi | 4/2.5 | 2,103 (+9%) | 1mo | $316,990 | $151 | 77 |
| 13269 Turnleaf Blvd | 0.15mi | 3/3.0 (-1) | 2,217 (+15%) | 3mo | $459,999 | $207 | 61 |
| 26866 Dove Dr | 0.54mi | 3/3.5 (-1) | 2,003 (+4%) | 2mo | $459,990 | $230 | 60 |
| 13341 Turnleaf Blvd | 0.06mi | 3/2.0 (-1) | 2,201 (+14%) | 7mo | $445,000 | $202 | 60 |
| 26210 Coral Lakes Dr | 0.75mi | 3/2.5 (-1) | 2,221 (+15%) | 3mo | $395,500 | $178 | 31 |
Match score weights: distance 35% · size 25% · config 20% · recency 20%. Top-matched comps best support the ARV.
Projected returns pro-forma
-3.0% appreciation · 3.0% rent growth · sell at horizon
- IRR
- -18.5%
- Equity multiple
- 0.35×
- Total profit
- $-71,099
- Equity at exit
- $58,220
- IRR
- -10.9%
- Equity multiple
- 0.34×
- Total profit
- $-71,853
- Equity at exit
- $33,760
Cash invested: $109,330 (down + closing). Projections, not guarantees.
Landlord ↔ Tenant lean methodology
- Overall (STATE)
- 87 Strongly Landlord-Friendly
- State Florida
- 87 Strongly Landlord-Friendly · R+3
- County
- — inherits STATE
- City
- — inherits STATE
ZIP-level market 33955
- Home prices YoY
- -24.5%
- Active inventory
- 1481
- Price-to-rent
- 8.2×
Monthly cashflow live
- Estimated rent
- $3,259 medium interval (Pro) →
- Mortgage (P&I)
- −$2,048
- Tax est. 1.5%
- −$488 /mo · $5,857/yr
- Insurance
- −$163
- HOA
- −$0
- Vacancy / Maint / Mgmt
- −$684
- Net cashflow
- $-124
Break-even live
UW: 25.0% down · 7.5% · 30yr · 1.5% tax · 5.0% vac · 8.0% maint · 8.0% mgmt
Financing live
Cash to close
- Down payment
- $97,616
- Closing costs
- $11,714
- Reserves months
- —
- Total cash needed
- —
Loan-product check · same deal, 3 products live
Conventional
25% down · 7.5% · 30yr
- Down + closing
- —
- Monthly P&I
- —
- Monthly cashflow
- —
- DSCR
- —
- Eligible?
- —
Personal DTI + credit; lowest rate.
DSCR
20% down · 8.5% · 30yr
- Down + closing
- —
- Monthly P&I
- —
- Monthly cashflow
- —
- DSCR
- —
- Eligible?
- —
No personal income docs; deal must DSCR.
Hard money
10% down · 12.0% · 12mo
- Down + closing
- —
- Monthly P&I
- —
- Monthly cashflow
- —
- DSCR
- —
- Eligible?
- —
Short-term bridge; refi at stabilization.
Rent comps 12 comps
| Address | Beds | Baths | Sqft | Rent | $/sqft | DOM | Units | Dist |
|---|---|---|---|---|---|---|---|---|
| 13239 Turnleaf Blvd Punta Gorda, FL | 4.0 | 2.5 | 1874 | $2,300 | $1.23 | 13d | 1 | 0.21mi |
| 27117 Treadmill Dr Punta Gorda, FL | 5.0 | 3.0 | 2300 | $3,500 | $1.52 | 20d | 1 | 0.57mi |
| 25228 Longmeadow Dr Punta Gorda, FL | 4.0 | 2.0 | 2251 | $9,500 | $4.22 | 20d | 1 | 1.14mi |
| 25199 Longmeadow Dr Punta Gorda, FL | 3.0 | 3.0 | 2445 | $9,500 | $3.89 | 20d | 1 | 1.19mi |
| 25222 Keygrass Ct Punta Gorda, FL | 4.0 | 3.0 | 2247 | $5,000 | $2.23 | 20d | 1 | 1.28mi |
| 25078 Golden Fern Dr Punta Gorda, FL | 4.0 | 3.0 | 2477 | $13,000 | $5.25 | 20d | 1 | 1.29mi |
| 25115 Longmeadow Dr Punta Gorda, FL | 4.0 | 2.0 | 2245 | $8,500 | $3.79 | 20d | 1 | 1.30mi |
| 25191 Keygrass Ct Punta Gorda, FL | 4.0 | 2.5 | 2572 | $8,500 | $3.30 | 20d | 1 | 1.33mi |
| 13263 Valrico Ter Punta Gorda, FL | 3.0 | 2.0 | 1628 | $1,500 | $0.92 | 20d | 1 | 1.36mi |
| 25018 Longmeadow Dr Punta Gorda, FL | 4.0 | 3.0 | 2251 | $9,500 | $4.22 | 20d | 1 | 1.46mi |
| 14051 Heritage Landing Blvd Punta Gorda, FL | 2.0–3.0 | 2.0 | 1280 | $6,000 | $4.69 | 20d | 2 | 1.48mi |
| 14061 Heritage Landing Blvd Punta Gorda, FL | 2.0–3.0 | 2.0 | 1302 | $6,500 | $4.99 | 20d | 3 | 1.50mi |
Listing history 12 events
-
2026-06-18days on market $320,999 Active 16 DOM
-
2026-06-17days on market $320,999 Active 15 DOM
-
2026-06-16days on market $320,999 Active 14 DOM
-
2026-06-15days on market $320,999 Active 13 DOM
-
2026-06-14days on market $320,999 Active 11 DOM
-
2026-06-13days on market $320,999 Active 10 DOM
-
2026-06-10days on market $320,999 Active 8 DOM
-
2026-06-09days on market $320,999 Active 7 DOM
-
2026-06-08days on market $320,999 Active 6 DOM
-
2026-06-05days on market $320,999 Active 2 DOM
-
2026-06-03remarks 411-char remark
-
2026-06-03$320,999 Active 1 DOM
ⓘ Source: listings_history table (triggers on properties + properties_extension) + one-shot
backfill from property_details.listing_events for pre-trigger history.
Nearby sold comps map
Loading sold comps map…
Walkable amenities ~0.75 mi
Loading nearby amenities…
Taxation est. · year 1
- Rental income
- $39,110
- − Mortgage interest
- −$21,872
- − Property taxes
- −$5,857
- − Insurance
- −$1,952
- − Repairs & maintenance
- −$3,129
- − Management
- −$3,129
- − Depreciation
- −$11,359
- Taxable loss
- −$8,188
- Est. tax savings @ 24.0%
- +$1,965
- After-tax cash flow
- $481/yr
For passive investors: Depreciation is non-cash, so a rental often shows a tax loss while cash-flowing — sheltering income. Rental losses are passive: they offset passive income freely, and up to $25,000/yr can offset ordinary (W-2) income if you actively participate and your MAGI is under $100k (phasing out to $0 by $150k); unused losses carry forward. On sale, claimed depreciation is recaptured at up to 25%, and gains may owe capital-gains tax (a 1031 exchange can defer both). Figures are a year-1 estimate at your 24.0% rate — not tax advice; consult a CPA.
Condition & rehab AI · 12 photos
This move-in-ready single-story home offers a modern and well-maintained living space with a covered patio and ample natural light.
Value-add opportunities
- Both Landscaping and patio furniture — Enhances curb appeal and outdoor living space
- Both Smart home integration — Improves convenience and energy efficiency
- Both Smart thermostat — Saves energy and improves comfort
Renovation cost estimate screening
Value-add ROI direction
- Both Landscaping and patio furniture — Enhances curb appeal and outdoor living space ↑
- Both Smart home integration — Improves convenience and energy efficiency ↑
- Both Smart thermostat — Saves energy and improves comfort ↑
ⓘ Cost ranges are severity-bucket heuristics (US national rule-of-thumb). Get contractor quotes + a written scope before underwriting a rehab budget.
Schools (NCES district)
- District
- Charlotte
- NCES district ID
- 1200240
- Math proficiency
- 54% ▼ -6.00%
- Reading proficiency
- 54% ▼ -1.00%
- Median HH income
- $44,864
- Composite
- 45.62/100
- National rank
- #2586
- State rank
- #22 of 73 in FL
Livability — Punta Gorda
- Score
- 76/100
- State rank
- #225
- US rank
- #3567
Category grades
Schools grade is shown separately in the Schools card above.
Census & demographics
- County
- Charlotte County · 196,994 people
- City population
- 68,831
- Metro
- Punta Gorda, FL
- Population (ZIP)
- 12,399
- Household income
- $76,943
- Rent vs Own
- Severe rent burden
- 226.0
Population outlook (Charlotte County) Hauer SSP2
- Today (2025)
- 198,646 people
- By 2030
- 210,507 · +6.0%
- By 2040
- 230,857 · +16.2%
- By 2050
- 247,148 · +24.4%
- By 2075
- 281,777 · +41.8%
- By 2100
- 293,609 · +47.8%
Race, ethnicity, and origin ACS 2023
- Neighborhood character
- Predominantly White (84%)
- Race & ethnicity
- White 84% Hispanic / Latino 10% Two or more races 9% Black 2%
- Hispanic origin (detail)
- Mexican 4% Puerto Rican 2% Cuban 4%
- Common ancestry
- Romanian 5% Italian 3% Serbian 3%
- Foreign-born
- 8% · Canada
- Languages at home
- 91% English-only · Spanish 5% Other Indo-European 1%
Political lean MEDSL · Charlotte
- 2024 margin
- Solid R (+34.0) · D 32.7% · R 66.7%
- 2008→2024 swing
- -26.7pp toward R · 2008: -7.2pp · 2024: -34.0pp
- All cycles
- 2024: R+34.0 2020: R+26.6 2016: R+27.8 2012: R+14.3 2008: R+7.2
Not yet ingested
- Civics
- —
Market trends
- HPI YoY
- ▼ -78.71%
- Current HPI
- 242.9043
- Rent YoY
- —
- Metro
- Punta Gorda, FL
- State GDP YoY
- ▲ 3.28%
- F500 in state
- 36
Industry mix (Fortune 500 HQ in FL)
| Industry | F500 HQs | Revenue |
|---|---|---|
| Industrial Technology | 2 | $29B |
|
||
| Insurance | 2 | $17B |
|
||
| Retail | 1 | $60B |
|
||
| Technology Distribution | 1 | $58B |
|
||
| Homebuilding | 1 | $35B |
|
||
| Technology Manufacturing | 1 | $35B |
|
||
Cash-flow waterfall
monthlySold comps — $/sqft
last 12 mo · ≤1 miLoading sold comps…