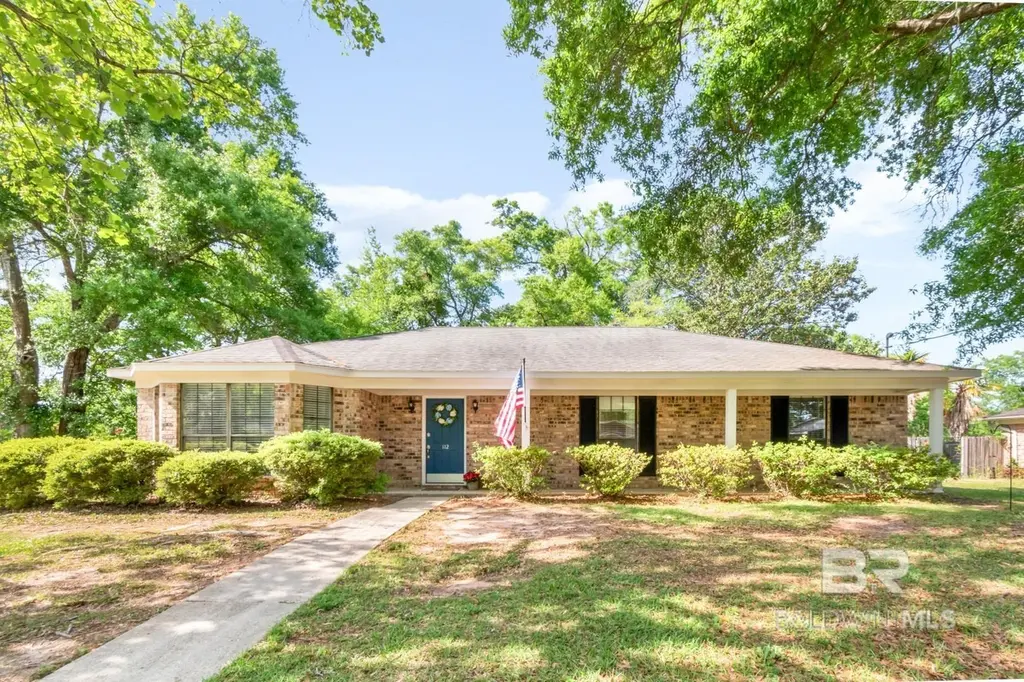
112 Baratara Dr · Chickasaw, AL
Flood risk 1/10 · Minimal
- FEMA flood zone
- X (unshaded)
- Chance of flooding over 30 yrs
- 0.0%
- Est. flood insurance / yr
- $507 – $1,088
Fire risk 2/10 · Minimal
- Est. fire insurance / yr
- $916 – $1,700
Heat risk 9/10 · Severe
- Hot days now (above 104°F)
- 7 days/yr
- Hot days in 30 yrs
- 22 days/yr
Wind risk 9/10 · Severe
- Chance of severe wind over 30 yrs
- 99.0%
Air-quality risk 2/10 · Minimal
- Unhealthy air days now
- 1 days/yr
- Unhealthy air days in 30 yrs
- 2 days/yr
Risk factors via First Street. Map © Google.
Why this score? — see what drove the D- grade
The composite is a weighted blend of 9 inputs, each scored 0–100. Each bar is that input's sub-score; the figure is the points it added to the 100-point composite (weight × sub-score).
- Cash flow +10.6/30.0
- Appreciation +10.0/10.0
- Schools +5.0/10.0
- DSCR +3.1/10.0
- Livability +3.1/5.0
- Rent growth +2.5/5.0
- Condition / age +2.5/5.0
- 1% rule +1.9/10.0
- ARV discount +0.3/15.0
$214,900
🖨 Deal sheet (PDF) 📄 Offer letter ✓ Due diligence
Listing remarks
Welcome to a home that truly stands out for how well it lives day to day. With four bedrooms plus a dedicated office and an additional flex/playroom, this layout offers a level of versatility that is hard to find in this price range. Whether you need space to work from home, create, stay organized, or simply spread out, this home gives you options without compromise. The large main living area features vaulted ceilings and a cozy fireplace, creating a central gathering space that feels both open and inviting. A nice primary suite with walk-in closet and ensuite bath, 3 additional bedrooms PLUS and office and flex space great for variety of uses—gaming, crafting, hobby space, media roo
Key facts
- Flex playroom
- Primary suite
- Dedicated office
Tags
Property features AI
Finance
- HOA & community: No community features; No transfer fees
Exterior
- Parking: Double carport (2 covered carport spaces); 4 total parking spaces
- Utilities: Public water; Public sewer; Electric service
- Home design: Single-family residence; One story; Resale property
- Construction: Brick construction; Slab foundation; Composition roof; Built area recorded as 2,320 square feet
- Exterior features: Termite protection contract; Fenced yard; Front porch; Boat ramp access; Less than one acre lot; No waterfront
Interior
- Kitchen: Dishwasher; Electric range; Refrigerator
- Bedrooms: Primary bedroom with attached bath; First-floor primary bedroom; Walk-in closet(s)
- Flooring: Carpet; Vinyl
- Bathrooms: 2 full bathrooms
- Heating & cooling: Central electric cooling; Central electric heating
- Interior features: Bonus room; Family room; Entrance foyer; Living room; Media room; Office / study; Additional room(s) (see remarks); Ceiling fans; En-suite; Vaulted ceilings; Wood-burning fireplace
- Laundry & utility: Electric water heater
Neighborhood map
What this means for you Summary
Snapshot
- This is a 3-bed/2.0-bath single-family listed at $215k.
Deal economics
- At list price, monthly cash flow is $-106 ($-1k/yr) — negative.
- To cash-flow at today's rent, offer at most $196k (8.7% below list).
- To meet the 1% rule (rent ≥ 1% of price), the offer needs to be $148k (31.0% below list).
- Recommended offer: $148k (31.0% below list) — sets the bar for 1% rule.
- Cap rate 5.7% vs local median 7.2% in Chickasaw — below-typical yield; the buyer is paying a premium for something (appreciation thesis, condition, location) that the cap rate doesn't capture.
Location & tenants
- Location reads 61/100 on livability (#237 in AL) — a middle-class / working-renter tenant base. Strengths: cost of living A+, housing A-, health & safety B; Watch: schools F, crime D-, amenities F.
- Market conditions: 45 active listings in the ZIP; 3 comparable units currently listed for rent nearby; rentals at typical pace (median 14d on market — plan ~3-4 weeks tenant-placement turnaround); 1,678 units permitted in Mobile County in 2024 (264 in 5+ unit buildings).
Forward outlook
- In year one you build about $23k of equity ($1k loan paydown + $21k appreciation (10.0% local appreciation)).
- Mobile County population projected to shrink 8% by 2050 — rents likely to lag national; underwrite the cash flow, not the appreciation.
- By year 2, paydown + projected appreciation supports a ~$37k cash-out refi (75% LTV) — recoverable capital for the next deal without selling this one.
Negotiation context
- Only 9 days on market — expect competitive offers; lowballing is unlikely to land.
- Current owner paid $108k; list at $215k implies a 100% gain — meaningful room to come down on a strong offer.
Risks & watch-outs
- Climate carrying-cost: severe wind risk, 99% chance of damaging wind over 30y; extreme-heat days projected 7→22/yr by 2055 (HVAC capex compounding) — expect insurance premiums to compound above CPI over the hold.
Questions for the listing agent
- What do current leases actually rent for vs. the listed asking? Can we see a recent rent roll and the last 12 months of T-12 income?
- Is there a deadline driving the sale (1031 exchange, divorce, estate, relocation)? That informs how much negotiation room exists.
- Schools are F-rated, which usually means shorter tenancies and higher turnover. Who's the typical renter profile here, and what's been the actual vacancy rate?
- Crime grade is D in this area — have there been break-ins, vandalism, or insurance claims at this property in the last 3 years? What carrier currently insures it and at what premium?
- The area grade is low — what's the realistic commute time and amenity access for the typical tenant pool here? Any planned neighborhood developments (good or bad) we should know about?
- What's the average days-on-market for RENTAL listings here right now (not sales)? A rising rental-DOM trend means longer vacancies and softer asking-rent achievability than the comps imply.
- What's the recent tenant-quality profile in this submarket — average credit score on applications, eviction rate, late-payment / NSF rate, and stable-employment percentage? A property-management company in the area should have these aggregated.
- How much new for-sale + rental construction is in the pipeline within 1–3 miles? Heavy new supply typically softens prices + rents 12–24 months out; constrained supply supports both.
Investment metrics
- 1% rule
- 0.69% ✗
- Cap rate
- 5.70%
- Cash-on-cash
- -2.11%
- DSCR
- 0.91
- GRM
- 12.1
CMA / ARV
- ARV (on-the-fly)
- $185,397
- Comps found
- 11
Show comp detail 11 sales within ~0.75 mi
| Address | Dist | Beds/Ba | Sqft | Sold | Price | $/sf | Match |
|---|---|---|---|---|---|---|---|
| 122 Baratara Dr | 0.11mi | 3/2.0 | 2,219 (+4%) | 7mo | $181,500 | $82 | 82 |
| 112 Baratara Dr | 0.00mi | 4/2.0 (+1) | 2,320 (+9%) | 0mo | $218,400 | $94 | 80 |
| 509 Sutherland Dr | 0.30mi | 3/2.0 | 2,084 (-2%) | 7mo | $209,000 | $100 | 76 |
| 224 Cache Cir | 0.08mi | 4/2.5 (+1) | 2,032 (-5%) | 8mo | $220,000 | $108 | 75 |
| 212 Idlewood Dr | 0.13mi | 3/2.0 | 2,095 (-2%) | 21mo | $170,000 | $81 | 74 |
| 117 Idlewood Dr | 0.32mi | 3/2.0 | 2,101 (-1%) | 19mo | $110,000 | $52 | 67 |
| 118 Baratara Dr | 0.08mi | 4/2.5 (+1) | 2,000 (-6%) | 21mo | $205,000 | $103 | 61 |
| 706 Sutherland Dr | 0.18mi | 3/2.5 | 2,360 (+11%) | 13mo | $205,000 | $87 | 61 |
| 37 Ridgeview Dr | 0.52mi | 4/3.0 (+1) | 2,000 (-6%) | 8mo | $196,500 | $98 | 50 |
| 307 Myrtlewood Ave | 0.52mi | 4/2.0 (+1) | 1,922 (-10%) | 10mo | $110,000 | $57 | 46 |
| 203 Idlewood Dr | 0.27mi | 4/3.0 (+1) | 2,334 (+10%) | 21mo | $83,000 | $36 | 45 |
Match score weights: distance 35% · size 25% · config 20% · recency 20%. Top-matched comps best support the ARV.
Projected returns pro-forma
10.0% appreciation · 3.0% rent growth · sell at horizon
- IRR
- 22.8%
- Equity multiple
- 2.83×
- Total profit
- $110,212
- Equity at exit
- $193,599
- IRR
- 20.3%
- Equity multiple
- 6.48×
- Total profit
- $329,632
- Equity at exit
- $417,503
Cash invested: $60,172 (down + closing). Projections, not guarantees.
Landlord ↔ Tenant lean methodology
- Overall (STATE)
- 90 Strongly Landlord-Friendly
- State Alabama
- 90 Strongly Landlord-Friendly · R+15
- County
- — inherits STATE
- City
- — inherits STATE
ZIP-level market 36611
- Home prices YoY
- 7.0%
- Active inventory
- 45
- Price-to-rent
- 12.1×
Monthly cashflow live
- Estimated rent
- $1,483 medium interval (Pro) →
- Mortgage (P&I)
- −$1,127
- Tax from tax record
- −$60 /mo · $723/yr
- Insurance
- −$90
- HOA
- −$0
- Vacancy / Maint / Mgmt
- −$311
- Net cashflow
- $-106
Break-even live
Sensitivity live
| Price | -10% $16 | -5% $-45 | +0% $-106 | +5% $-166 | +10% $-227 |
|---|---|---|---|---|---|
| Rent | -10% $-223 | -5% $-164 | +0% $-106 | +5% $-47 | +10% $12 |
| Rate | -1.0pp $3 | -0.5pp $-51 | base $-106 | +0.5pp $-161 | +1.0pp $-218 |
UW: 25.0% down · 7.5% · 30yr · 1.5% tax · 5.0% vac · 8.0% maint · 8.0% mgmt
Financing live
Cash to close
- Down payment
- $53,725
- Closing costs
- $6,447
- Reserves months
- —
- Total cash needed
- —
Loan-product check · same deal, 3 products live
Conventional
25% down · 7.5% · 30yr
- Down + closing
- —
- Monthly P&I
- —
- Monthly cashflow
- —
- DSCR
- —
- Eligible?
- —
Personal DTI + credit; lowest rate.
DSCR
20% down · 8.5% · 30yr
- Down + closing
- —
- Monthly P&I
- —
- Monthly cashflow
- —
- DSCR
- —
- Eligible?
- —
No personal income docs; deal must DSCR.
Hard money
10% down · 12.0% · 12mo
- Down + closing
- —
- Monthly P&I
- —
- Monthly cashflow
- —
- DSCR
- —
- Eligible?
- —
Short-term bridge; refi at stabilization.
Rent comps 3 comps
| Address | Beds | Baths | Sqft | Rent | $/sqft | DOM | Units | Dist |
|---|---|---|---|---|---|---|---|---|
| 78 Lee St Chickasaw, AL | 3.0 | 1.0 | 1412 | $1,100 | $0.78 | 44d | 1 | 0.90mi |
| 219 2nd St Chickasaw, AL | 4.0 | 2.0 | 1916 | $1,650 | $0.86 | 14d | 1 | 0.94mi |
| 314 1st St Chickasaw, AL | 4.0 | 3.0 | 2136 | $1,595 | $0.75 | 14d | 1 | 0.94mi |
Listing history 3 events
-
2026-04-29status Pending
-
2026-04-20$214,900 Active
-
2014-06-30soldstatus $107,625
ⓘ Source: listings_history table (triggers on properties + properties_extension) + one-shot
backfill from property_details.listing_events for pre-trigger history.
Tax reassessment forecast AL · Resets to sale price
- Current annual tax
- $723 · $60/mo
- Projected year-2 tax
- $881 · $73/mo
- Expected delta
- +$158/yr (+$13/mo · 21.9%)
ⓘ Screening estimate from a state-policy table — verify with the county assessor before closing.
Climate risk First Street
- Flood 1/10 Low FEMA zone X (unshaded) · 0% chance over 30 yrs
- Wildfire 2/10 Low
- Heat 9/10 Extreme 7 d/yr ≥104°F today · 22 d/yr by 30 yrs out
- Wind 9/10 Extreme 99% chance of damaging wind over 30 yrs
- Air quality 2/10 Low 1 unhealthy d/yr today · 2 by 30 yrs out
Nearby sold comps map
Loading sold comps map…
Walkable amenities ~0.75 mi
Loading nearby amenities…
Taxation est. · year 1
- Rental income
- $17,790
- − Mortgage interest
- −$12,038
- − Property taxes
- −$723
- − Insurance
- −$1,074
- − Repairs & maintenance
- −$1,423
- − Management
- −$1,423
- − Depreciation
- −$6,252
- Taxable loss
- −$5,143
- Est. tax savings @ 24.0%
- +$1,234
- After-tax cash flow
- $-32/yr
For passive investors: Depreciation is non-cash, so a rental often shows a tax loss while cash-flowing — sheltering income. Rental losses are passive: they offset passive income freely, and up to $25,000/yr can offset ordinary (W-2) income if you actively participate and your MAGI is under $100k (phasing out to $0 by $150k); unused losses carry forward. On sale, claimed depreciation is recaptured at up to 25%, and gains may owe capital-gains tax (a 1031 exchange can defer both). Figures are a year-1 estimate at your 24.0% rate — not tax advice; consult a CPA.
Schools (NCES district)
No district data.
Livability — Chickasaw
- Score
- 61/100
- State rank
- #237
- US rank
- #17438
Category grades
Schools grade is shown separately in the Schools card above.
Census & demographics
- Census place
- Chickasaw, AL
- City population
- 6,367
- Population (ZIP)
- 6,367
Population outlook (Mobile County) Hauer SSP2
- Today (2025)
- 415,303 people
- By 2030
- 411,755 · -0.9%
- By 2040
- 399,670 · -3.8%
- By 2050
- 382,616 · -7.9%
- By 2075
- 337,353 · -18.8%
- By 2100
- 283,391 · -31.8%
Race, ethnicity, and origin ACS 2023
- Neighborhood character
- Diverse neighborhood (Simpson 0.56)
- Race & ethnicity
- Black 55% White 38% Two or more races 4% Hispanic / Latino 2% Asian 2%
- Common ancestry
- Lithuanian 2% Serbian 1% Italian 1%
- Foreign-born
- 3% · Canada, China
- Languages at home
- 98% English-only · Spanish 1% French/Haitian/Cajun 1%
Political lean MEDSL · Mobile
- 2024 margin
- R (+16.4) · D 41.3% · R 57.7%
- 2008→2024 swing
- -7.7pp toward R · 2008: -8.7pp · 2024: -16.4pp
- All cycles
- 2024: R+16.4 2020: R+11.9 2016: R+13.9 2012: R+9.3 2008: R+8.7
Not yet ingested
- Civics
- —
Market trends
- HPI YoY
- ▲ 12.90%
- Current HPI
- 196.621
- Rent YoY
- —
- Metro
- —
- State GDP YoY
- ▲ 2.94%
- F500 in state
- 4
Industry mix (Fortune 500 HQ in AL)
| Industry | F500 HQs | Revenue |
|---|---|---|
| Financial Services | 1 | $8B |
|
||
| Healthcare | 1 | $5B |
|
||
Price history
+99.7% since first listed3 events — show timeline
- 2026-04-29 Pending — BCAR
- 2026-04-20 Listed $214,900 BCAR
- 2014-06-30 Sold (Public Records) $107,625 Public Records
Property tax history
+5.1%/yrLatest (2025): $723 · +14.2% YoY. Source: county tax records.
Cash-flow waterfall
monthlySold comps — $/sqft
last 12 mo · ≤1 miLoading sold comps…