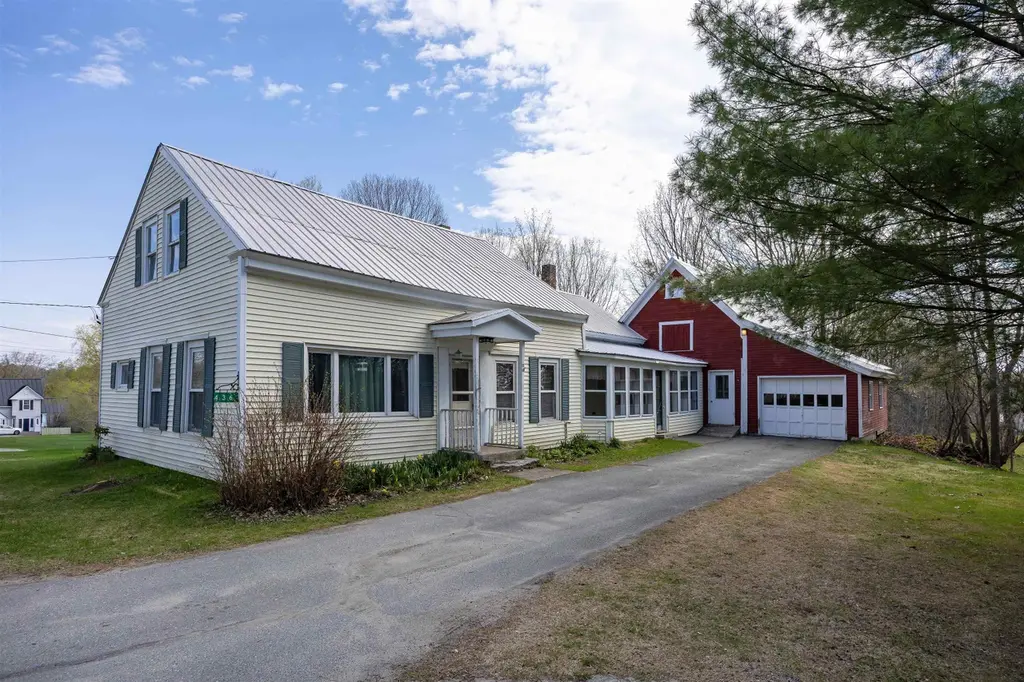
436 Hill St · Danville, VT
Flood risk 1/10 · Minimal
- FEMA flood zone
- X
- Chance of flooding over 30 yrs
- 0.0%
- Est. flood insurance / yr
- $473 – $860
Fire risk 1/10 · Minimal
- Est. fire insurance / yr
- $480 – $892
Heat risk 1/10 · Minimal
- Hot days now (above 89°F)
- 7 days/yr
- Hot days in 30 yrs
- 17 days/yr
Wind risk 2/10 · Minimal
- Chance of severe wind over 30 yrs
- 4.0%
Air-quality risk 2/10 · Minimal
- Unhealthy air days now
- 1 days/yr
- Unhealthy air days in 30 yrs
- 1 days/yr
Risk factors via First Street. Map © Google.
Why this score? — see what drove the D grade
The composite is a weighted blend of 9 inputs, each scored 0–100. Each bar is that input's sub-score; the figure is the points it added to the 100-point composite (weight × sub-score).
- ARV discount +15.0/15.0
- Appreciation +10.0/10.0
- Schools +5.0/10.0
- Cash flow +3.7/30.0
- Livability +3.1/5.0
- Rent growth +2.5/5.0
- Condition / age +2.5/5.0
- 1% rule +0.0/10.0
- DSCR +0.0/10.0
$235,000
🖨 Deal sheet 📄 Offer letter ✓ Due diligence
Listing remarks MLS
Spacious home with nice yard in Danville village walking distance from the Green. This home has been the retirement home for the present owners for the past 34 years; now they are moving on. It features large rooms and convenient spaces. There are a lovely screened porch, lots of storage and workshop space, an attached garage plus a basement garage under the barn. The windows have been replace, the roof is new, and there is a new septic system. Don't let the cats out when showing the house.
Key facts
- 0.63 acre lot
- Garage
- Built 1875
Property features AI
Exterior
- Parking: 1-car garage
- Utilities: Public water; Septic system; Circuit breaker electrical panel; Electric service by GMP; Fuel service by Dead River; Cable internet available
- Home design: Cape-style home; Existing structure; Facing direction not specified; Entry level not specified
- Construction: Built in 1875; Wood frame construction; Metal roof
- Exterior features: Near paths; In a neighborhood; Near schools; Paved, public maintained road frontage (139' frontage); Dirt driveway
Interior
- Bathrooms: 1 full bathroom
- Heating & cooling: Hot air heating
- Interior features: 6 rooms; Unfinished basement with interior access
Neighborhood map
What this means for you Summary
Snapshot
- This is a 2-bed/1.0-bath single-family listed at $235k.
Deal economics
- At list price, monthly cash flow is $-692 ($-8k/yr) — negative.
- To cash-flow at today's rent, offer at most $113k (52.0% below list).
- To meet the 1% rule (rent ≥ 1% of price), the offer needs to be $110k (53.1% below list).
- Recommended offer: $110k (53.1% below list) — sets the bar for 1% rule.
Location & tenants
- Location reads 62/100 on livability (#74 in VT) — a middle-class / working-renter tenant base. Strengths: cost of living A-, housing A-; Watch: amenities F, commute F, health & safety F.
- Market conditions: 10 active listings in the ZIP; 112 units permitted in Caledonia County in 2024 (15 in 5+ unit buildings).
Forward outlook
- In year one you build about $25k of equity ($2k loan paydown + $24k appreciation (10.0% local appreciation)).
- Caledonia County population projected at -20% by 2050 — secular population decline; favor cash flow + early exit over multi-decade hold.
- By year 2, paydown + projected appreciation supports a ~$40k cash-out refi (75% LTV) — recoverable capital for the next deal without selling this one.
Negotiation context
- It's been on market 43 days — a 3% lower offer ($228k) is reasonable based on typical stale-listing flexibility.
- 3 sale attempts since 13y ago; this cycle's ask has dropped $54k (19%) from the opening price — seller is motivated, your offer sets the floor, not the list.
- Current owner paid $104k; list at $235k implies a 127% gain — meaningful room to come down on a strong offer.
Risks & watch-outs
- Watch-outs: built in 1875 — expect roof / HVAC / electrical / plumbing capex.
Questions for the listing agent
- What do current leases actually rent for vs. the listed asking? Can we see a recent rent roll and the last 12 months of T-12 income?
- It's been on market 43 days. Have you received any prior offers? Is the seller open to a 53% concession, seller financing, or rate buy-down credit?
- Built in 1875 — when were the roof, HVAC, electrical panel, plumbing, and water heater last replaced?
- Is there a deadline driving the sale (1031 exchange, divorce, estate, relocation)? That informs how much negotiation room exists.
- The area grade is low — what's the realistic commute time and amenity access for the typical tenant pool here? Any planned neighborhood developments (good or bad) we should know about?
- What's the average days-on-market for RENTAL listings here right now (not sales)? A rising rental-DOM trend means longer vacancies and softer asking-rent achievability than the comps imply.
- What's the recent tenant-quality profile in this submarket — average credit score on applications, eviction rate, late-payment / NSF rate, and stable-employment percentage? A property-management company in the area should have these aggregated.
- How much new for-sale + rental construction is in the pipeline within 1–3 miles? Heavy new supply typically softens prices + rents 12–24 months out; constrained supply supports both.
Investment metrics
- 1% rule
- 0.47% ✗
- Cap rate
- 2.76%
- Cash-on-cash
- -12.62%
- DSCR
- 0.44
- GRM
- 17.8
CMA / ARV
- ARV (median comp)
- $394,729
- List price
- $235,000
- Delta
- -40.47%
- Verdict
- UNDERPRICED
- Comps
- 8 within 1.0 mi
Show comp detail 1 sale within ~0.75 mi
| Address | Dist | Beds/Ba | Sqft | Sold | Price | $/sf | Match |
|---|---|---|---|---|---|---|---|
| 331 Bruce Badger Memorial Hwy | 0.50mi | 3/2.5 (+1) | 2,152 (+4%) | 13mo | $480,000 | $223 | 48 |
Match score weights: distance 35% · size 25% · config 20% · recency 20%. Top-matched comps best support the ARV.
Projected returns pro-forma
10.0% appreciation · 3.0% rent growth · sell at horizon
- IRR
- 15.5%
- Equity multiple
- 2.27×
- Total profit
- $83,885
- Equity at exit
- $211,707
- IRR
- 15.0%
- Equity multiple
- 5.28×
- Total profit
- $281,649
- Equity at exit
- $456,553
Cash invested: $65,800 (down + closing). Projections, not guarantees.
Landlord ↔ Tenant lean methodology
- Overall (STATE)
- 41 Moderately Tenant-Leaning
- State Vermont
- 41 Moderately Tenant-Leaning · D+15
- County
- — inherits STATE
- City
- — inherits STATE
ZIP-level market 05828
- Home prices YoY
- 17.4%
- Active inventory
- 10
- Price-to-rent
- 17.8×
Monthly cashflow live
- Estimated rent
- $1,101 medium interval (Pro) →
- Mortgage (P&I)
- −$1,232
- Tax from tax record
- −$232 /mo · $2,781/yr
- Insurance
- −$98
- HOA
- −$0
- Vacancy / Maint / Mgmt
- −$231
- Net cashflow
- $-692
Break-even live
UW: 25.0% down · 7.5% · 30yr · 1.5% tax · 5.0% vac · 8.0% maint · 8.0% mgmt
Financing live
Cash to close
- Down payment
- $58,750
- Closing costs
- $7,050
- Reserves months
- —
- Total cash needed
- —
Loan-product check · same deal, 3 products live
Conventional
25% down · 7.5% · 30yr
- Down + closing
- —
- Monthly P&I
- —
- Monthly cashflow
- —
- DSCR
- —
- Eligible?
- —
Personal DTI + credit; lowest rate.
DSCR
20% down · 8.5% · 30yr
- Down + closing
- —
- Monthly P&I
- —
- Monthly cashflow
- —
- DSCR
- —
- Eligible?
- —
No personal income docs; deal must DSCR.
Hard money
10% down · 12.0% · 12mo
- Down + closing
- —
- Monthly P&I
- —
- Monthly cashflow
- —
- DSCR
- —
- Eligible?
- —
Short-term bridge; refi at stabilization.
Listing history 20 events
-
2026-06-18days on market $235,000 Active 43 DOM
-
2026-06-17days on market $235,000 Active 42 DOM
-
2026-06-16days on market $235,000 Active 41 DOM
-
2026-06-15days on market $235,000 Active 40 DOM
-
2026-06-15days on market $235,000 Active 39 DOM
-
2026-06-13pricestatusdays on market $235,000 Active 38 DOM
-
2026-06-12days on market $259,000 Active with Contract 37 DOM
-
2026-06-09days on market $259,000 Active with Contract 34 DOM
-
2026-06-08days on market $259,000 Active with Contract 33 DOM
-
2026-06-08days on market $259,000 Active with Contract 32 DOM
-
2026-06-05days on market $259,000 Active with Contract 30 DOM
-
2026-06-03days on market $259,000 Active with Contract 28 DOM
-
2026-06-02days on market $259,000 Active with Contract 27 DOM
-
2026-06-01days on market $259,000 Active with Contract 26 DOM
-
2026-05-31days on market $259,000 Active with Contract 25 DOM
-
2026-05-15price $259,000 1239-char remark
-
2026-05-04$289,000 Active 1239-char remark
-
2014-10-03soldstatus $103,500
-
2014-09-30soldstatus $103,500 495-char remark
Show marketing remark (495 chars)
Spacious home with nice yard in Danville village walking distance from the Green. This home has been the retirement home for the present owners for the past 34 years; now they are moving on. It features large rooms and convenient spaces. There are a lovely screened porch, lots of storage and workshop space, an attached garage plus a basement garage under the barn. The windows have been replace, the roof is new, and there is a new septic system. Don't let the cats out when showing the house.
-
2013-09-20$119,000 495-char remark
Show marketing remark (495 chars)
Spacious home with nice yard in Danville village walking distance from the Green. This home has been the retirement home for the present owners for the past 34 years; now they are moving on. It features large rooms and convenient spaces. There are a lovely screened porch, lots of storage and workshop space, an attached garage plus a basement garage under the barn. The windows have been replace, the roof is new, and there is a new septic system. Don't let the cats out when showing the house.
ⓘ Source: listings_history table (triggers on properties + properties_extension) + one-shot
backfill from property_details.listing_events for pre-trigger history.
Tax reassessment forecast VT · Partial reset (capped growth)
- Current annual tax
- $2,781 · $232/mo
- Projected year-2 tax
- $3,623 · $302/mo
- Expected delta
- +$842/yr (+$70/mo · 30.3%)
ⓘ Screening estimate from a state-policy table — verify with the county assessor before closing.
Climate risk First Street
- Flood 1/10 Low FEMA zone X · 0% chance over 30 yrs
- Wildfire 1/10 Low
- Heat 1/10 Low 7 d/yr ≥89°F today · 17 d/yr by 30 yrs out
- Wind 2/10 Low 4% chance of damaging wind over 30 yrs
- Air quality 2/10 Low 1 unhealthy d/yr today · 1 by 30 yrs out
Nearby sold comps map
Loading sold comps map…
Walkable amenities ~0.75 mi
Loading nearby amenities…
Taxation est. · year 1
- Rental income
- $13,213
- − Mortgage interest
- −$13,164
- − Property taxes
- −$2,781
- − Insurance
- −$1,175
- − Repairs & maintenance
- −$1,057
- − Management
- −$1,057
- − Depreciation
- −$6,836
- Taxable loss
- −$12,856
- Est. tax savings @ 24.0%
- +$3,086
- After-tax cash flow
- $-5,220/yr
For passive investors: Depreciation is non-cash, so a rental often shows a tax loss while cash-flowing — sheltering income. Rental losses are passive: they offset passive income freely, and up to $25,000/yr can offset ordinary (W-2) income if you actively participate and your MAGI is under $100k (phasing out to $0 by $150k); unused losses carry forward. On sale, claimed depreciation is recaptured at up to 25%, and gains may owe capital-gains tax (a 1031 exchange can defer both). Figures are a year-1 estimate at your 24.0% rate — not tax advice; consult a CPA.
Schools (NCES district)
No district data.
Livability — Danville
- Score
- 62/100
- State rank
- #74
- US rank
- #16492
Category grades
Schools grade is shown separately in the Schools card above.
Census & demographics
- Census place
- Danville, VT
- Population (ZIP)
- 2,042
Population outlook (Caledonia County) Hauer SSP2
- Today (2025)
- 29,828 people
- By 2030
- 28,820 · -3.4%
- By 2040
- 26,262 · -12.0%
- By 2050
- 23,780 · -20.3%
- By 2075
- 18,516 · -37.9%
- By 2100
- 13,647 · -54.2%
Race, ethnicity, and origin ACS 2023
- Neighborhood character
- Predominantly White (95%)
- Race & ethnicity
- White 95% Two or more races 3% Hispanic / Latino 2%
- Common ancestry
- Lithuanian 14% Slovak 13% Italian 3%
- Foreign-born
- 1% · Canada
- Languages at home
- 97% English-only · French/Haitian/Cajun 1% Spanish 1%
Political lean MEDSL · Caledonia
- 2024 margin
- D (+12.4) · D 54.5% · R 42.0% · Other 3.5%
- 2008→2024 swing
- -10.8pp toward R · 2008: 23.3pp · 2024: 12.4pp
- All cycles
- 2024: D+12.4 2020: D+15.2 2016: D+7.0 2012: D+22.9 2008: D+23.3
Not yet ingested
- Civics
- —
Market trends
- HPI YoY
- ▲ 43.58%
- Current HPI
- 294.4133
- Rent YoY
- —
- Metro
- —
- State GDP YoY
- —
- F500 in state
- 0
Price history
+97.5% since first listed8 events — show timeline
- 2026-06-13 Price Changed $235,000 PrimeMLS
- 2026-06-12 Relisted — PrimeMLS
- 2026-05-29 Contingent — PrimeMLS
- 2026-05-15 Price Changed $259,000 PrimeMLS
- 2026-05-04 Listed $289,000 PrimeMLS
- 2014-10-03 Sold (Public Records) $103,500 Public Records
- 2014-09-30 Sold (MLS) $103,500 PrimeMLS
- 2013-09-20 Listed $119,000 PrimeMLS
Property tax history
+1.7%/yrLatest (2024): $2,781 · +16.7% YoY. Source: county tax records.
Cash-flow waterfall
monthlySold comps — $/sqft
last 12 mo · ≤1 miLoading sold comps…