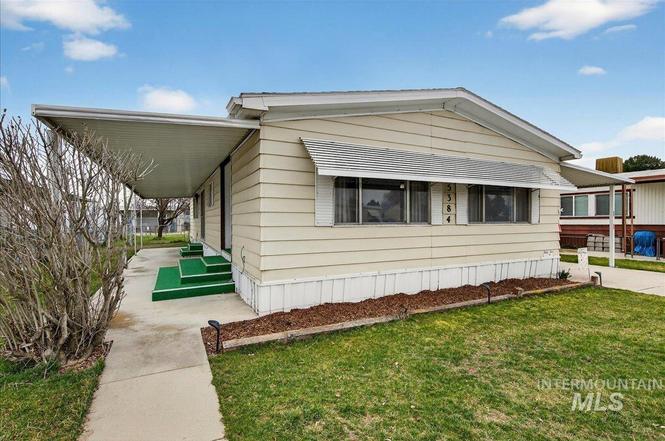
5384 N Glencrest Ln · Boise City, ID
Flood risk 1/10 · Minimal
- FEMA flood zone
- X (unshaded)
- Chance of flooding over 30 yrs
- 0.0%
- Est. flood insurance / yr
- $507 – $1,088
Fire risk 8/10 · Major
- Est. fire insurance / yr
- $584 – $1,086
Heat risk 4/10 · Minor
- Hot days now (above 97°F)
- 7 days/yr
- Hot days in 30 yrs
- 18 days/yr
Wind risk 1/10 · Minimal
- Chance of severe wind over 30 yrs
- —
Air-quality risk 9/10 · Severe
- Unhealthy air days now
- 19 days/yr
- Unhealthy air days in 30 yrs
- 19 days/yr
Risk factors via First Street. Map © Google.
Why this score? — see what drove the B+ grade
The composite is a weighted blend of 9 inputs, each scored 0–100. Each bar is that input's sub-score; the figure is the points it added to the 100-point composite (weight × sub-score).
- Cash flow +30.0/30.0
- ARV discount +10.4/15.0
- 1% rule +10.0/10.0
- DSCR +10.0/10.0
- Appreciation +5.0/10.0
- Schools +4.2/10.0
- Rent growth +2.5/5.0
- Livability +2.5/5.0
- Condition / age +2.5/5.0
$114,500
🖨 Deal sheet 📄 Offer letter ✓ Due diligence
Listing remarks
Park-edge privacy in Glenbrier 55+ Estates! $3,000 seller credit available with acceptable offer. This well-maintained 1,440 sq. ft. home offers 3 bedrooms and 2 bathrooms and sits along the edge of the park with no backyard neighbors, creating a peaceful and private setting. The comfortable layout provides great living space, while covered parking and a covered patio make it easy to enjoy the outdoors. The large backyard offers, new sprinkler system, plenty of room for gardening, relaxing, or entertaining and includes a convenient storage shed. A wonderful opportunity to enjoy quiet community living with extra outdoor space. Great location near shopping, easy to the foothills and downtown.
Key facts
- Covered parking
- Large backyard
- Covered patio
Tags
Property features AI
Finance
- Other: Senior community; Subdivision: Glenbrier; MLS area: Boise NW - 0800
- HOA & community: Over-55 community
Exterior
- Parking: Carport
- Utilities: City water service; Sewer connected
- Home design: Mobile/manufactured home on a rented lot; Located in an over-55 community
- Construction: Vinyl siding; Composition roof; Built in 1980
- Exterior features: Covered patio/deck; Metal fencing; Storage shed; Auto sprinkler system; Full sprinkler system; Paved road access
Interior
- Kitchen: Dishwasher; Disposal; Microwave; Oven/Range (freestanding); Refrigerator
- Bedrooms: 3 bedrooms, all on the main level
- Flooring: Carpet; Vinyl
- Bathrooms: 2 bathrooms
- Heating & cooling: Electric heating; Central air conditioning
- Interior features: Main-level master bedroom; Guest room; Breakfast bar; Laminate counters
- Laundry & utility: Electric water heater
Neighborhood map
What this means for you Summary
Snapshot
- This is a 3-bed/2.0-bath manufactured listed at $114k.
Deal economics
- At list price, monthly cash flow is $670 ($8k/yr) — positive.
- The deal already cash-flows at list — no discount required.
- Meets the 1% rule at list price ($2k rent vs $114k).
- Recommended offer: $104k (9.0% below list) — sets the bar for market timing.
- Cap rate 13.3% vs local median 2.6% in Boise City — top-decile yield for the area; either an underpriced asset or a hidden risk that comps aren't pricing in. Stress-test before assuming the spread holds.
Location & tenants
- Location reads: area grade B — affects rentability + tenant quality, not the cash-flow math above.
- Boise Independent District (urban): math 42% / reading 56% proficiency, ranked #36 of 92 in ID (top 39%) — families likely to look elsewhere, expect single-tenant / working-renter base with shorter leases.
- Zoned schools: Pierce Park Elementary School (math 42% / reading 57%, grade D, #148 of 357 statewide, top 47%, 219 students, 27% FRL); Capital Senior High School (math 34% / reading 57%, grade D-, #59 of 169 statewide, top 35%, 1,220 students, 28% FRL).
- Market conditions: 1 active listings in the ZIP; 17 comparable units currently listed for rent nearby; rentals leasing fast (median 3d on market — plan ~1-2 weeks tenant-placement turnaround); 5,129 units permitted in Ada County in 2024 (414 in 5+ unit buildings).
Forward outlook
- In year one you build about $4k of equity ($792 loan paydown + $3k appreciation (3.0% local appreciation)).
- Ada County population projected at +45% by 2050 — long-run rental-demand tailwind backs the buy-and-hold thesis.
- At projected returns (3.0% appreciation + 3.0% rent growth), your $32k cash investment doubles in ~3 years — after that, you're playing with house money.
- By year 8, paydown + projected appreciation supports a ~$31k cash-out refi (75% LTV) — recoverable capital for the next deal without selling this one.
Negotiation context
- It's been on market 97 days — a 9% lower offer ($104k) is reasonable based on typical stale-listing flexibility.
Risks & watch-outs
- Climate carrying-cost: severe wildfire risk — expect insurance premiums to compound above CPI over the hold.
Questions for the listing agent
- It's been on market 97 days. Have you received any prior offers? Is the seller open to a 9% concession, seller financing, or rate buy-down credit?
- Why hasn't it sold? Are there any deal-killer items the seller is aware of (foundation, flood, title, zoning, code violations)?
- Is there a deadline driving the sale (1031 exchange, divorce, estate, relocation)? That informs how much negotiation room exists.
- What's the average days-on-market for RENTAL listings here right now (not sales)? A rising rental-DOM trend means longer vacancies and softer asking-rent achievability than the comps imply.
- What's the recent tenant-quality profile in this submarket — average credit score on applications, eviction rate, late-payment / NSF rate, and stable-employment percentage? A property-management company in the area should have these aggregated.
- How much new for-sale + rental construction is in the pipeline within 1–3 miles? Heavy new supply typically softens prices + rents 12–24 months out; constrained supply supports both.
Investment metrics
- 1% rule
- 1.62% ✓
- Cap rate
- 13.32%
- Cash-on-cash
- 25.08%
- DSCR
- 2.12
- GRM
- 5.2
CMA / ARV
- ARV (on-the-fly)
- $122,400
- Comps found
- 12
Show comp detail 12 sales within ~0.75 mi
| Address | Dist | Beds/Ba | Sqft | Sold | Price | $/sf | Match |
|---|---|---|---|---|---|---|---|
| 5298 N North Glen Ln | 0.11mi | 3/2.0 | 1,416 (-2%) | 15mo | $95,000 | $67 | 79 |
| 6972 Royal Glen Ln | 0.02mi | 3/2.0 | 1,335 (-7%) | 13mo | $88,000 | $66 | 76 |
| 7098 W Royal Glen Ln | 0.07mi | 2/2.0 (-1) | 1,568 (+9%) | 9mo | $129,000 | $82 | 70 |
| 5388 N Glencrest Ln | 0.02mi | 2/2.0 (-1) | 1,245 (-14%) | 11mo | $99,900 | $80 | 62 |
| 5609 Sudley Ln | 0.68mi | 3/2.0 | 1,440 (0%) | 10mo | $135,000 | $94 | 60 |
| 5511 Glenbrier Ln | 0.10mi | 2/2.0 (-1) | 1,248 (-13%) | 11mo | $127,000 | $102 | 59 |
| 5307 N Glen | 0.10mi | 2/2.0 (-1) | 1,296 (-10%) | 20mo | $97,900 | $76 | 57 |
| 5657 Sudley Ln | 0.65mi | 2/2.0 (-1) | 1,403 (-3%) | 7mo | $130,000 | $93 | 54 |
| 8043 W Manassas Ln | 0.60mi | 3/2.0 | 1,512 (+5%) | 16mo | $219,900 | $145 | 51 |
| 8215 W Appomattox Ln | 0.65mi | 2/2.0 (-1) | 1,536 (+7%) | 9mo | $130,000 | $85 | 46 |
| 8173 Appomattox Ln | 0.61mi | 2/2.0 (-1) | 1,344 (-7%) | 14mo | $97,500 | $73 | 43 |
| 5580 N Confederate | 0.61mi | 2/2.0 (-1) | 1,584 (+10%) | 9mo | $181,000 | $114 | 43 |
Match score weights: distance 35% · size 25% · config 20% · recency 20%. Top-matched comps best support the ARV.
Projected returns pro-forma
3.0% appreciation · 3.0% rent growth · sell at horizon
- IRR
- 31.2%
- Equity multiple
- 2.76×
- Total profit
- $56,497
- Equity at exit
- $51,484
- IRR
- 31.5%
- Equity multiple
- 5.41×
- Total profit
- $141,373
- Equity at exit
- $79,343
Cash invested: $32,060 (down + closing). Projections, not guarantees.
Landlord ↔ Tenant lean methodology
- Overall (STATE)
- 91 Strongly Landlord-Friendly
- State Idaho
- 91 Strongly Landlord-Friendly · R+18
- County
- — inherits STATE
- City
- — inherits STATE
ZIP-level market 83714-2326
- Active inventory
- 1
- Price-to-rent
- 5.2×
Monthly cashflow live
- Estimated rent
- $1,850 high interval (Pro) →
- Mortgage (P&I)
- −$600
- Tax est. 1.5%
- −$143 /mo · $1,718/yr
- Insurance
- −$48
- HOA
- −$0
- Vacancy / Maint / Mgmt
- −$388
- Net cashflow
- $670
Break-even live
UW: 25.0% down · 7.5% · 30yr · 1.5% tax · 5.0% vac · 8.0% maint · 8.0% mgmt
Financing live
Cash to close
- Down payment
- $28,625
- Closing costs
- $3,435
- Reserves months
- —
- Total cash needed
- —
Loan-product check · same deal, 3 products live
Conventional
25% down · 7.5% · 30yr
- Down + closing
- —
- Monthly P&I
- —
- Monthly cashflow
- —
- DSCR
- —
- Eligible?
- —
Personal DTI + credit; lowest rate.
DSCR
20% down · 8.5% · 30yr
- Down + closing
- —
- Monthly P&I
- —
- Monthly cashflow
- —
- DSCR
- —
- Eligible?
- —
No personal income docs; deal must DSCR.
Hard money
10% down · 12.0% · 12mo
- Down + closing
- —
- Monthly P&I
- —
- Monthly cashflow
- —
- DSCR
- —
- Eligible?
- —
Short-term bridge; refi at stabilization.
Rent comps 17 comps
| Address | Beds | Baths | Sqft | Rent | $/sqft | DOM | Units | Dist |
|---|---|---|---|---|---|---|---|---|
| 5497 N Pierce Park Ln Unit 53-101 Boise, ID | 2.0 | 1.5 | 880 | $1,495 | $1.70 | 14d | 1 | 0.29mi |
| 5497 N Pierce Park Ln Boise, ID | 2.0 | 1.5 | 880 | $1,445 | $1.64 | 2d | 3 | 0.29mi |
| 5497 N Pierce Park Ln Unit 79-202 Boise, ID | 2.0 | 1.5 | 880 | $1,395 | $1.59 | 14d | 1 | 0.29mi |
| 6473 W Parapet Dr Unit 1 Boise, ID | 4.0 | 2.5 | 1396 | $2,300 | $1.65 | 3d | 1 | 0.33mi |
| 7570 W State St Boise, ID | 1.0–4.0 | 1.0–2.5 | 1236 | $2,183 | $1.77 | 2d | 21 | 0.35mi |
| 5967 N Pierce Park Ln Boise, ID | 3.0 | 2.0 | 1302 | $1,795 | $1.38 | 23d | 1 | 0.46mi |
| 6589 W Lucky Ln Boise, ID | 2.0 | 2.0 | 1025 | $1,450 | $1.41 | 19d | 1 | 0.46mi |
| 7456 W Limelight Ct Boise, ID | 3.0 | 2.0 | 1278 | $2,095 | $1.64 | 3d | 1 | 0.52mi |
| 6474 W Lucky Ln Unit 12202 Boise, ID | 2.0 | 2.0 | 1100 | $1,500 | $1.36 | 23d | 1 | 0.54mi |
| 4807 N Fortune Ln Unit 201 Boise, ID | 2.0 | 2.0 | 925 | $1,245 | $1.35 | 14d | 1 | 0.54mi |
| 6077 N Tarako Ave Boise, ID | 3.0 | 2.5 | 1583 | $2,172 | $1.37 | 2d | 2 | 0.74mi |
| 6200 N River Pointe Ln Garden City, ID | 1.0–3.0 | 1.0–2.0 | 1000 | $3,157 | $3.16 | 2d | 8 | 0.76mi |
| 7228 W Rygate Dr Boise, ID | 3.0 | 2.5 | 1395 | $2,345 | $1.68 | 23d | 1 | 0.93mi |
| 6043 W Port Pl Unit 104 Boise, ID | 2.0 | 2.0 | 950 | $1,345 | $1.42 | 3d | 1 | 0.94mi |
| 5821 N Cobbler Ln Boise, ID | 3.0 | 2.5 | 1285 | $2,050 | $1.60 | 11d | 1 | 1.19mi |
| 7356 N Lucy Rose Ln Apt 104 Boise, ID | 3.0 | 3.0 | 1300 | $1,895 | $1.46 | 3d | 1 | 1.20mi |
| 9557 W State St Garden City, ID | 3.0 | 2.0 | 1242 | $1,850 | $1.49 | 2d | 1 | 1.47mi |
Listing history 17 events
-
2026-06-18days on market $114,500 Active 97 DOM
-
2026-06-17days on market $114,500 Active 96 DOM
-
2026-06-16days on market $114,500 Active 95 DOM
-
2026-06-15days on market $114,500 Active 94 DOM
-
2026-06-13days on market $114,500 Active 92 DOM
-
2026-06-10days on market $114,500 Active 89 DOM
-
2026-06-09days on market $114,500 Active 88 DOM
-
2026-06-08days on market $114,500 Active 87 DOM
-
2026-06-07days on market $114,500 Active 86 DOM
-
2026-06-05days on market $114,500 Active 83 DOM
-
2026-06-03days on market $114,500 Active 82 DOM
-
2026-06-03days on market $114,500 Active 81 DOM
-
2026-06-01days on market $114,500 Active 80 DOM
-
2026-05-31days on market $114,500 Active 79 DOM
-
2026-04-30price $119,500
-
2026-03-25price $124,500
-
2026-03-13$129,900 Active
ⓘ Source: listings_history table (triggers on properties + properties_extension) + one-shot
backfill from property_details.listing_events for pre-trigger history.
Climate risk First Street
- Flood 1/10 Low FEMA zone X (unshaded) · 0% chance over 30 yrs
- Wildfire 8/10 Severe
- Heat 4/10 Moderate 7 d/yr ≥97°F today · 18 d/yr by 30 yrs out
- Wind 1/10 Low
- Air quality 9/10 Extreme 19 unhealthy d/yr today · 19 by 30 yrs out
Nearby sold comps map
Loading sold comps map…
Walkable amenities ~0.75 mi
Loading nearby amenities…
Taxation est. · year 1
- Rental income
- $22,198
- − Mortgage interest
- −$6,414
- − Property taxes
- −$1,718
- − Insurance
- −$572
- − Repairs & maintenance
- −$1,776
- − Management
- −$1,776
- − Depreciation
- −$3,331
- Taxable income
- $6,611
- Est. tax owed @ 24.0%
- −$1,587
- After-tax cash flow
- $6,454/yr
For passive investors: Depreciation is non-cash, so a rental often shows a tax loss while cash-flowing — sheltering income. Rental losses are passive: they offset passive income freely, and up to $25,000/yr can offset ordinary (W-2) income if you actively participate and your MAGI is under $100k (phasing out to $0 by $150k); unused losses carry forward. On sale, claimed depreciation is recaptured at up to 25%, and gains may owe capital-gains tax (a 1031 exchange can defer both). Figures are a year-1 estimate at your 24.0% rate — not tax advice; consult a CPA.
Schools (NCES district)
- District
- Boise Independent District
- NCES district ID
- 1600360
- Math proficiency
- 42% ▼ -5.00%
- Reading proficiency
- 56% ▼ -1.00%
- Median HH income
- $49,135
- Composite
- 41.82/100
- National rank
- #3388
- State rank
- #36 of 92 in ID
Livability — Boise City
No livability data for this city. (Only ~50 U.S. cities are tracked.)
Census & demographics
- Census place
- Boise City, ID
Population outlook (Ada County) Hauer SSP2
- Today (2025)
- 535,818 people
- By 2030
- 585,751 · +9.3%
- By 2040
- 682,435 · +27.4%
- By 2050
- 775,818 · +44.8%
- By 2075
- 994,458 · +85.6%
- By 2100
- 1,148,884 · +114.4%
Not yet ingested
- Political lean
- —
- Race & ethnicity
- —
- Common origin
- —
- Civics
- —
Market trends
- HPI YoY
- —
- Current HPI
- —
- Rent YoY
- —
- Metro
- —
- State GDP YoY
- ▲ 4.51%
- F500 in state
- 6
Industry mix (Fortune 500 HQ in ID)
| Industry | F500 HQs | Revenue |
|---|---|---|
| Retail | 1 | $79B |
|
||
| Technology | 1 | $25B |
|
||
| Food / Agriculture | 1 | $6B |
|
||
Price history
-8.0% since first listed3 events — show timeline
- 2026-04-30 Price Changed $119,500 IMLS
- 2026-03-25 Price Changed $124,500 IMLS
- 2026-03-13 Listed $129,900 IMLS
Cash-flow waterfall
monthlySold comps — $/sqft
last 12 mo · ≤1 miLoading sold comps…