310 E Broadway Ave · Panhandle, TX
Flood risk 1/10 · Minimal
- FEMA flood zone
- X
- Chance of flooding over 30 yrs
- 0.0%
- Est. flood insurance / yr
- $507 – $1,088
Fire risk 6/10 · Moderate
- Est. fire insurance / yr
- $1,222 – $2,270
Heat risk 5/10 · Moderate
- Hot days now (above 99°F)
- 7 days/yr
- Hot days in 30 yrs
- 20 days/yr
Wind risk 2/10 · Minimal
- Chance of severe wind over 30 yrs
- —
Air-quality risk 2/10 · Minimal
- Unhealthy air days now
- 1 days/yr
- Unhealthy air days in 30 yrs
- 1 days/yr
Risk factors via First Street. Map © Google.
Why this score? — see what drove the C+ grade
The composite is a weighted blend of 9 inputs, each scored 0–100. Each bar is that input's sub-score; the figure is the points it added to the 100-point composite (weight × sub-score).
- Cash flow +25.8/30.0
- DSCR +8.6/10.0
- 1% rule +8.1/10.0
- ARV discount +7.5/15.0
- Schools +5.8/10.0
- Livability +4.0/5.0
- Rent growth +2.5/5.0
- Condition / age +2.5/5.0
- Appreciation +0.0/10.0
$72,749
🖨 Deal sheet 📄 Offer letter ✓ Due diligence
Listing remarks MLS
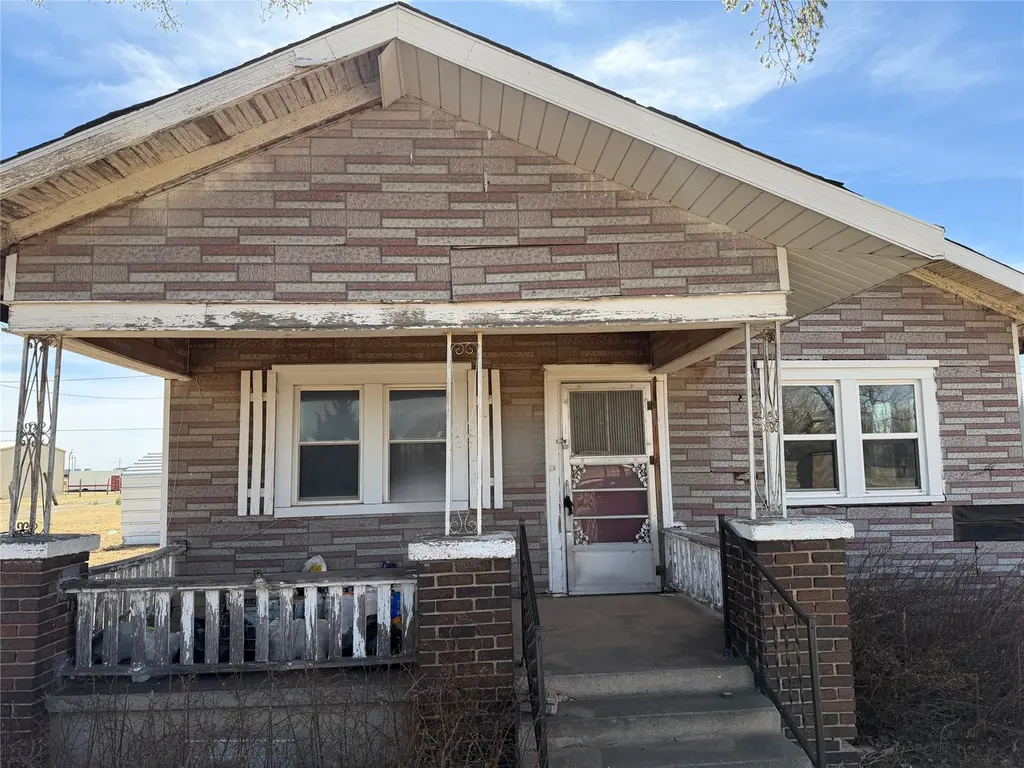
JUST LISTED! 310 E Broadway is a FIXER UPPER located on a LARGE LOT home that is now available in the Panhandle area. The property sits on nearly a third of acre lot of land is down the road from Hwy 60 and just 30 minutes from Amarillo, TX. It boasts three bedrooms, one bathroom, and a basement type of area. Some notable features of the home include the cozy layout and accents throughout the home and a fabulous covered front porch area that overlooks the front yard. This is a fixer-upper opportunity you can quickly transform into a charming home. This property is being sold AS IS but it has a lot of potential. WE MAKE IT EASY TO OWN. This is a great opportunity! Don't wait, call us today to get more information on the owner's easy terms and smooth process that may be able to put the deed in your name and this your dream home.
Key facts
- Covered front porch
- Panhandle area
- Large lot
Tags
Neighborhood map
What this means for you Summary
Snapshot
- This is a 3-bed/1.0-bath single-family listed at $73k.
Deal economics
- At list price, monthly cash flow is $176 ($2k/yr) — positive.
- The deal already cash-flows at list — no discount required.
- Meets the 1% rule at list price ($950 rent vs $73k).
- Recommended offer: $64k (12.0% below list) — sets the bar for market timing.
Location & tenants
- Location reads 81/100 on livability (#21 in TX, #1,354 nationally) — a professional / high-income tenant draw. Strengths: schools A+, crime A+, employment A+; Watch: amenities F, commute F.
- Panhandle ISD (rural): math 73% / reading 61% proficiency, ranked #27 of 826 in TX (top 3%) — acceptable for families but not a draw, mixed tenant base, ~2y average lease.
- Market conditions: 23 active listings in the ZIP; 1 comparable units currently listed for rent nearby; 39 units permitted in Carson County in 2024 (0 in 5+ unit buildings).
Forward outlook
- Local home prices are declining (-3.0%/yr); year-one equity from $503 of loan paydown is wiped out by about $2k of value loss. Plan a longer hold.
- Carson County population projected at -11% by 2050 — secular population decline; favor cash flow + early exit over multi-decade hold.
Negotiation context
- It's been on market 255 days — a 12% lower offer ($64k) is reasonable based on typical stale-listing flexibility.
- 2 sale attempts since 2y ago with the ask held roughly flat each time — persistent listings suggest the price (not the market) is what's stuck; bring a comps-based counter.
Risks & watch-outs
- Watch-outs: property tax is 2.7% of price; built in 1924 — expect roof / HVAC / electrical / plumbing capex.
- Climate carrying-cost: major wildfire risk; extreme-heat days projected 7→20/yr by 2055 (HVAC capex compounding) — expect insurance premiums to compound above CPI over the hold.
Questions for the listing agent
- It's been on market 255 days. Have you received any prior offers? Is the seller open to a 12% concession, seller financing, or rate buy-down credit?
- Built in 1924 — when were the roof, HVAC, electrical panel, plumbing, and water heater last replaced?
- Property tax is high relative to price — has the assessment been appealed recently, and will the sale trigger a re-assessment?
- Why hasn't it sold? Are there any deal-killer items the seller is aware of (foundation, flood, title, zoning, code violations)?
- Is there a deadline driving the sale (1031 exchange, divorce, estate, relocation)? That informs how much negotiation room exists.
- Schools are A-rated — typically a magnet for longer-tenancy family renters. What's the average tenant stay here, and is there a school-zone premium baked into asking?
- What's the average days-on-market for RENTAL listings here right now (not sales)? A rising rental-DOM trend means longer vacancies and softer asking-rent achievability than the comps imply.
- What's the recent tenant-quality profile in this submarket — average credit score on applications, eviction rate, late-payment / NSF rate, and stable-employment percentage? A property-management company in the area should have these aggregated.
- How much new for-sale + rental construction is in the pipeline within 1–3 miles? Heavy new supply typically softens prices + rents 12–24 months out; constrained supply supports both.
Investment metrics
- 1% rule
- 1.31% ✓
- Cap rate
- 9.20%
- Cash-on-cash
- 10.38%
- DSCR
- 1.46
- GRM
- 6.4
CMA / ARV
No comps found within radius.
Projected returns pro-forma
-3.0% appreciation · 3.0% rent growth · sell at horizon
- IRR
- -0.7%
- Equity multiple
- 0.98×
- Total profit
- $-509
- Equity at exit
- $10,847
- IRR
- 9.1%
- Equity multiple
- 1.70×
- Total profit
- $14,243
- Equity at exit
- $6,290
Cash invested: $20,370 (down + closing). Projections, not guarantees.
Landlord ↔ Tenant lean methodology
- Overall (STATE)
- 87 Strongly Landlord-Friendly
- State Texas
- 87 Strongly Landlord-Friendly · R+5
- County
- — inherits STATE
- City
- — inherits STATE
ZIP-level market 79068
- Home prices YoY
- -17.0%
- Active inventory
- 23
- Price-to-rent
- 6.4×
Monthly cashflow live
- Estimated rent
- $950 medium interval (Pro) →
- Mortgage (P&I)
- −$382
- Tax from tax record
- −$162 /mo · $1,950/yr
- Insurance
- −$30
- HOA
- −$0
- Vacancy / Maint / Mgmt
- −$200
- Net cashflow
- $176
Break-even live
UW: 25.0% down · 7.5% · 30yr · 1.5% tax · 5.0% vac · 8.0% maint · 8.0% mgmt
Financing live
Cash to close
- Down payment
- $18,187
- Closing costs
- $2,182
- Reserves months
- —
- Total cash needed
- —
Loan-product check · same deal, 3 products live
Conventional
25% down · 7.5% · 30yr
- Down + closing
- —
- Monthly P&I
- —
- Monthly cashflow
- —
- DSCR
- —
- Eligible?
- —
Personal DTI + credit; lowest rate.
DSCR
20% down · 8.5% · 30yr
- Down + closing
- —
- Monthly P&I
- —
- Monthly cashflow
- —
- DSCR
- —
- Eligible?
- —
No personal income docs; deal must DSCR.
Hard money
10% down · 12.0% · 12mo
- Down + closing
- —
- Monthly P&I
- —
- Monthly cashflow
- —
- DSCR
- —
- Eligible?
- —
Short-term bridge; refi at stabilization.
Rent comps 1 comps
| Address | Beds | Baths | Sqft | Rent | $/sqft | DOM | Units | Dist |
|---|---|---|---|---|---|---|---|---|
| 601 Pecan Ave Unit 403 Panhandle, TX | 2.0 | 1.0 | 1000 | $950 | $0.95 | 13d | 1 | 0.81mi |
Listing history 18 events
-
2026-06-18days on market $72,749 Active 255 DOM
-
2026-06-17days on market $72,749 Active 254 DOM
-
2026-06-16days on market $72,749 Active 253 DOM
-
2026-06-15days on market $72,749 Active 252 DOM
-
2026-06-14days on market $72,749 Active 250 DOM
-
2026-06-13days on market $72,749 Active 249 DOM
-
2026-06-10days on market $72,749 Active 247 DOM
-
2026-06-09days on market $72,749 Active 246 DOM
-
2026-06-08days on market $72,749 Active 245 DOM
-
2026-06-07days on market $72,749 Active 244 DOM
-
2026-06-03days on market $72,749 Active 240 DOM
-
2026-06-02days on market $72,749 Active 239 DOM
-
2026-06-01days on market $72,749 Active 238 DOM
-
2026-05-31days on market $72,749 Active 237 DOM
-
2026-05-30days on market $72,749 Active 236 DOM
-
2025-10-06$72,749 Active 838-char remark
Show marketing remark (838 chars)
JUST LISTED! 310 E Broadway is a FIXER UPPER located on a LARGE LOT home that is now available in the Panhandle area. The property sits on nearly a third of acre lot of land is down the road from Hwy 60 and just 30 minutes from Amarillo, TX. It boasts three bedrooms, one bathroom, and a basement type of area. Some notable features of the home include the cozy layout and accents throughout the home and a fabulous covered front porch area that overlooks the front yard. This is a fixer-upper opportunity you can quickly transform into a charming home. This property is being sold AS IS but it has a lot of potential. WE MAKE IT EASY TO OWN. This is a great opportunity! Don't wait, call us today to get more information on the owner's easy terms and smooth process that may be able to put the deed in your name and this your dream home.
-
2025-09-10historical
-
2024-09-10$72,749 Active
ⓘ Source: listings_history table (triggers on properties + properties_extension) + one-shot
backfill from property_details.listing_events for pre-trigger history.
Tax reassessment forecast TX · Resets to sale price
- Current annual tax
- $1,950 · $162/mo
- Projected year-2 tax
- $1,950 · $162/mo
- Expected delta
- $0/yr ($0/mo · 0.0%)
ⓘ Screening estimate from a state-policy table — verify with the county assessor before closing.
Climate risk First Street
- Flood 1/10 Low FEMA zone X · 0% chance over 30 yrs
- Wildfire 6/10 Major
- Heat 5/10 Major 7 d/yr ≥99°F today · 20 d/yr by 30 yrs out
- Wind 2/10 Low
- Air quality 2/10 Low 1 unhealthy d/yr today · 1 by 30 yrs out
Nearby sold comps map
Loading sold comps map…
Walkable amenities ~0.75 mi
Loading nearby amenities…
Taxation est. · year 1
- Rental income
- $11,400
- − Mortgage interest
- −$4,075
- − Property taxes
- −$1,950
- − Insurance
- −$364
- − Repairs & maintenance
- −$912
- − Management
- −$912
- − Depreciation
- −$2,116
- Taxable income
- $1,071
- Est. tax owed @ 24.0%
- −$257
- After-tax cash flow
- $1,857/yr
For passive investors: Depreciation is non-cash, so a rental often shows a tax loss while cash-flowing — sheltering income. Rental losses are passive: they offset passive income freely, and up to $25,000/yr can offset ordinary (W-2) income if you actively participate and your MAGI is under $100k (phasing out to $0 by $150k); unused losses carry forward. On sale, claimed depreciation is recaptured at up to 25%, and gains may owe capital-gains tax (a 1031 exchange can defer both). Figures are a year-1 estimate at your 24.0% rate — not tax advice; consult a CPA.
Schools (NCES district)
- District
- Panhandle ISD
- NCES district ID
- 4834230
- Math proficiency
- 73% ▲ 4.00%
- Reading proficiency
- 61% ▼ -1.00%
- Median HH income
- $63,893
- Composite
- 58.27/100
- National rank
- #1021
- State rank
- #27 of 826 in TX
Livability — Panhandle
- Score
- 81/100
- State rank
- #21
- US rank
- #1354
Category grades
Schools grade is shown separately in the Schools card above.
Census & demographics
- Census place
- Panhandle, TX
- Population (ZIP)
- 3,124
Population outlook (Carson County) Hauer SSP2
- Today (2025)
- 5,631 people
- By 2030
- 5,516 · -2.0%
- By 2040
- 5,190 · -7.8%
- By 2050
- 5,007 · -11.1%
- By 2075
- 4,509 · -19.9%
- By 2100
- 3,458 · -38.6%
Race, ethnicity, and origin ACS 2023
- Neighborhood character
- Predominantly White (77%)
- Race & ethnicity
- White 77% Hispanic / Latino 13% Two or more races 5% Native American 3% Pacific Islander 2%
- Hispanic origin (detail)
- Mexican 8%
- Common ancestry
- Slovak 2% Italian 2% Romanian 1%
- Foreign-born
- 3% · Canada
- Languages at home
- 98% English-only · Spanish 2%
Political lean MEDSL · Carson
- 2024 margin
- Solid R (+81.2) · D 9.1% · R 90.3%
- 2008→2024 swing
- -9.3pp toward R · 2008: -71.9pp · 2024: -81.2pp
- All cycles
- 2024: R+81.2 2020: R+79.5 2016: R+80.4 2012: R+77.8 2008: R+71.9
Not yet ingested
- Civics
- —
Market trends
- HPI YoY
- ▼ -34.95%
- Current HPI
- 171.0533
- Rent YoY
- —
- Metro
- —
- State GDP YoY
- ▲ 3.95%
- F500 in state
- 110
Industry mix (Fortune 500 HQ in TX)
| Industry | F500 HQs | Revenue |
|---|---|---|
| Energy | 16 | $1,198B |
|
||
| Technology | 5 | $198B |
|
||
| Engineering / Construction | 4 | $72B |
|
||
| Energy Services | 3 | $60B |
|
||
| Utilities | 3 | $41B |
|
||
| Healthcare | 2 | $330B |
|
||
Price history
+0.0% since first listed3 events — show timeline
- 2025-10-06 Listed $72,749 HARMLS
- 2025-09-10 Listing Removed — HARMLS
- 2024-09-10 Listed $72,749 HARMLS
Property tax history
+10.8%/yrLatest (2025): $1,950 · +86.7% YoY. Source: county tax records.
Cash-flow waterfall
monthlySold comps — $/sqft
last 12 mo · ≤1 miLoading sold comps…