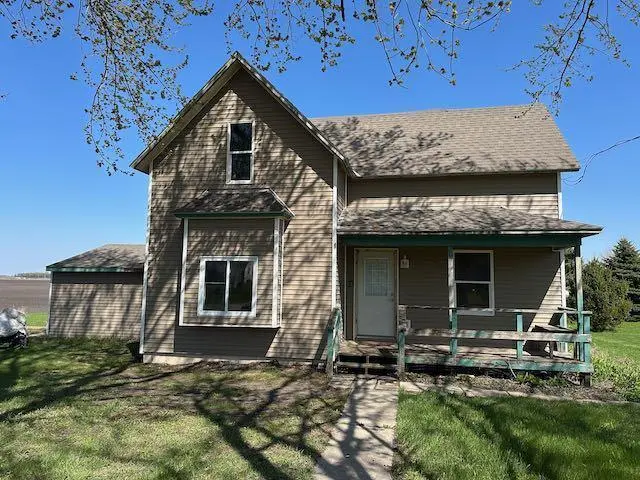
807 County Road 6 · Renville, MN
Flood risk 1/10 · Minimal
- FEMA flood zone
- X (unshaded)
- Chance of flooding over 30 yrs
- 0.0%
- Est. flood insurance / yr
- $473 – $860
Fire risk 1/10 · Minimal
- Est. fire insurance / yr
- $888 – $1,650
Heat risk 2/10 · Minimal
- Hot days now (above 100°F)
- 7 days/yr
- Hot days in 30 yrs
- 14 days/yr
Wind risk 2/10 · Minimal
- Chance of severe wind over 30 yrs
- —
Air-quality risk 2/10 · Minimal
- Unhealthy air days now
- 2 days/yr
- Unhealthy air days in 30 yrs
- 2 days/yr
Risk factors via First Street. Map © Google.
Why this score? — see what drove the B+ grade
The composite is a weighted blend of 9 inputs, each scored 0–100. Each bar is that input's sub-score; the figure is the points it added to the 100-point composite (weight × sub-score).
- Cash flow +30.0/30.0
- 1% rule +10.0/10.0
- DSCR +10.0/10.0
- Appreciation +9.7/10.0
- ARV discount +7.5/15.0
- Livability +3.7/5.0
- Schools +3.0/10.0
- Rent growth +2.5/5.0
- Condition / age +2.5/5.0
$50,000
🖨 Deal sheet (PDF) 📄 Offer letter ✓ Due diligence
Listing remarks MLS
Edge of town rural feel with a nice sized lot. The house, with some effort, would make a great home. Seller financing available. Being sold as-is. Seller escrow available to trench in city sewer...
Key facts
- 0.48 acre lot
- 2 garage spots
- Built 1910
Neighborhood map
What this means for you Summary
Snapshot
- This is a 3-bed/1.0-bath single-family listed at $50k.
Deal economics
- At list price, monthly cash flow is $865 ($10k/yr) — positive.
- The deal already cash-flows at list — no discount required.
- Meets the 1% rule at list price ($2k rent vs $50k).
- Recommended offer: $44k (12.0% below list) — sets the bar for market timing.
Location & tenants
- Location reads 74/100 on livability (#221 in MN, #4,729 nationally) — a middle-class / working-renter tenant base. Strengths: cost of living A+, health & safety A+, housing A; Watch: amenities F, commute F.
- Renville County West School District (rural): math 26% / reading 43% proficiency, ranked #255 of 301 in MN (top 85%) — families likely to look elsewhere, expect single-tenant / working-renter base with shorter leases.
- Zoned schools: Renville County West Elementary (math 27% / reading 47%, grade F, #636 of 857 statewide, top 76%, 350 students, 58% FRL); Renville County West Senior High (math 22% / reading 37%, grade F, #354 of 471 statewide, top 77%, 230 students, 54% FRL) — zoned schools average 56% FRL vs 40% district-wide (16 pts higher); higher-poverty schools than district average — tighter screening recommended.
- Market conditions: 4 active listings in the ZIP; 1 comparable units currently listed for rent nearby; 17 units permitted in Renville County in 2024 (0 in 5+ unit buildings).
Forward outlook
- In year one you build about $5k of equity ($346 loan paydown + $5k appreciation (9.4% local appreciation)).
- Renville County population projected at -28% by 2050 — secular population decline; favor cash flow + early exit over multi-decade hold.
- At projected returns (9.4% appreciation + 3.0% rent growth), your $14k cash investment doubles in ~1 year — after that, you're playing with house money.
- By year 7, paydown + projected appreciation supports a ~$36k cash-out refi (75% LTV) — recoverable capital for the next deal without selling this one.
Negotiation context
- It's been on market 404 days — a 12% lower offer ($44k) is reasonable based on typical stale-listing flexibility.
- 2 sale attempts since 2y ago; this cycle's ask has dropped $28k (36%) from the opening price — seller is motivated, your offer sets the floor, not the list.
- Current owner paid $10k; list at $50k implies a 400% gain — meaningful room to come down on a strong offer.
Risks & watch-outs
- Watch-outs: built in 1910 — expect roof / HVAC / electrical / plumbing capex.
Questions for the listing agent
- It's been on market 404 days. Have you received any prior offers? Is the seller open to a 12% concession, seller financing, or rate buy-down credit?
- Built in 1910 — when were the roof, HVAC, electrical panel, plumbing, and water heater last replaced?
- Why hasn't it sold? Are there any deal-killer items the seller is aware of (foundation, flood, title, zoning, code violations)?
- Is there a deadline driving the sale (1031 exchange, divorce, estate, relocation)? That informs how much negotiation room exists.
- Schools are D-rated, which usually means shorter tenancies and higher turnover. Who's the typical renter profile here, and what's been the actual vacancy rate?
- What's the average days-on-market for RENTAL listings here right now (not sales)? A rising rental-DOM trend means longer vacancies and softer asking-rent achievability than the comps imply.
- What's the recent tenant-quality profile in this submarket — average credit score on applications, eviction rate, late-payment / NSF rate, and stable-employment percentage? A property-management company in the area should have these aggregated.
- How much new for-sale + rental construction is in the pipeline within 1–3 miles? Heavy new supply typically softens prices + rents 12–24 months out; constrained supply supports both.
Investment metrics
- 1% rule
- 3.10% ✓
- Cap rate
- 27.05%
- Cash-on-cash
- 74.14%
- DSCR
- 4.30
- GRM
- 2.7
CMA / ARV
No comps found within radius.
Projected returns pro-forma
9.44% appreciation · 3.0% rent growth · sell at horizon
- IRR
- 84.2%
- Equity multiple
- 6.75×
- Total profit
- $80,452
- Equity at exit
- $43,021
- IRR
- 79.1%
- Equity multiple
- 14.80×
- Total profit
- $193,211
- Equity at exit
- $90,706
Cash invested: $14,000 (down + closing). Projections, not guarantees.
Landlord ↔ Tenant lean methodology
- Overall (STATE)
- 46 Balanced
- State Minnesota
- 46 Balanced · D+2
- County
- — inherits STATE
- City
- — inherits STATE
ZIP-level market 56284
- Home prices YoY
- 3.5%
- Active inventory
- 4
- Price-to-rent
- 2.7×
Monthly cashflow live
- Estimated rent
- $1,550 medium interval (Pro) →
- Mortgage (P&I)
- −$262
- Tax from tax record
- −$76 /mo · $918/yr
- Insurance
- −$21
- HOA
- −$0
- Vacancy / Maint / Mgmt
- −$326
- Net cashflow
- $865
Break-even live
Sensitivity live
| Price | -10% $893 | -5% $879 | +0% $865 | +5% $851 | +10% $837 |
|---|---|---|---|---|---|
| Rent | -10% $743 | -5% $804 | +0% $865 | +5% $926 | +10% $987 |
| Rate | -1.0pp $890 | -0.5pp $878 | base $865 | +0.5pp $852 | +1.0pp $839 |
UW: 25.0% down · 7.5% · 30yr · 1.5% tax · 5.0% vac · 8.0% maint · 8.0% mgmt
Financing live
Cash to close
- Down payment
- $12,500
- Closing costs
- $1,500
- Reserves months
- —
- Total cash needed
- —
Loan-product check · same deal, 3 products live
Conventional
25% down · 7.5% · 30yr
- Down + closing
- —
- Monthly P&I
- —
- Monthly cashflow
- —
- DSCR
- —
- Eligible?
- —
Personal DTI + credit; lowest rate.
DSCR
20% down · 8.5% · 30yr
- Down + closing
- —
- Monthly P&I
- —
- Monthly cashflow
- —
- DSCR
- —
- Eligible?
- —
No personal income docs; deal must DSCR.
Hard money
10% down · 12.0% · 12mo
- Down + closing
- —
- Monthly P&I
- —
- Monthly cashflow
- —
- DSCR
- —
- Eligible?
- —
Short-term bridge; refi at stabilization.
Rent comps 1 comps
| Address | Beds | Baths | Sqft | Rent | $/sqft | DOM | Units | Dist |
|---|---|---|---|---|---|---|---|---|
| 609 Main St S Renville, MN | 1.0–2.0 | 1.0 | 642 | $1,550 | $2.41 | 45d | 1 | 1.05mi |
Listing history 24 events
-
2026-06-21days on market $50,000 Active 404 DOM
-
2026-06-21days on market $50,000 Active 403 DOM
-
2026-06-18days on market $50,000 Active 401 DOM
-
2026-06-17days on market $50,000 Active 400 DOM
-
2026-06-16days on market $50,000 Active 399 DOM
-
2026-06-15days on market $50,000 Active 398 DOM
-
2026-06-13days on market $50,000 Active 396 DOM
-
2026-06-12days on market $50,000 Active 395 DOM
-
2026-06-09days on market $50,000 Active 392 DOM
-
2026-06-08days on market $50,000 Active 391 DOM
-
2026-06-07days on market $50,000 Active 390 DOM
-
2026-06-05days on market $50,000 Active 388 DOM
-
2026-06-04days on market $50,000 Active 386 DOM
-
2026-06-02days on market $50,000 Active 385 DOM
-
2026-06-01days on market $50,000 Active 384 DOM
-
2026-05-31days on market $50,000 Active 383 DOM
-
2026-05-31days on market $50,000 Active 382 DOM
-
2026-04-27price $75,000 197-char remark
Show marketing remark (197 chars)
Edge of town rural feel with a nice sized lot. The house, with some effort, would make a great home. Seller financing available. Being sold as-is. Seller escrow available to trench in city sewer...
-
2025-08-16price $77,000 197-char remark
Show marketing remark (197 chars)
Edge of town rural feel with a nice sized lot. The house, with some effort, would make a great home. Seller financing available. Being sold as-is. Seller escrow available to trench in city sewer...
-
2025-05-13$78,000 Active 197-char remark
Show marketing remark (197 chars)
Edge of town rural feel with a nice sized lot. The house, with some effort, would make a great home. Seller financing available. Being sold as-is. Seller escrow available to trench in city sewer...
-
2025-01-05status Pending
-
2025-01-05historical
-
2024-12-29$64,400 Active
-
2012-02-23soldstatus $10,000
ⓘ Source: listings_history table (triggers on properties + properties_extension) + one-shot
backfill from property_details.listing_events for pre-trigger history.
Tax reassessment forecast MN · Partial reset (capped growth)
- Current annual tax
- $918 · $76/mo
- Projected year-2 tax
- $918 · $76/mo
- Expected delta
- $0/yr ($0/mo · 0.0%)
ⓘ Screening estimate from a state-policy table — verify with the county assessor before closing.
Climate risk First Street
- Flood 1/10 Low FEMA zone X (unshaded) · 0% chance over 30 yrs
- Wildfire 1/10 Low
- Heat 2/10 Low 7 d/yr ≥100°F today · 14 d/yr by 30 yrs out
- Wind 2/10 Low
- Air quality 2/10 Low 2 unhealthy d/yr today · 2 by 30 yrs out
Nearby sold comps map
Loading sold comps map…
Walkable amenities ~0.75 mi
Loading nearby amenities…
Taxation est. · year 1
- Rental income
- $18,600
- − Mortgage interest
- −$2,801
- − Property taxes
- −$918
- − Insurance
- −$250
- − Repairs & maintenance
- −$1,488
- − Management
- −$1,488
- − Depreciation
- −$1,455
- Taxable income
- $10,201
- Est. tax owed @ 24.0%
- −$2,448
- After-tax cash flow
- $7,931/yr
For passive investors: Depreciation is non-cash, so a rental often shows a tax loss while cash-flowing — sheltering income. Rental losses are passive: they offset passive income freely, and up to $25,000/yr can offset ordinary (W-2) income if you actively participate and your MAGI is under $100k (phasing out to $0 by $150k); unused losses carry forward. On sale, claimed depreciation is recaptured at up to 25%, and gains may owe capital-gains tax (a 1031 exchange can defer both). Figures are a year-1 estimate at your 24.0% rate — not tax advice; consult a CPA.
Schools (NCES district)
- District
- Renville County West School District
- NCES district ID
- 2700163
- Math proficiency
- 26% ▼ -14.00%
- Reading proficiency
- 43% ▼ -12.00%
- Median HH income
- $51,850
- Composite
- 30.04/100
- National rank
- #6356
- State rank
- #255 of 301 in MN
Livability — Renville
- Score
- 74/100
- State rank
- #221
- US rank
- #4729
Category grades
Schools grade is shown separately in the Schools card above.
Census & demographics
- Census place
- Renville, MN
- Population (ZIP)
- 2,099
Population outlook (Renville County) Hauer SSP2
- Today (2025)
- 13,251 people
- By 2030
- 12,443 · -6.1%
- By 2040
- 10,946 · -17.4%
- By 2050
- 9,598 · -27.6%
- By 2075
- 7,411 · -44.1%
- By 2100
- 5,768 · -56.5%
Race, ethnicity, and origin ACS 2023
- Neighborhood character
- Predominantly White (79%)
- Race & ethnicity
- White 79% Hispanic / Latino 17% Two or more races 11%
- Hispanic origin (detail)
- Mexican 16%
- Common ancestry
- Portuguese 22% Iranian 5% English 1%
- Foreign-born
- 3% · Canada
- Languages at home
- 89% English-only · Spanish 10%
Political lean MEDSL · Renville
- 2024 margin
- Solid R (+41.4) · D 28.4% · R 69.8% · Other 1.9%
- 2008→2024 swing
- -40.8pp toward R · 2008: -0.6pp · 2024: -41.4pp
- All cycles
- 2024: R+41.4 2020: R+36.5 2016: R+36.7 2012: R+9.8 2008: R+0.6
Not yet ingested
- Civics
- —
Market trends
- HPI YoY
- ▲ 9.44%
- Current HPI
- 281.7046
- Rent YoY
- —
- Metro
- —
- State GDP YoY
- ▲ 2.41%
- F500 in state
- 34
Industry mix (Fortune 500 HQ in MN)
| Industry | F500 HQs | Revenue |
|---|---|---|
| Healthcare | 2 | $407B |
|
||
| Retail | 2 | $150B |
|
||
| Consumer Goods | 2 | $32B |
|
||
| Industrial Machinery | 2 | $6B |
|
||
| Agriculture | 1 | $40B |
|
||
| Healthcare / Medical Devices | 1 | $32B |
|
||
Price history
+650.0% since first listed7 events — show timeline
- 2026-04-27 Price Changed $75,000 NORTHSTARMLS as Distributed by MLS Grid
- 2025-08-16 Price Changed $77,000 NORTHSTARMLS as Distributed by MLS Grid
- 2025-05-13 Listed $78,000 NORTHSTARMLS as Distributed by MLS Grid
- 2025-01-05 Pending — NORTHSTARMLS as Distributed by MLS Grid
- 2025-01-05 Listing Removed — NORTHSTARMLS as Distributed by MLS Grid
- 2024-12-29 Listed $64,400 NORTHSTARMLS as Distributed by MLS Grid
- 2012-02-23 Sold (Public Records) $10,000 Public Records
Property tax history
+9.6%/yrLatest (2026): $918 · -34.1% YoY. Source: county tax records.
Cash-flow waterfall
monthlySold comps — $/sqft
last 12 mo · ≤1 miLoading sold comps…