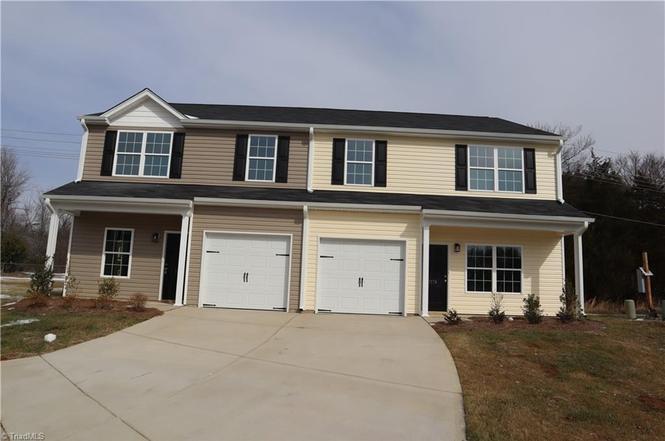
1176 Brooksridge Way · Burlington, NC
Flood risk No data
- FEMA flood zone
- —
- Chance of flooding over 30 yrs
- —
- Est. flood insurance / yr
- —
Fire risk No data
- Est. fire insurance / yr
- —
Heat risk No data
- Hot days now (above threshold)
- —
- Hot days in 30 yrs
- —
Wind risk No data
- Chance of severe wind over 30 yrs
- —
Air-quality risk No data
- Unhealthy air days now
- —
- Unhealthy air days in 30 yrs
- —
Risk factors via First Street. Map © Google.
Why this score? — see what drove the D- grade
The composite is a weighted blend of 9 inputs, each scored 0–100. Each bar is that input's sub-score; the figure is the points it added to the 100-point composite (weight × sub-score).
- Cash flow +7.1/30.0
- ARV discount +6.2/15.0
- Appreciation +5.5/10.0
- Schools +3.6/10.0
- Rent growth +3.5/5.0
- Livability +3.5/5.0
- 1% rule +3.3/10.0
- Condition / age +2.5/5.0
- DSCR +1.3/10.0
$242,500
🖨 Deal sheet 📄 Offer letter ✓ Due diligence
Listing remarks
New Construction!!! END UNIT!!! Exciting New Phase in established Ridge Creek. Affordable Units with luxury finishes and a garage. Stainless Steel appliances, Granite counters, soft close Marsh cabinets. Well designed floor plans maximizing the space. Units are in the back of the development so there is no through traffic. Wooded back area. Nearby amenities in Whitsett. Close to I40/I85 for quick access to commutes. HOA includes access to the clubhouse and pool. Seller incentive! $3,500 in closing costs with acceptable offer. Multiple units available with different floor plans so check the listings with your agent to see what is available. This unit is a 3 bedroom. Ask your agent for detail
Key facts
- New construction
- End unit
- Luxury finishes
Tags
Property features AI
Finance
- Other: Subdivision: Ridge Creek
- HOA & community: Association Management Group; Community association (Greensboro); Monthly association fee of $270
Exterior
- Parking: Attached garage (1 garage space); Driveway
- Security: Carbon monoxide detector(s); Smoke detector(s)
- Utilities: Public water; Public sewer; Electric water heater; Electric power
- Home design: Residential townhouse; Stick/site built; New construction (2025); Two stories
- Construction: Vinyl siding; Slab foundation; Built in 2025
- Exterior features: Community pool access; Cleared lot; Private maintained road
Interior
- Kitchen: Microwave; Dishwasher; Disposal; Range
- Bedrooms: Second level bedrooms (three rooms on second level indicated by room dimensions)
- Flooring: Carpet; Vinyl
- Bathrooms: Two full bathrooms; One half bathroom
- Heating & cooling: Heat pump (electric); Central air
- Interior features: Pulldown attic stairs; Insulated doors and windows; Ceiling fan(s); Deadbolt(s); Pantry; Solid surface counters
- Laundry & utility: Laundry room with washer hookup and dryer connection; Electric water heater
Neighborhood map
What this means for you Summary
Snapshot
- This is a 3-bed/2.5-bath townhouse listed at $242k.
Deal economics
- At list price, monthly cash flow is $-348 ($-4k/yr) — negative.
- To cash-flow at today's rent, offer at most $192k (20.8% below list).
- To meet the 1% rule (rent ≥ 1% of price), the offer needs to be $202k (16.6% below list).
- Recommended offer: $192k (20.8% below list) — sets the bar for cash-flow.
- Cap rate 4.6% vs local median 3.6% in Burlington — meaningfully above typical; check what's discounted (condition, days-on-market, listing class) to confirm the premium yield is real.
Location & tenants
- Location reads 70/100 on livability (#123 in NC) — a middle-class / working-renter tenant base. Strengths: cost of living A+, housing A+, health & safety A+; Watch: commute D+, schools F, crime F.
- Guilford County Schools (urban): math 39% / reading 45% proficiency, ranked #99 of 178 in NC (top 56%) — families likely to look elsewhere, expect single-tenant / working-renter base with shorter leases.
- Market conditions: Rents rising fast (+4.0%/yr); 102 active listings in the ZIP; 9 comparable units currently listed for rent nearby; rentals at typical pace (median 21d on market — plan ~3-4 weeks tenant-placement turnaround); solid renter incomes; 3,843 units permitted in Guilford County in 2024 (2,397 in 5+ unit buildings).
Forward outlook
- In year one you build about $4k of equity ($2k loan paydown + $2k appreciation (1.0% local appreciation)).
- Guilford County population projected at +26% by 2050 — long-run rental-demand tailwind backs the buy-and-hold thesis.
- By year 8, paydown + projected appreciation supports a ~$33k cash-out refi (75% LTV) — recoverable capital for the next deal without selling this one.
Negotiation context
- It's been on market 139 days — a 12% lower offer ($213k) is reasonable based on typical stale-listing flexibility.
- 2 sale attempts since 8y ago; this cycle's ask has dropped $15k (6%) from the opening price — seller is motivated, your offer sets the floor, not the list.
Questions for the listing agent
- What do current leases actually rent for vs. the listed asking? Can we see a recent rent roll and the last 12 months of T-12 income?
- It's been on market 139 days. Have you received any prior offers? Is the seller open to a 21% concession, seller financing, or rate buy-down credit?
- What does the HOA fee cover, when was the last increase, and are there any pending special assessments or reserve-fund shortfalls?
- Why hasn't it sold? Are there any deal-killer items the seller is aware of (foundation, flood, title, zoning, code violations)?
- Is there a deadline driving the sale (1031 exchange, divorce, estate, relocation)? That informs how much negotiation room exists.
- Schools are F-rated, which usually means shorter tenancies and higher turnover. Who's the typical renter profile here, and what's been the actual vacancy rate?
- Crime grade is F in this area — have there been break-ins, vandalism, or insurance claims at this property in the last 3 years? What carrier currently insures it and at what premium?
- The area grade is low — what's the realistic commute time and amenity access for the typical tenant pool here? Any planned neighborhood developments (good or bad) we should know about?
- What's the average days-on-market for RENTAL listings here right now (not sales)? A rising rental-DOM trend means longer vacancies and softer asking-rent achievability than the comps imply.
- What's the recent tenant-quality profile in this submarket — average credit score on applications, eviction rate, late-payment / NSF rate, and stable-employment percentage? A property-management company in the area should have these aggregated.
- How much new for-sale + rental construction is in the pipeline within 1–3 miles? Heavy new supply typically softens prices + rents 12–24 months out; constrained supply supports both.
Investment metrics
- 1% rule
- 0.83% ✗
- Cap rate
- 4.57%
- Cash-on-cash
- -6.15%
- DSCR
- 0.73
- GRM
- 10.0
CMA / ARV
- ARV (on-the-fly)
- $235,935
- Comps found
- 12
Show comp detail 12 sales within ~0.75 mi
| Address | Dist | Beds/Ba | Sqft | Sold | Price | $/sf | Match |
|---|---|---|---|---|---|---|---|
| 1100 Brooksridge Way | 0.15mi | 3/2.5 | 1,605 (0%) | 8mo | $245,000 | $153 | 86 |
| 1163 Brooksridge Way | 0.04mi | 3/2.5 | 1,548 (-4%) | 13mo | $219,900 | $142 | 81 |
| 1136 Rose Petal Way | 0.05mi | 3/2.5 | 1,512 (-6%) | 13mo | $225,000 | $149 | 78 |
| 1200 Glory Vine Rd | 0.26mi | 3/2.5 | 1,600 (-0%) | 14mo | $215,000 | $134 | 75 |
| 1104 Brooksridge Way | 0.13mi | 3/2.0 | 1,753 (+9%) | 6mo | $257,500 | $147 | 71 |
| 1262 Glory Vine Rd | 0.20mi | 2/2.5 (-1) | 1,603 (-0%) | 18mo | $220,000 | $137 | 70 |
| 1139 Brooksridge Way | 0.07mi | 3/2.5 | 1,508 (-6%) | 21mo | $224,500 | $149 | 69 |
| 6455 Coral Vine Way | 0.15mi | 3/3.0 | 1,732 (+8%) | 15mo | $216,000 | $125 | 65 |
| 6305 Hibiscus Ct | 0.46mi | 3/3.5 | 1,650 (+3%) | 8mo | $230,000 | $139 | 63 |
| 1161 Brooksridge Way | 0.03mi | 2/2.5 (-1) | 1,400 (-13%) | 13mo | $210,800 | $151 | 61 |
| 1107 Brooksridge Way | 0.12mi | 3/2.5 | 1,378 (-14%) | 19mo | $212,000 | $154 | 55 |
| 1127 Oak Blossom Way | 0.31mi | 2/2.5 (-1) | 1,385 (-14%) | 3mo | $196,000 | $142 | 55 |
Match score weights: distance 35% · size 25% · config 20% · recency 20%. Top-matched comps best support the ARV.
Projected returns pro-forma
1.02% appreciation · 4.0% rent growth · sell at horizon
- IRR
- -4.4%
- Equity multiple
- 0.78×
- Total profit
- $-15,177
- Equity at exit
- $82,985
- IRR
- 1.6%
- Equity multiple
- 1.20×
- Total profit
- $13,437
- Equity at exit
- $110,434
Cash invested: $67,900 (down + closing). Projections, not guarantees.
Landlord ↔ Tenant lean methodology
- Overall (STATE)
- 85 Strongly Landlord-Friendly
- State North Carolina
- 85 Strongly Landlord-Friendly · R+3
- County
- — inherits STATE
- City
- — inherits STATE
ZIP-level market 27377
- Home prices YoY
- 0.4%
- Rents YoY
- 4.0%
- Active inventory
- 102
- Price-to-rent
- 10.0×
Monthly cashflow live
- Estimated rent
- $2,023 high interval (Pro) →
- Mortgage (P&I)
- −$1,272
- Tax est. 1.5%
- −$303 /mo · $3,638/yr
- Insurance
- −$101
- HOA
- −$270
- Vacancy / Maint / Mgmt
- −$425
- Net cashflow
- $-348
Break-even live
UW: 25.0% down · 7.5% · 30yr · 1.5% tax · 5.0% vac · 8.0% maint · 8.0% mgmt
Financing live
Cash to close
- Down payment
- $60,625
- Closing costs
- $7,275
- Reserves months
- —
- Total cash needed
- —
Loan-product check · same deal, 3 products live
Conventional
25% down · 7.5% · 30yr
- Down + closing
- —
- Monthly P&I
- —
- Monthly cashflow
- —
- DSCR
- —
- Eligible?
- —
Personal DTI + credit; lowest rate.
DSCR
20% down · 8.5% · 30yr
- Down + closing
- —
- Monthly P&I
- —
- Monthly cashflow
- —
- DSCR
- —
- Eligible?
- —
No personal income docs; deal must DSCR.
Hard money
10% down · 12.0% · 12mo
- Down + closing
- —
- Monthly P&I
- —
- Monthly cashflow
- —
- DSCR
- —
- Eligible?
- —
Short-term bridge; refi at stabilization.
Rent comps 9 comps
| Address | Beds | Baths | Sqft | Rent | $/sqft | DOM | Units | Dist |
|---|---|---|---|---|---|---|---|---|
| 1130 Brooksridge Way Unit 1130 Whitsett, NC | 2.0 | 2.5 | 1343 | $1,744 | $1.30 | 23d | 1 | 0.14mi |
| 1128 Brooksridge Way Unit 1128 Whitsett, NC | 2.0 | 2.5 | 1582 | $1,795 | $1.13 | 23d | 1 | 0.14mi |
| 1010 Fairway Village Way Whitsett, NC | 1.0–3.0 | 1.0–2.0 | 1122 | $1,857 | $1.66 | 14d | 18 | 0.58mi |
| 6850 Keeneland Dr Whitsett, NC | 4.0 | 2.5 | 2196 | $2,010 | $0.92 | 21d | 1 | 0.70mi |
| 7161 Royal Ascot Dr Whitsett, NC | 4.0 | 1.0–2.5 | 1658 | $2,209 | $1.33 | 14d | 80 | 0.90mi |
| 676 Affirmed Dr Whitsett, NC | 3.0 | 2.5 | 1951 | $1,955 | $1.00 | 21d | 1 | 1.16mi |
| 805 Creek Crossing Trl Whitsett, NC | 2.0 | 2.5 | 1307 | $1,680 | $1.29 | 19d | 1 | 1.17mi |
| 6700 Olivia Way Whitsett, NC | 4.0 | 2.5 | 2231 | $1,949 | $0.87 | 23d | 1 | 1.31mi |
| 917 Creek Crossing Trl Whitsett, NC | 2.0 | 2.5 | 1243 | $1,995 | $1.60 | 23d | 1 | 1.32mi |
HOA detail
- Monthly dues
- $270 · $3,240/yr
- Likely covers
- pool
Listing history 22 events
-
2026-06-18days on market $242,500 Active 139 DOM
-
2026-06-17days on market $242,500 Active 138 DOM
-
2026-06-16days on market $242,500 Active 137 DOM
-
2026-06-15days on market $242,500 Active 136 DOM
-
2026-06-14days on market $242,500 Active 134 DOM
-
2026-06-10days on market $242,500 Active 131 DOM
-
2026-06-09days on market $242,500 Active 130 DOM
-
2026-06-08days on market $242,500 Active 129 DOM
-
2026-06-07days on market $242,500 Active 128 DOM
-
2026-06-03days on market $242,500 Active 124 DOM
-
2026-06-02days on market $242,500 Active 123 DOM
-
2026-06-01days on market $242,500 Active 122 DOM
-
2026-05-31days on market $242,500 Active 121 DOM
-
2026-05-31days on market $242,500 Active 120 DOM
-
2026-05-19price $242,500
-
2026-05-08price $245,500
-
2026-04-17price $251,000
-
2026-04-09price $252,500
-
2026-01-30$257,500 Active
-
2018-06-01historical
-
2018-03-01price $115,990
-
2018-02-28$115,990
ⓘ Source: listings_history table (triggers on properties + properties_extension) + one-shot
backfill from property_details.listing_events for pre-trigger history.
Nearby sold comps map
Loading sold comps map…
Walkable amenities ~0.75 mi
Loading nearby amenities…
Taxation est. · year 1
- Rental income
- $24,274
- − Mortgage interest
- −$13,584
- − Property taxes
- −$3,638
- − Insurance
- −$1,212
- − Repairs & maintenance
- −$1,942
- − Management
- −$1,942
- − HOA
- −$3,240
- − Depreciation
- −$7,055
- Taxable loss
- −$8,338
- Est. tax savings @ 24.0%
- +$2,001
- After-tax cash flow
- $-2,172/yr
For passive investors: Depreciation is non-cash, so a rental often shows a tax loss while cash-flowing — sheltering income. Rental losses are passive: they offset passive income freely, and up to $25,000/yr can offset ordinary (W-2) income if you actively participate and your MAGI is under $100k (phasing out to $0 by $150k); unused losses carry forward. On sale, claimed depreciation is recaptured at up to 25%, and gains may owe capital-gains tax (a 1031 exchange can defer both). Figures are a year-1 estimate at your 24.0% rate — not tax advice; consult a CPA.
Schools (NCES district)
- District
- Guilford County Schools
- NCES district ID
- 3701920
- Math proficiency
- 39% ▲ 1.00%
- Reading proficiency
- 45% ▲ 1.00%
- Median HH income
- $46,315
- Composite
- 35.78/100
- National rank
- #4842
- State rank
- #99 of 178 in NC
Livability — Burlington
- Score
- 70/100
- State rank
- #123
- US rank
- #7396
Category grades
Schools grade is shown separately in the Schools card above.
Census & demographics
- County
- Guilford County · 487,190 people
- City population
- 88,508
- Metro
- Greensboro-High Point, NC
- Population (ZIP)
- 10,885
- Household income
- $90,181
- Rent vs Own
- Severe rent burden
- 356.0
Population outlook (Guilford County) Hauer SSP2
- Today (2025)
- 584,596 people
- By 2030
- 616,851 · +5.5%
- By 2040
- 678,451 · +16.1%
- By 2050
- 734,788 · +25.7%
- By 2075
- 862,985 · +47.6%
- By 2100
- 948,704 · +62.3%
Race, ethnicity, and origin ACS 2023
- Neighborhood character
- Diverse neighborhood (Simpson 0.61)
- Race & ethnicity
- White 52% Black 34% Two or more races 8% Hispanic / Latino 5% Asian 2%
- Common ancestry
- Serbian 6% Italian 3% Lithuanian 1%
- Foreign-born
- 5% · Canada, China
- Languages at home
- 95% English-only · Spanish 2% Chinese 1% Other Indo-European 1%
Political lean MEDSL · Guilford
- 2024 margin
- Strong D (+21.8) · D 60.2% · R 38.4% · Other 1.4%
- 2008→2024 swing
- +3.5pp toward D · 2008: 18.4pp · 2024: 21.8pp
- All cycles
- 2024: D+21.8 2020: D+23.1 2016: D+20.0 2012: D+16.5 2008: D+18.4
Not yet ingested
- Civics
- —
Market trends
- HPI YoY
- ▲ 1.02%
- Current HPI
- 232.0638
- Rent YoY
- ▲ 4.00%
- Metro
- Greensboro-High Point, NC
- State GDP YoY
- ▲ 3.28%
- F500 in state
- 26
Industry mix (Fortune 500 HQ in NC)
| Industry | F500 HQs | Revenue |
|---|---|---|
| Financial Services | 2 | $213B |
|
||
| Retail | 2 | $95B |
|
||
| Industrial Conglomerate | 1 | $38B |
|
||
| Metals / Steel | 1 | $35B |
|
||
| Utilities | 1 | $30B |
|
||
| Industrial Machinery | 1 | $19B |
|
||
Price history
+109.1% since first listed8 events — show timeline
- 2026-05-19 Price Changed $242,500 Triad MLS
- 2026-05-08 Price Changed $245,500 Triad MLS
- 2026-04-17 Price Changed $251,000 Triad MLS
- 2026-04-09 Price Changed $252,500 Triad MLS
- 2026-01-30 Listed $257,500 Triad MLS
- 2018-06-01 Listing Removed — TMLS
- 2018-03-01 Price Changed $115,990 Triad MLS
- 2018-02-28 Listed $115,990 TMLS
Cash-flow waterfall
monthlySold comps — $/sqft
last 12 mo · ≤1 miLoading sold comps…