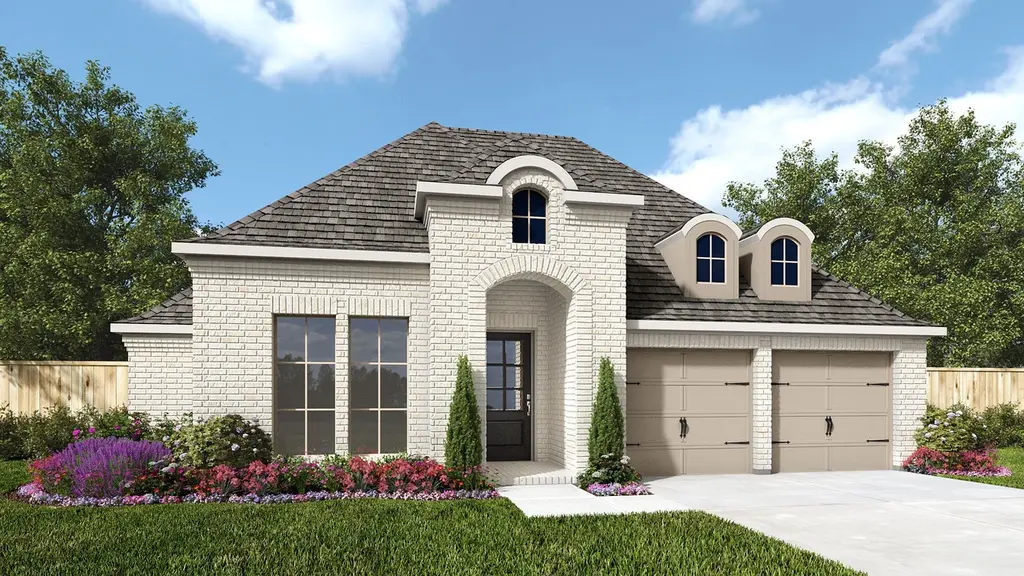
2036 Blackland St · Midlothian, TX
Flood risk 1/10 · Minimal
- FEMA flood zone
- X (unshaded)
- Chance of flooding over 30 yrs
- 0.0%
- Est. flood insurance / yr
- $507 – $1,088
Fire risk 4/10 · Minor
- Est. fire insurance / yr
- $1,222 – $2,270
Heat risk 6/10 · Moderate
- Hot days now (above 109°F)
- 5 days/yr
- Hot days in 30 yrs
- 16 days/yr
Wind risk 6/10 · Moderate
- Chance of severe wind over 30 yrs
- 27.0%
Air-quality risk 2/10 · Minimal
- Unhealthy air days now
- 2 days/yr
- Unhealthy air days in 30 yrs
- 2 days/yr
Risk factors via First Street. Map © Google.
Why this score? — see what drove the C grade
The composite is a weighted blend of 9 inputs, each scored 0–100. Each bar is that input's sub-score; the figure is the points it added to the 100-point composite (weight × sub-score).
- Cash flow +20.7/30.0
- ARV discount +7.5/15.0
- DSCR +6.6/10.0
- 1% rule +5.6/10.0
- Schools +4.8/10.0
- Condition / age +4.8/5.0
- Rent growth +3.6/5.0
- Livability +3.5/5.0
- Appreciation +0.0/10.0
$640,900
🖨 Deal sheet (PDF) 📄 Offer letter ✓ Due diligence
Listing remarks MLS
Home office with French doors set at entry with 12-foot ceiling. Open kitchen offers a 5-burner gas cooktop, generous counter space, a corner walk-in pantry, and an inviting island with built-in seating space. Dining area flows into open family room with a cast stone fireplace and a wall of windows. Spacious primary suite. Double doors lead to primary bath with dual vanities, a freestanding tub, a separate glass-enclosed shower, and two walk-in closets. Guest suite. Walk-in closets in all bedrooms. Covered backyard patio. Mud room off two-car garage. Representative Images. Features and specifications may vary by community.
Key facts
- Inviting island
- Dining area
- Family room
Tags
Property features AI
Finance
- Other: Community features include club house, park and playground; Listing terms permit Cash, Conventional, FHA and VA financing; Builder special listing condition
- HOA & community: Mandatory HOA; Annual association fee; Association pays maintenance of grounds and full use of facilities; HOA managed by First Service Residential
Exterior
- Parking: Attached 2-car garage with garage door opener; garage faces front; 2 covered parking spaces
- Security: Carbon monoxide detector(s); Smoke detector(s)
- Utilities: City water; City sewer; Concrete, curbs and sidewalk; Municipal Utility District; Energy-efficient features for appliances, HVAC, insulation, lighting, windows and water heater; Low-flow fixtures and rain/freeze sensors; Programmable thermostat
- Home design: Single-family residence; One level; Property attached: yes; New construction (2026) — currently incomplete; Smart home features included
- Construction: Brick construction; Composition roof; Slab foundation; Year built: 2026 (new construction — incomplete)
- Exterior features: Covered porch(es); Covered patio/porch; Subdivision lot; Fencing: metal and wood
Interior
- Kitchen: Dishwasher; Disposal; Gas range; Microwave; Eat-in kitchen with granite countertops; Pantry
- Bedrooms: 4 bedrooms (all on main level); Primary bedroom on main level with dual sinks, separate shower, separate vanities, medicine cabinet and walk-in closet; Other bedrooms feature walk-in closets
- Flooring: Carpet; Ceramic tile
- Bathrooms: 3 full bathrooms; 1 half bathroom
- Heating & cooling: Electric heating; Natural gas heating; Ceiling fan(s); Electric cooling
- Interior features: Eat-in kitchen; Granite counters; High-speed internet available; Pantry; Smart home system; Vaulted ceiling(s); 1 living area; 1 dining area; Room count: 13; Decorative gas fireplace with gas logs
- Laundry & utility: Utility room / mud room
Neighborhood map
What this means for you Summary
Snapshot
- This is a 4-bed/3.5-bath single-family listed at $641k. Condition is rated excellent.
Deal economics
- At list price, monthly cash flow is $866 ($10k/yr) — positive.
- The deal already cash-flows at list — no discount required.
- Meets the 1% rule at list price ($7k rent vs $641k).
- Recommended offer: $622k (3.0% below list) — sets the bar for market timing.
- Cap rate 7.9% vs local median 3.5% in Midlothian — top-decile yield for the area; either an underpriced asset or a hidden risk that comps aren't pricing in. Stress-test before assuming the spread holds.
Location & tenants
- Location reads 70/100 on livability (#371 in TX) — a middle-class / working-renter tenant base. Strengths: crime A+, employment A+, housing A+; Watch: amenities F, commute F, health & safety F.
- Midlothian ISD (suburban): math 53% / reading 52% proficiency, ranked #94 of 826 in TX (top 11%) — acceptable for families but not a draw, mixed tenant base, ~2y average lease.
- Zoned schools: Longbranch El (math 75% / reading 62%, grade B+, #176 of 4,322 statewide, top 4%, 652 students, 19% FRL) — zoned schools at 19% FRL track the district average.
- Zoned-school proficiency averages 68% at this address vs 52% district-wide (+16 pts) — the actual schools serving this property are materially stronger than the Midlothian ISD average implies; a family-tenant draw the district grade alone would hide.
- Market conditions: Rents rising fast (+4.3%/yr); 1133 active listings in the ZIP; 3 comparable units currently listed for rent nearby; rentals at typical pace (median 26d on market — plan ~3-4 weeks tenant-placement turnaround); high-income renter base; 3,016 units permitted in Ellis County in 2024 (20 in 5+ unit buildings).
- At $6,792/mo this rent would consume 64% of the median local household income ($128k/yr) (locally 811% of renters already pay >50% of income on rent) — very limited rent-growth headroom before tenants either downsize or default.
Forward outlook
- Local home prices are declining (-3.0%/yr); year-one equity from $4k of loan paydown is wiped out by about $19k of value loss. Plan a longer hold.
- Ellis County population projected at +36% by 2050 — long-run rental-demand tailwind backs the buy-and-hold thesis.
Negotiation context
- It's been on market 31 days — a 3% lower offer ($622k) is reasonable based on typical stale-listing flexibility.
- 2 sale attempts with the ask held roughly flat each time — persistent listings suggest the price (not the market) is what's stuck; bring a comps-based counter.
Risks & watch-outs
- Climate carrying-cost: major wind risk, 27% chance of damaging wind over 30y; extreme-heat days projected 5→16/yr by 2055 (HVAC capex compounding) — expect insurance premiums to compound above CPI over the hold.
Questions for the listing agent
- It's been on market 31 days. Have you received any prior offers? Is the seller open to a 3% concession, seller financing, or rate buy-down credit?
- What does the HOA fee cover, when was the last increase, and are there any pending special assessments or reserve-fund shortfalls?
- Is there a deadline driving the sale (1031 exchange, divorce, estate, relocation)? That informs how much negotiation room exists.
- Schools are B-rated — typically a magnet for longer-tenancy family renters. What's the average tenant stay here, and is there a school-zone premium baked into asking?
- What's the average days-on-market for RENTAL listings here right now (not sales)? A rising rental-DOM trend means longer vacancies and softer asking-rent achievability than the comps imply.
- What's the recent tenant-quality profile in this submarket — average credit score on applications, eviction rate, late-payment / NSF rate, and stable-employment percentage? A property-management company in the area should have these aggregated.
- How much new for-sale + rental construction is in the pipeline within 1–3 miles? Heavy new supply typically softens prices + rents 12–24 months out; constrained supply supports both.
Investment metrics
- 1% rule
- 1.06% ✓
- Cap rate
- 7.91%
- Cash-on-cash
- 5.79%
- DSCR
- 1.26
- GRM
- 7.9
CMA / ARV
No comps found within radius.
Projected returns pro-forma
-3.0% appreciation · 4.32% rent growth · sell at horizon
- IRR
- -5.8%
- Equity multiple
- 0.78×
- Total profit
- $-39,421
- Equity at exit
- $95,560
- IRR
- 5.4%
- Equity multiple
- 1.42×
- Total profit
- $75,805
- Equity at exit
- $55,413
Cash invested: $179,452 (down + closing). Projections, not guarantees.
Landlord ↔ Tenant lean methodology
- Overall (STATE)
- 87 Strongly Landlord-Friendly
- State Texas
- 87 Strongly Landlord-Friendly · R+5
- County
- — inherits STATE
- City
- — inherits STATE
ZIP-level market 76065
- Home prices YoY
- -18.9%
- Rents YoY
- 4.3%
- Active inventory
- 1133
- Price-to-rent
- 7.9×
Monthly cashflow live
- Estimated rent
- $6,792 medium interval (Pro) →
- Mortgage (P&I)
- −$3,361
- Tax est. 1.5%
- −$801 /mo · $9,614/yr
- Insurance
- −$267
- HOA
- −$71
- Vacancy / Maint / Mgmt
- −$1,426
- Net cashflow
- $866
Break-even live
Sensitivity live
| Price | -10% $1,309 | -5% $1,087 | +0% $866 | +5% $644 | +10% $423 |
|---|---|---|---|---|---|
| Rent | -10% $329 | -5% $598 | +0% $866 | +5% $1,134 | +10% $1,402 |
| Rate | -1.0pp $1,189 | -0.5pp $1,029 | base $866 | +0.5pp $700 | +1.0pp $531 |
UW: 25.0% down · 7.5% · 30yr · 1.5% tax · 5.0% vac · 8.0% maint · 8.0% mgmt
Financing live
Cash to close
- Down payment
- $160,225
- Closing costs
- $19,227
- Reserves months
- —
- Total cash needed
- —
Loan-product check · same deal, 3 products live
Conventional
25% down · 7.5% · 30yr
- Down + closing
- —
- Monthly P&I
- —
- Monthly cashflow
- —
- DSCR
- —
- Eligible?
- —
Personal DTI + credit; lowest rate.
DSCR
20% down · 8.5% · 30yr
- Down + closing
- —
- Monthly P&I
- —
- Monthly cashflow
- —
- DSCR
- —
- Eligible?
- —
No personal income docs; deal must DSCR.
Hard money
10% down · 12.0% · 12mo
- Down + closing
- —
- Monthly P&I
- —
- Monthly cashflow
- —
- DSCR
- —
- Eligible?
- —
Short-term bridge; refi at stabilization.
Rent comps 3 comps
| Address | Beds | Baths | Sqft | Rent | $/sqft | DOM | Units | Dist |
|---|---|---|---|---|---|---|---|---|
| 315 E Avenue F Midlothian, TX | 3.0 | 2.0 | 2014 | $2,525 | $1.25 | 8d | 1 | 0.63mi |
| 2 Saint Charles Pl Midlothian, TX | 5.0 | 3.0 | 2400 | $8,950 | $3.73 | 45d | 1 | 0.98mi |
| 2 Saint Charles Pl Unit 1389216P Midlothian, TX | 5.0 | 3.0 | 2389 | $15,575 | $6.52 | 25d | 1 | 0.98mi |
HOA detail
- Monthly dues
- $71 · $852/yr
- Likely covers
- gas
Listing history 16 events
-
2026-06-21days on market $640,900 Active 31 DOM
-
2026-06-18days on market $640,900 Active 28 DOM
-
2026-06-17days on market $640,900 Active 27 DOM
-
2026-06-16days on market $640,900 Active 26 DOM
-
2026-06-15days on market $640,900 Active 25 DOM
-
2026-06-13days on market $640,900 Active 23 DOM
-
2026-06-09days on market $640,900 Active 19 DOM
-
2026-06-08days on market $640,900 Active 18 DOM
-
2026-06-07days on market $640,900 Active 17 DOM
-
2026-06-04days on market $640,900 Active 14 DOM
-
2026-06-03days on market $640,900 Active 13 DOM
-
2026-06-02days on market $640,900 Active 12 DOM
-
2026-06-01days on market $640,900 Active 11 DOM
-
2026-05-31days on market $640,900 Active 10 DOM
-
2026-05-21$640,900 Active 630-char remark
Show marketing remark (630 chars)
Home office with French doors set at entry with 12-foot ceiling. Open kitchen offers a 5-burner gas cooktop, generous counter space, a corner walk-in pantry, and an inviting island with built-in seating space. Dining area flows into open family room with a cast stone fireplace and a wall of windows. Spacious primary suite. Double doors lead to primary bath with dual vanities, a freestanding tub, a separate glass-enclosed shower, and two walk-in closets. Guest suite. Walk-in closets in all bedrooms. Covered backyard patio. Mud room off two-car garage. Representative Images. Features and specifications may vary by community.
-
2026-05-21$640,900 Active
Show marketing remark (630 chars)
Home office with French doors set at entry with 12-foot ceiling. Open kitchen offers a 5-burner gas cooktop, generous counter space, a corner walk-in pantry, and an inviting island with built-in seating space. Dining area flows into open family room with a cast stone fireplace and a wall of windows. Spacious primary suite. Double doors lead to primary bath with dual vanities, a freestanding tub, a separate glass-enclosed shower, and two walk-in closets. Guest suite. Walk-in closets in all bedrooms. Covered backyard patio. Mud room off two-car garage. Representative Images. Features and specifications may vary by community.
ⓘ Source: listings_history table (triggers on properties + properties_extension) + one-shot
backfill from property_details.listing_events for pre-trigger history.
Climate risk First Street
- Flood 1/10 Low FEMA zone X (unshaded) · 0% chance over 30 yrs
- Wildfire 4/10 Moderate
- Heat 6/10 Major 5 d/yr ≥109°F today · 16 d/yr by 30 yrs out
- Wind 6/10 Major 27% chance of damaging wind over 30 yrs
- Air quality 2/10 Low 2 unhealthy d/yr today · 2 by 30 yrs out
Nearby sold comps map
Loading sold comps map…
Walkable amenities ~0.75 mi
Loading nearby amenities…
Taxation est. · year 1
- Rental income
- $81,509
- − Mortgage interest
- −$35,900
- − Property taxes
- −$9,614
- − Insurance
- −$3,204
- − Repairs & maintenance
- −$6,521
- − Management
- −$6,521
- − HOA
- −$852
- − Depreciation
- −$18,644
- Taxable income
- $252
- Est. tax owed @ 24.0%
- −$61
- After-tax cash flow
- $10,330/yr
For passive investors: Depreciation is non-cash, so a rental often shows a tax loss while cash-flowing — sheltering income. Rental losses are passive: they offset passive income freely, and up to $25,000/yr can offset ordinary (W-2) income if you actively participate and your MAGI is under $100k (phasing out to $0 by $150k); unused losses carry forward. On sale, claimed depreciation is recaptured at up to 25%, and gains may owe capital-gains tax (a 1031 exchange can defer both). Figures are a year-1 estimate at your 24.0% rate — not tax advice; consult a CPA.
Condition & rehab AI · 6 photos
This home is in excellent condition with a modern design and well-maintained exterior. It is move-in ready and would benefit from minor aesthetic updates to further enhance its value.
Value-add opportunities
- Both Painting exterior and interior walls — Enhances curb appeal and interior aesthetics
- Both Landscaping improvements — Enhances curb appeal and adds value
- Both Replace light fixtures — Modernizes lighting and adds value
Renovation cost estimate screening
Value-add ROI direction
- Both Painting exterior and interior walls — Enhances curb appeal and interior aesthetics ↑
- Both Landscaping improvements — Enhances curb appeal and adds value ↑
- Both Replace light fixtures — Modernizes lighting and adds value ↑
ⓘ Cost ranges are severity-bucket heuristics (US national rule-of-thumb). Get contractor quotes + a written scope before underwriting a rehab budget.
Schools (NCES district)
- District
- Midlothian ISD
- NCES district ID
- 4830600
- Math proficiency
- 53% ▼ -7.00%
- Reading proficiency
- 52% ▼ -1.00%
- Median HH income
- $85,068
- Composite
- 48.22/100
- National rank
- #2165
- State rank
- #94 of 826 in TX
Livability — Midlothian
- Score
- 70/100
- State rank
- #371
- US rank
- #7851
Category grades
Schools grade is shown separately in the Schools card above.
Census & demographics
- Census place
- Midlothian, TX
- County
- Ellis County · 199,237 people
- City population
- 47,438
- Metro
- Dallas-Fort Worth-Arlington, TX
- Population (ZIP)
- 47,438
- Household income
- $127,756
- Rent vs Own
- Severe rent burden
- 811.0
Population outlook (Ellis County) Hauer SSP2
- Today (2025)
- 194,556 people
- By 2030
- 209,679 · +7.8%
- By 2040
- 238,837 · +22.8%
- By 2050
- 265,451 · +36.4%
- By 2075
- 326,571 · +67.9%
- By 2100
- 362,156 · +86.1%
Race, ethnicity, and origin ACS 2023
- Neighborhood character
- Predominantly White (65%)
- Race & ethnicity
- White 65% Hispanic / Latino 20% Two or more races 13% Black 11%
- Hispanic origin (detail)
- Mexican 15%
- Common ancestry
- Lithuanian 2% Italian 2% Romanian 1%
- Foreign-born
- 5% · Canada
- Languages at home
- 88% English-only · Spanish 10% Other Indo-European 1%
Political lean MEDSL · Ellis
- 2024 margin
- Solid R (+31.1) · D 34.0% · R 65.1%
- 2008→2024 swing
- +11.2pp toward D · 2008: -42.2pp · 2024: -31.1pp
- All cycles
- 2024: R+31.1 2020: R+34.1 2016: R+45.4 2012: R+47.5 2008: R+42.2
Not yet ingested
- Civics
- —
Market trends
- HPI YoY
- ▼ -56.85%
- Current HPI
- 243.5953
- Rent YoY
- ▲ 4.32%
- Metro
- Dallas-Fort Worth-Arlington, TX
- State GDP YoY
- ▲ 3.95%
- F500 in state
- 110
Industry mix (Fortune 500 HQ in TX)
| Industry | F500 HQs | Revenue |
|---|---|---|
| Energy | 16 | $1,198B |
|
||
| Technology | 5 | $198B |
|
||
| Engineering / Construction | 4 | $72B |
|
||
| Energy Services | 3 | $60B |
|
||
| Utilities | 3 | $41B |
|
||
| Healthcare | 2 | $330B |
|
||
Price history
+0.0% since first listed2 events — show timeline
- 2026-05-21 Listed $640,900 Zillow
- 2026-05-21 Listed $640,900 NTREIS
Cash-flow waterfall
monthlySold comps — $/sqft
last 12 mo · ≤1 miLoading sold comps…