7 Covered Bridge Ln · Wilmington, NY
Flood risk 1/10 · Minimal
- FEMA flood zone
- X (unshaded)
- Chance of flooding over 30 yrs
- 0.0%
- Est. flood insurance / yr
- $507 – $1,088
Fire risk 4/10 · Minor
- Est. fire insurance / yr
- $691 – $1,283
Heat risk 2/10 · Minimal
- Hot days now (above 92°F)
- 7 days/yr
- Hot days in 30 yrs
- 17 days/yr
Wind risk 1/10 · Minimal
- Chance of severe wind over 30 yrs
- 1.0%
Air-quality risk 2/10 · Minimal
- Unhealthy air days now
- 1 days/yr
- Unhealthy air days in 30 yrs
- 1 days/yr
Risk factors via First Street. Map © Google.
Why this score? — see what drove the B+ grade
The composite is a weighted blend of 9 inputs, each scored 0–100. Each bar is that input's sub-score; the figure is the points it added to the 100-point composite (weight × sub-score).
- Cash flow +30.0/30.0
- 1% rule +10.0/10.0
- DSCR +10.0/10.0
- Appreciation +8.8/10.0
- ARV discount +7.5/15.0
- Schools +3.7/10.0
- Livability +3.1/5.0
- Rent growth +2.5/5.0
- Condition / age +2.5/5.0
$89,999
🖨 Deal sheet (PDF) 📄 Offer letter ✓ Due diligence
Listing remarks
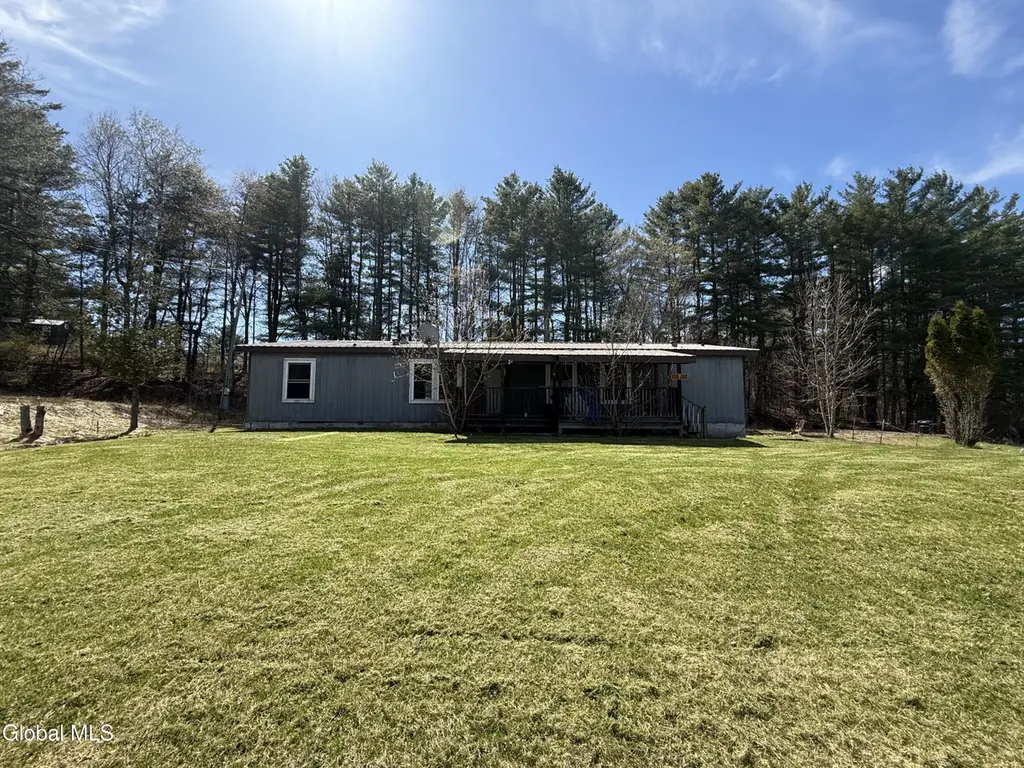
Opportunity awaits at 7 Covered Bridge Lane in Jay, NY. This 3-bedroom, 1.5-bath home offers 1,508 sq ft of living space and presents an excellent opportunity for buyers looking to renovate, invest, or create a year-round Adirondack retreat. Built in 1988, the property features public water, a cozy fireplace, and a flexible floor plan with potential for a 4th bedroom, home office, guest suite, or accessory dwelling unit possibilities (buyer to verify approvals with the Town of Jay). Jay has shown support for expanding housing options, making this an attractive consideration for buyers exploring future ADU or in-law apartment use. The home has already seen some improvements, including portio
Key facts
- Flexible floor plan
- Cozy fireplace
- Nearby park
Tags
Property features AI
Exterior
- Parking: Driveway with space for 4 vehicles
- Utilities: Public water; Septic tank sewer
- Home design: Single family residence
- Construction: Vinyl siding construction
- Exterior features: Vinyl siding; Lot approximately 0.3 acres; Located near a historic covered bridge, waterfront access, and a nearby park; about 35 minutes from Plattsburgh with easy access to shopping, dining, and the Adirondacks
Interior
- Kitchen: Electric oven; Range; Refrigerator
- Bedrooms: Three first-floor bedrooms; Office on the first floor; Utility room on the first floor
- Bathrooms: One full bathroom on the first floor; One half bathroom on the first floor
- Heating & cooling: Forced air heating
- Interior features: Total of 8 rooms; Crawl space basement; Family room fireplace
- Laundry & utility: Utility room on the first floor
Neighborhood map
What this means for you Summary
Snapshot
- This is a 3-bed/1.5-bath manufactured listed at $90k.
Deal economics
- At list price, monthly cash flow is $525 ($6k/yr) — positive.
- The deal already cash-flows at list — no discount required.
- Meets the 1% rule at list price ($1k rent vs $90k).
- Recommended offer: $87k (3.0% below list) — sets the bar for market timing.
- Cap rate 13.3% vs local median 1.1% in Wilmington — top-decile yield for the area; either an underpriced asset or a hidden risk that comps aren't pricing in. Stress-test before assuming the spread holds.
Location & tenants
- Location reads 61/100 on livability (#935 in NY) — a middle-class / working-renter tenant base. Strengths: housing A, employment A-; Watch: crime D+, amenities F, commute F.
- Ausable Valley Central School District (rural): math 36% / reading 51% proficiency, ranked #474 of 590 in NY (top 80%) — families likely to look elsewhere, expect single-tenant / working-renter base with shorter leases.
- Zoned schools: Ausable Valley High School (math 92% / reading 75%, grade A, #409 of 1,100 statewide, top 39%, 351 students, 50% FRL).
- Zoned-school proficiency averages 84% at this address vs 44% district-wide (+40 pts) — the actual schools serving this property are materially stronger than the Ausable Valley Central School District average implies; a family-tenant draw the district grade alone would hide.
- Market conditions: 54 active listings in the ZIP; 218 units permitted in Essex County in 2024 (63 in 5+ unit buildings).
Forward outlook
- In year one you build about $7k of equity ($622 loan paydown + $7k appreciation (7.6% local appreciation)).
- Essex County population projected at -20% by 2050 — secular population decline; favor cash flow + early exit over multi-decade hold.
- At projected returns (7.6% appreciation + 3.0% rent growth), your $25k cash investment doubles in ~2 years — after that, you're playing with house money.
- By year 5, paydown + projected appreciation supports a ~$34k cash-out refi (75% LTV) — recoverable capital for the next deal without selling this one.
Negotiation context
- It's been on market 52 days — a 3% lower offer ($87k) is reasonable based on typical stale-listing flexibility.
- 2 sale attempts with the ask held roughly flat each time — persistent listings suggest the price (not the market) is what's stuck; bring a comps-based counter.
Questions for the listing agent
- It's been on market 52 days. Have you received any prior offers? Is the seller open to a 3% concession, seller financing, or rate buy-down credit?
- Is there a deadline driving the sale (1031 exchange, divorce, estate, relocation)? That informs how much negotiation room exists.
- Schools are F-rated, which usually means shorter tenancies and higher turnover. Who's the typical renter profile here, and what's been the actual vacancy rate?
- Crime grade is D in this area — have there been break-ins, vandalism, or insurance claims at this property in the last 3 years? What carrier currently insures it and at what premium?
- What's the average days-on-market for RENTAL listings here right now (not sales)? A rising rental-DOM trend means longer vacancies and softer asking-rent achievability than the comps imply.
- What's the recent tenant-quality profile in this submarket — average credit score on applications, eviction rate, late-payment / NSF rate, and stable-employment percentage? A property-management company in the area should have these aggregated.
- How much new for-sale + rental construction is in the pipeline within 1–3 miles? Heavy new supply typically softens prices + rents 12–24 months out; constrained supply supports both.
Investment metrics
- 1% rule
- 1.63% ✓
- Cap rate
- 13.29%
- Cash-on-cash
- 24.99%
- DSCR
- 2.11
- GRM
- 5.1
CMA / ARV
No comps found within radius.
Projected returns pro-forma
7.62% appreciation · 3.0% rent growth · sell at horizon
- IRR
- 39.2%
- Equity multiple
- 3.71×
- Total profit
- $68,358
- Equity at exit
- $66,070
- IRR
- 35.2%
- Equity multiple
- 7.89×
- Total profit
- $173,535
- Equity at exit
- $129,010
Cash invested: $25,200 (down + closing). Projections, not guarantees.
Landlord ↔ Tenant lean methodology
- Overall (STATE)
- 15 Strongly Tenant-Friendly
- State New York
- 15 Strongly Tenant-Friendly · D+10
- County
- — inherits STATE
- City
- — inherits STATE
ZIP-level market 12941
- Home prices YoY
- 1.8%
- Active inventory
- 54
- Price-to-rent
- 5.1×
Monthly cashflow live
- Estimated rent
- $1,465 medium interval (Pro) →
- Mortgage (P&I)
- −$472
- Tax from tax record
- −$123 /mo · $1,477/yr
- Insurance
- −$37
- HOA
- −$0
- Vacancy / Maint / Mgmt
- −$308
- Net cashflow
- $525
Break-even live
Sensitivity live
| Price | -10% $576 | -5% $550 | +0% $525 | +5% $499 | +10% $474 |
|---|---|---|---|---|---|
| Rent | -10% $409 | -5% $467 | +0% $525 | +5% $583 | +10% $640 |
| Rate | -1.0pp $570 | -0.5pp $548 | base $525 | +0.5pp $501 | +1.0pp $478 |
UW: 25.0% down · 7.5% · 30yr · 1.5% tax · 5.0% vac · 8.0% maint · 8.0% mgmt
Financing live
Cash to close
- Down payment
- $22,500
- Closing costs
- $2,700
- Reserves months
- —
- Total cash needed
- —
Loan-product check · same deal, 3 products live
Conventional
25% down · 7.5% · 30yr
- Down + closing
- —
- Monthly P&I
- —
- Monthly cashflow
- —
- DSCR
- —
- Eligible?
- —
Personal DTI + credit; lowest rate.
DSCR
20% down · 8.5% · 30yr
- Down + closing
- —
- Monthly P&I
- —
- Monthly cashflow
- —
- DSCR
- —
- Eligible?
- —
No personal income docs; deal must DSCR.
Hard money
10% down · 12.0% · 12mo
- Down + closing
- —
- Monthly P&I
- —
- Monthly cashflow
- —
- DSCR
- —
- Eligible?
- —
Short-term bridge; refi at stabilization.
Listing history 19 events
-
2026-06-19days on market $89,999 Active 52 DOM
-
2026-06-18days on market $89,999 Active 51 DOM
-
2026-06-17days on market $89,999 Active 50 DOM
-
2026-06-16days on market $89,999 Active 49 DOM
-
2026-06-15days on market $89,999 Active 48 DOM
-
2026-06-14days on market $89,999 Active 46 DOM
-
2026-06-13days on market $89,999 Active 45 DOM
-
2026-06-10days on market $89,999 Active 43 DOM
-
2026-06-09days on market $89,999 Active 42 DOM
-
2026-06-08days on market $89,999 Active 41 DOM
-
2026-06-07days on market $89,999 Active 40 DOM
-
2026-06-05days on market $89,999 Active 37 DOM
-
2026-06-02days on market $89,999 Active 35 DOM
-
2026-06-01days on market $89,999 Active 34 DOM
-
2026-05-31days on market $89,999 Active 33 DOM
-
2026-05-30days on market $89,999 Active 32 DOM
-
2026-04-28$89,999 Active
-
2026-03-26historical
-
2026-01-22$69,999 Active
ⓘ Source: listings_history table (triggers on properties + properties_extension) + one-shot
backfill from property_details.listing_events for pre-trigger history.
Tax reassessment forecast NY · Partial reset (capped growth)
- Current annual tax
- $1,477 · $123/mo
- Projected year-2 tax
- $1,499 · $125/mo
- Expected delta
- +$22/yr (+$2/mo · 1.5%)
ⓘ Screening estimate from a state-policy table — verify with the county assessor before closing.
Climate risk First Street
- Flood 1/10 Low FEMA zone X (unshaded) · 0% chance over 30 yrs
- Wildfire 4/10 Moderate
- Heat 2/10 Low 7 d/yr ≥92°F today · 17 d/yr by 30 yrs out
- Wind 1/10 Low 100% chance of damaging wind over 30 yrs
- Air quality 2/10 Low 1 unhealthy d/yr today · 1 by 30 yrs out
Nearby sold comps map
Loading sold comps map…
Walkable amenities ~0.75 mi
Loading nearby amenities…
Taxation est. · year 1
- Rental income
- $17,579
- − Mortgage interest
- −$5,041
- − Property taxes
- −$1,477
- − Insurance
- −$450
- − Repairs & maintenance
- −$1,406
- − Management
- −$1,406
- − Depreciation
- −$2,618
- Taxable income
- $5,180
- Est. tax owed @ 24.0%
- −$1,243
- After-tax cash flow
- $5,054/yr
For passive investors: Depreciation is non-cash, so a rental often shows a tax loss while cash-flowing — sheltering income. Rental losses are passive: they offset passive income freely, and up to $25,000/yr can offset ordinary (W-2) income if you actively participate and your MAGI is under $100k (phasing out to $0 by $150k); unused losses carry forward. On sale, claimed depreciation is recaptured at up to 25%, and gains may owe capital-gains tax (a 1031 exchange can defer both). Figures are a year-1 estimate at your 24.0% rate — not tax advice; consult a CPA.
Schools (NCES district)
- District
- Ausable Valley Central School District
- NCES district ID
- 3616170
- Math proficiency
- 36% ▼ -14.00%
- Reading proficiency
- 51% ▲ 5.00%
- Median HH income
- $50,989
- Composite
- 37.43/100
- National rank
- #4417
- State rank
- #474 of 590 in NY
Livability — Wilmington
- Score
- 61/100
- State rank
- #935
- US rank
- #18181
Category grades
Schools grade is shown separately in the Schools card above.
Census & demographics
- Population (ZIP)
- 1,477
Population outlook (Essex County) Hauer SSP2
- Today (2025)
- 36,758 people
- By 2030
- 35,697 · -2.9%
- By 2040
- 32,697 · -11.0%
- By 2050
- 29,248 · -20.4%
- By 2075
- 22,641 · -38.4%
- By 2100
- 16,602 · -54.8%
Race, ethnicity, and origin ACS 2023
- Neighborhood character
- Predominantly White (95%)
- Race & ethnicity
- White 95% Hispanic / Latino 2% Two or more races 1%
- Common ancestry
- Romanian 8% Lithuanian 6% Slovak 5%
- Foreign-born
- 4% · Canada
- Languages at home
- 96% English-only · Spanish 1% Other Indo-European 1% Russian/Polish/Slavic 1%
Political lean MEDSL · Essex
- 2024 margin
- Toss-up / Even · D 50.2% · R 49.8%
- 2008→2024 swing
- -12.8pp toward R · 2008: 13.3pp · 2024: 0.5pp
- All cycles
- 2024: D+0.5 2020: D+5.0 2016: R+3.4 2012: D+15.0 2008: D+13.3
Not yet ingested
- Civics
- —
Market trends
- HPI YoY
- ▲ 7.62%
- Current HPI
- 431.184
- Rent YoY
- —
- Metro
- —
- State GDP YoY
- ▲ 2.60%
- F500 in state
- 92
Industry mix (Fortune 500 HQ in NY)
| Industry | F500 HQs | Revenue |
|---|---|---|
| Financial Services | 10 | $950B |
|
||
| Consumer Goods | 9 | $162B |
|
||
| Insurance | 4 | $225B |
|
||
| Telecommunications | 2 | $144B |
|
||
| Pharmaceuticals | 2 | $112B |
|
||
| Media / Entertainment | 2 | $69B |
|
||
Price history
+28.6% since first listed3 events — show timeline
- 2026-04-28 Listed $89,999 Global MLS
- 2026-03-26 Listing Removed — Global MLS
- 2026-01-22 Listed $69,999 Global MLS
Property tax history
+12.4%/yrLatest (2025): $1,477 · +2.4% YoY. Source: county tax records.
Cash-flow waterfall
monthlySold comps — $/sqft
last 12 mo · ≤1 miLoading sold comps…