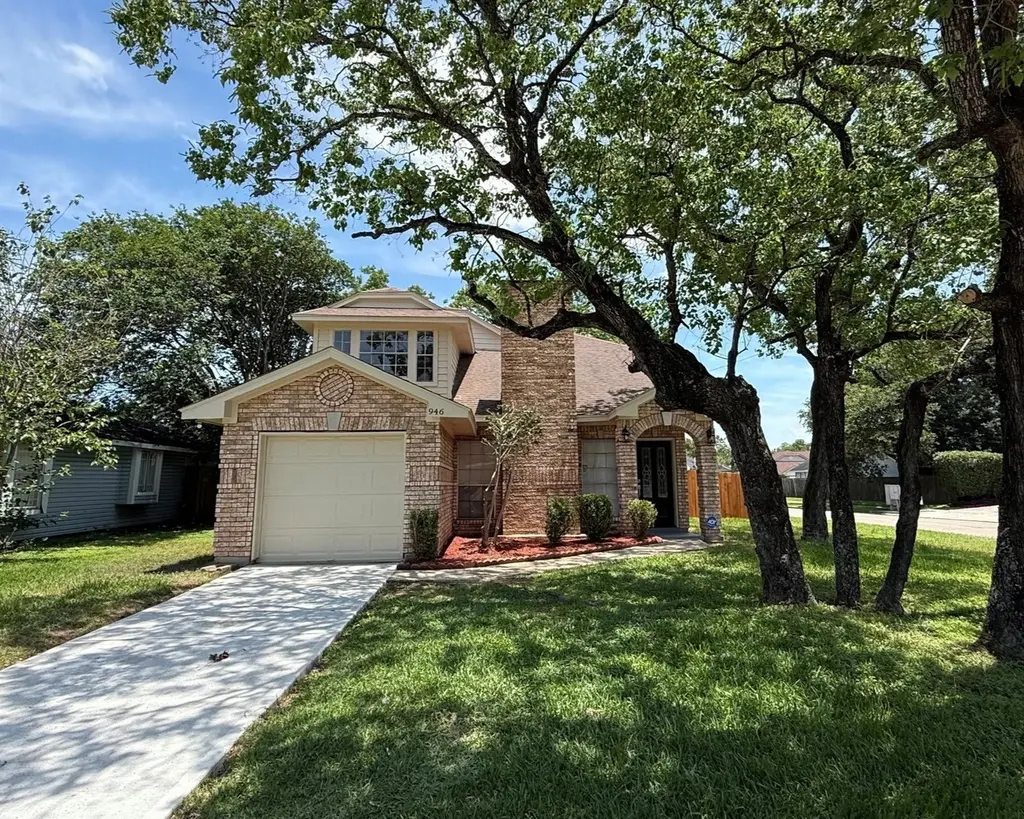
946 Pennygent Ln · Channelview, TX
Flood risk 3/10 · Minor
- FEMA flood zone
- X (unshaded)
- Chance of flooding over 30 yrs
- 0.2%
- Est. flood insurance / yr
- $507 – $1,088
Fire risk 3/10 · Minor
- Est. fire insurance / yr
- $1,222 – $2,270
Heat risk 9/10 · Severe
- Hot days now (above 109°F)
- 7 days/yr
- Hot days in 30 yrs
- 24 days/yr
Wind risk 9/10 · Severe
- Chance of severe wind over 30 yrs
- 99.0%
Air-quality risk 2/10 · Minimal
- Unhealthy air days now
- 2 days/yr
- Unhealthy air days in 30 yrs
- 2 days/yr
Risk factors via First Street. Map © Google.
Why this score? — see what drove the D grade
The composite is a weighted blend of 9 inputs, each scored 0–100. Each bar is that input's sub-score; the figure is the points it added to the 100-point composite (weight × sub-score).
- Cash flow +11.3/30.0
- ARV discount +10.5/15.0
- Rent growth +5.0/5.0
- 1% rule +3.9/10.0
- DSCR +3.3/10.0
- Livability +3.3/5.0
- Schools +2.5/10.0
- Condition / age +2.5/5.0
- Appreciation +0.0/10.0
$229,900
🖨 Deal sheet (PDF) 📄 Offer letter ✓ Due diligence
Listing remarks MLS
Beautiful 2-story home WITH High ceilings featuring 4 bedrooms, 2 baths, possibly the BEST LOOKING HOME available, RECENT UPDATES include freshly painted inside and out. New Hardware and fixtures, new All stainless streel appliances in the kitchen, new carpet in all carpeted areas, EVEN A brand NEW concrete DRIVEWAY. . UPDATED with modern touches and beautiful mirrors......TOO MANY UPGRADES TO MENTION... Super clean and ready to show... ...DYNAMITE home looking for a new owner...Hurry & that could be YOU!!
Key facts
- 6,098 sq ft lot
- Garage
- Built 1993
Neighborhood map
What this means for you Summary
Snapshot
- This is a 4-bed/2.0-bath single-family listed at $230k.
Deal economics
- At list price, monthly cash flow is $-86 ($-1k/yr) — negative.
- To cash-flow at today's rent, offer at most $215k (6.6% below list).
- To meet the 1% rule (rent ≥ 1% of price), the offer needs to be $204k (11.4% below list).
- Recommended offer: $204k (11.4% below list) — sets the bar for 1% rule.
- Cap rate 5.8% vs local median 4.7% in Channelview — meaningfully above typical; check what's discounted (condition, days-on-market, listing class) to confirm the premium yield is real.
Location & tenants
- Location reads 66/100 on livability (#598 in TX) — a middle-class / working-renter tenant base. Strengths: cost of living A+, housing A+; Watch: crime F, amenities F, commute F.
- Channelview ISD (suburban): math 27% / reading 30% proficiency, ranked #640 of 826 in TX (top 78%) — low school quality limits family demand, transient renter base, plan for 1-2y turnover; 70% free/reduced lunch — lower-income household profile, screen leases tightly.
- Zoned schools: B H Hamblen El (math 30% / reading 32%, grade F, #2,429 of 4,322 statewide, top 57%, 954 students, 83% FRL); Alice Johnson J H (math 23% / reading 22%, grade F, #1,341 of 1,662 statewide, top 82%, 1,189 students, 77% FRL); Channelview H S (math 24% / reading 35%, grade F, #1,112 of 1,632 statewide, top 70%, 2,893 students, 87% FRL).
- Market conditions: Rents rising fast (+16.9%/yr); 100 active listings in the ZIP; 7 comparable units currently listed for rent nearby; rentals leasing fast (median 4d on market — plan ~1-2 weeks tenant-placement turnaround); 29,883 units permitted in Harris County in 2024 (8,621 in 5+ unit buildings).
- This rent runs 39% of the median local income ($62k/yr) — at the standard rent-burdened threshold; future hikes will face affordability resistance.
Forward outlook
- Local home prices are declining (-3.0%/yr); year-one equity from $2k of loan paydown is wiped out by about $7k of value loss. Plan a longer hold.
- Harris County population projected at +47% by 2050 — long-run rental-demand tailwind backs the buy-and-hold thesis.
Negotiation context
- It's been on market 37 days — a 3% lower offer ($223k) is reasonable based on typical stale-listing flexibility.
- 8 sale attempts since 16y ago with the ask held roughly flat each time — persistent listings suggest the price (not the market) is what's stuck; bring a comps-based counter.
- Current owner paid $60k; list at $230k implies a 283% gain — meaningful room to come down on a strong offer.
Risks & watch-outs
- Climate carrying-cost: severe wind risk, 99% chance of damaging wind over 30y; extreme-heat days projected 7→24/yr by 2055 (HVAC capex compounding) — expect insurance premiums to compound above CPI over the hold.
Questions for the listing agent
- What do current leases actually rent for vs. the listed asking? Can we see a recent rent roll and the last 12 months of T-12 income?
- It's been on market 37 days. Have you received any prior offers? Is the seller open to a 11% concession, seller financing, or rate buy-down credit?
- What does the HOA fee cover, when was the last increase, and are there any pending special assessments or reserve-fund shortfalls?
- Is there a deadline driving the sale (1031 exchange, divorce, estate, relocation)? That informs how much negotiation room exists.
- Schools are D-rated, which usually means shorter tenancies and higher turnover. Who's the typical renter profile here, and what's been the actual vacancy rate?
- Crime grade is F in this area — have there been break-ins, vandalism, or insurance claims at this property in the last 3 years? What carrier currently insures it and at what premium?
- The area grade is low — what's the realistic commute time and amenity access for the typical tenant pool here? Any planned neighborhood developments (good or bad) we should know about?
- What's the average days-on-market for RENTAL listings here right now (not sales)? A rising rental-DOM trend means longer vacancies and softer asking-rent achievability than the comps imply.
- What's the recent tenant-quality profile in this submarket — average credit score on applications, eviction rate, late-payment / NSF rate, and stable-employment percentage? A property-management company in the area should have these aggregated.
- How much new for-sale + rental construction is in the pipeline within 1–3 miles? Heavy new supply typically softens prices + rents 12–24 months out; constrained supply supports both.
Investment metrics
- 1% rule
- 0.89% ✗
- Cap rate
- 5.84%
- Cash-on-cash
- -1.60%
- DSCR
- 0.93
- GRM
- 9.4
CMA / ARV
- ARV (on-the-fly)
- $246,246
- Comps found
- 12
Show comp detail 12 sales within ~0.75 mi
| Address | Dist | Beds/Ba | Sqft | Sold | Price | $/sf | Match |
|---|---|---|---|---|---|---|---|
| 15145 Sheffield Ter | 0.19mi | 3/2.0 (-1) | 1,606 (-7%) | 2mo | $229,950 | $143 | 73 |
| 1331 Padstow Ln | 0.49mi | 4/2.0 | 1,650 (-4%) | 2mo | $214,900 | $130 | 68 |
| 1342 Padstow Ln | 0.52mi | 3/2.0 (-1) | 1,664 (-3%) | 1mo | $229,000 | $138 | 64 |
| 1031 Deerpass Dr | 0.44mi | 4/2.5 | 1,832 (+6%) | 3mo | $235,000 | $128 | 64 |
| 335 Haymarket Ln | 0.73mi | 4/2.0 | 1,764 (+2%) | 1mo | $265,999 | $151 | 61 |
| 14918 Silver Green Dr S | 0.48mi | 3/2.0 (-1) | 1,860 (+8%) | 1mo | $235,000 | $126 | 58 |
| 730 Doncrest St | 0.37mi | 4/2.0 | 1,503 (-13%) | 4mo | $230,000 | $153 | 58 |
| 826 Ivyhollow Dr | 0.51mi | 3/2.0 (-1) | 1,593 (-8%) | 3mo | $175,000 | $110 | 56 |
| 1322 Littleport Ln | 0.44mi | 3/2.0 (-1) | 1,518 (-12%) | 4mo | $245,000 | $161 | 51 |
| 1343 Wrotham Ln | 0.73mi | 4/2.0 | 1,550 (-10%) | 3mo | $224,900 | $145 | 47 |
| 1118 Chestnut Bough St | 0.58mi | 3/2.0 (-1) | 1,499 (-13%) | 1mo | $225,000 | $150 | 46 |
| 1322 Great Dover Cir | 0.64mi | 4/3.0 | 1,464 (-15%) | 3mo | $200,000 | $137 | 39 |
Match score weights: distance 35% · size 25% · config 20% · recency 20%. Top-matched comps best support the ARV.
Projected returns pro-forma
-3.0% appreciation · 8.0% rent growth · sell at horizon
- IRR
- -13.1%
- Equity multiple
- 0.51×
- Total profit
- $-31,854
- Equity at exit
- $34,279
- IRR
- 2.6%
- Equity multiple
- 1.23×
- Total profit
- $14,634
- Equity at exit
- $19,878
Cash invested: $64,372 (down + closing). Projections, not guarantees.
Landlord ↔ Tenant lean methodology
- Overall (STATE)
- 87 Strongly Landlord-Friendly
- State Texas
- 87 Strongly Landlord-Friendly · R+5
- County
- — inherits STATE
- City
- — inherits STATE
ZIP-level market 77530
- Rents YoY
- 16.9%
- Active inventory
- 100
- Price-to-rent
- 9.4×
Monthly cashflow live
- Estimated rent
- $2,038 high interval (Pro) →
- Mortgage (P&I)
- −$1,206
- Tax from tax record
- −$373 /mo · $4,481/yr
- Insurance
- −$96
- HOA
- −$21
- Vacancy / Maint / Mgmt
- −$428
- Net cashflow
- $-86
Break-even live
Sensitivity live
| Price | -10% $44 | -5% $-21 | +0% $-86 | +5% $-151 | +10% $-216 |
|---|---|---|---|---|---|
| Rent | -10% $-247 | -5% $-166 | +0% $-86 | +5% $-5 | +10% $75 |
| Rate | -1.0pp $30 | -0.5pp $-27 | base $-86 | +0.5pp $-145 | +1.0pp $-206 |
UW: 25.0% down · 7.5% · 30yr · 1.5% tax · 5.0% vac · 8.0% maint · 8.0% mgmt
Financing live
Cash to close
- Down payment
- $57,475
- Closing costs
- $6,897
- Reserves months
- —
- Total cash needed
- —
Loan-product check · same deal, 3 products live
Conventional
25% down · 7.5% · 30yr
- Down + closing
- —
- Monthly P&I
- —
- Monthly cashflow
- —
- DSCR
- —
- Eligible?
- —
Personal DTI + credit; lowest rate.
DSCR
20% down · 8.5% · 30yr
- Down + closing
- —
- Monthly P&I
- —
- Monthly cashflow
- —
- DSCR
- —
- Eligible?
- —
No personal income docs; deal must DSCR.
Hard money
10% down · 12.0% · 12mo
- Down + closing
- —
- Monthly P&I
- —
- Monthly cashflow
- —
- DSCR
- —
- Eligible?
- —
Short-term bridge; refi at stabilization.
Rent comps 7 comps
| Address | Beds | Baths | Sqft | Rent | $/sqft | DOM | Units | Dist |
|---|---|---|---|---|---|---|---|---|
| 947 Leadenhall Cir Channelview, TX | 3.0 | 2.5 | 1620 | $1,806 | $1.11 | 0d | 1 | 0.29mi |
| 810 Townley St Channelview, TX | 3.0 | 3.5 | 1713 | $1,925 | $1.12 | 45d | 1 | 0.38mi |
| 15255 Ferness Ln Channelview, TX | 4.0 | 2.0 | 1326 | $1,668 | $1.26 | 4d | 10 | 0.40mi |
| 1335 Willersley Ln Channelview, TX | 3.0 | 2.0 | 1669 | $1,775 | $1.06 | 4d | 1 | 0.56mi |
| 1391 Tenderden Dr Channelview, TX | 3.0 | 2.0 | 1464 | $1,699 | $1.16 | 0d | 1 | 0.65mi |
| 1379 Dell Dale St Channelview, TX | 4.0 | 2.0 | 1444 | $1,893 | $1.31 | 6d | 1 | 0.85mi |
| 14831 Waterside Dr Houston, TX | 3.0 | 2.0 | 1638 | $1,779 | $1.09 | 4d | 1 | 1.13mi |
HOA detail
- Monthly dues
- $21 · $252/yr
Listing history 41 events
-
2026-06-21remarks 607-char remark
-
2026-06-21days on market $229,900 Active 37 DOM
-
2026-06-18days on market $229,900 Active 34 DOM
-
2026-06-17days on market $229,900 Active 33 DOM
-
2026-06-16days on market $229,900 Active 32 DOM
-
2026-06-15days on market $229,900 Active 31 DOM
-
2026-06-13days on market $229,900 Active 29 DOM
-
2026-06-09days on market $229,900 Active 25 DOM
-
2026-06-08days on market $229,900 Active 24 DOM
-
2026-06-07days on market $229,900 Active 23 DOM
-
2026-06-04days on market $229,900 Active 20 DOM
-
2026-06-03days on market $229,900 Active 19 DOM
-
2026-06-02days on market $229,900 Active 18 DOM
-
2026-06-01days on market $229,900 Active 17 DOM
-
2026-05-31days on market $229,900 Active 16 DOM
-
2026-05-15$229,900 Active 516-char remark
Show marketing remark (516 chars)
Beautiful 2-story home WITH High ceilings featuring 4 bedrooms, 2 baths, possibly the BEST LOOKING HOME available, RECENT UPDATES include freshly painted inside and out. New Hardware and fixtures, new All stainless streel appliances in the kitchen, new carpet in all carpeted areas, EVEN A brand NEW concrete DRIVEWAY. . UPDATED with modern touches and beautiful mirrors......TOO MANY UPGRADES TO MENTION... Super clean and ready to show... ...DYNAMITE home looking for a new owner...Hurry & that could be YOU!!
-
2025-04-01soldstatus Sold 397-char remark
Show marketing remark (397 chars)
Beautiful 3 bedroom and 2 bath in the heart of Channelview. This charming home features an open layout and a spacious living room with a fireplace. This property is closed to schools, shopping and parks. Make it your home today. (Tax information is incorrect this is a 3 bedroom. The 4th bedroom was converted back into a garage. Approximate square footage is 1500sq feet and should be verified. )
-
2025-04-01soldstatus
Show marketing remark (397 chars)
Beautiful 3 bedroom and 2 bath in the heart of Channelview. This charming home features an open layout and a spacious living room with a fireplace. This property is closed to schools, shopping and parks. Make it your home today. (Tax information is incorrect this is a 3 bedroom. The 4th bedroom was converted back into a garage. Approximate square footage is 1500sq feet and should be verified. )
-
2025-03-19status Pending 397-char remark
Show marketing remark (397 chars)
Beautiful 3 bedroom and 2 bath in the heart of Channelview. This charming home features an open layout and a spacious living room with a fireplace. This property is closed to schools, shopping and parks. Make it your home today. (Tax information is incorrect this is a 3 bedroom. The 4th bedroom was converted back into a garage. Approximate square footage is 1500sq feet and should be verified. )
-
2025-03-14status Option Pending 397-char remark
Show marketing remark (397 chars)
Beautiful 3 bedroom and 2 bath in the heart of Channelview. This charming home features an open layout and a spacious living room with a fireplace. This property is closed to schools, shopping and parks. Make it your home today. (Tax information is incorrect this is a 3 bedroom. The 4th bedroom was converted back into a garage. Approximate square footage is 1500sq feet and should be verified. )
-
2024-10-13price $217,900 397-char remark
Show marketing remark (397 chars)
Beautiful 3 bedroom and 2 bath in the heart of Channelview. This charming home features an open layout and a spacious living room with a fireplace. This property is closed to schools, shopping and parks. Make it your home today. (Tax information is incorrect this is a 3 bedroom. The 4th bedroom was converted back into a garage. Approximate square footage is 1500sq feet and should be verified. )
-
2024-09-29$219,900 Active 397-char remark
Show marketing remark (397 chars)
Beautiful 3 bedroom and 2 bath in the heart of Channelview. This charming home features an open layout and a spacious living room with a fireplace. This property is closed to schools, shopping and parks. Make it your home today. (Tax information is incorrect this is a 3 bedroom. The 4th bedroom was converted back into a garage. Approximate square footage is 1500sq feet and should be verified. )
-
2019-03-18soldstatus
-
2019-03-15soldstatus Sold
-
2019-02-17status Pending
-
2019-02-04status Active
-
2019-01-30status Pending
-
2019-01-02$167,900 Active
-
2017-12-13soldstatus
-
2017-05-25soldstatus
-
2017-02-28historical
-
2017-02-09status Active
-
2017-02-02status Pending
-
2017-01-06$140,000 Active
-
2016-05-03soldstatus
-
2012-01-01historical
-
2011-04-22$79,000
-
2010-10-17historical
-
2010-10-02$87,000
-
1996-12-17soldstatus
-
1994-06-01soldstatus $60,000
ⓘ Source: listings_history table (triggers on properties + properties_extension) + one-shot
backfill from property_details.listing_events for pre-trigger history.
Tax reassessment forecast TX · Resets to sale price
- Current annual tax
- $4,481 · $373/mo
- Projected year-2 tax
- $4,481 · $373/mo
- Expected delta
- $0/yr ($0/mo · 0.0%)
ⓘ Screening estimate from a state-policy table — verify with the county assessor before closing.
Climate risk First Street
- Flood 3/10 Moderate FEMA zone X (unshaded) · 20% chance over 30 yrs
- Wildfire 3/10 Moderate
- Heat 9/10 Extreme 7 d/yr ≥109°F today · 24 d/yr by 30 yrs out
- Wind 9/10 Extreme 99% chance of damaging wind over 30 yrs
- Air quality 2/10 Low 2 unhealthy d/yr today · 2 by 30 yrs out
Nearby sold comps map
Loading sold comps map…
Walkable amenities ~0.75 mi
Loading nearby amenities…
Taxation est. · year 1
- Rental income
- $24,455
- − Mortgage interest
- −$12,878
- − Property taxes
- −$4,481
- − Insurance
- −$1,150
- − Repairs & maintenance
- −$1,956
- − Management
- −$1,956
- − HOA
- −$252
- − Depreciation
- −$6,688
- Taxable loss
- −$4,906
- Est. tax savings @ 24.0%
- +$1,177
- After-tax cash flow
- $147/yr
For passive investors: Depreciation is non-cash, so a rental often shows a tax loss while cash-flowing — sheltering income. Rental losses are passive: they offset passive income freely, and up to $25,000/yr can offset ordinary (W-2) income if you actively participate and your MAGI is under $100k (phasing out to $0 by $150k); unused losses carry forward. On sale, claimed depreciation is recaptured at up to 25%, and gains may owe capital-gains tax (a 1031 exchange can defer both). Figures are a year-1 estimate at your 24.0% rate — not tax advice; consult a CPA.
Schools (NCES district)
- District
- Channelview ISD
- NCES district ID
- 4813590
- Math proficiency
- 27% ▼ -22.00%
- Reading proficiency
- 30% ▼ -8.00%
- Median HH income
- $52,320
- Composite
- 25.18/100
- National rank
- #7513
- State rank
- #640 of 826 in TX
Livability — Channelview
- Score
- 66/100
- State rank
- #598
- US rank
- #11392
Category grades
Schools grade is shown separately in the Schools card above.
Census & demographics
- Census place
- Channelview, TX
- County
- Harris County · 4,702,590 people
- City population
- 31,527
- Metro
- Houston-The Woodlands-Sugar Land, TX
- Population (ZIP)
- 31,527
- Household income
- $62,195
- Rent vs Own
- Severe rent burden
- 966.0
Population outlook (Harris County) Hauer SSP2
- Today (2025)
- 5,571,493 people
- By 2030
- 6,089,821 · +9.3%
- By 2040
- 7,142,806 · +28.2%
- By 2050
- 8,185,864 · +46.9%
- By 2075
- 10,574,329 · +89.8%
- By 2100
- 12,109,958 · +117.4%
Race, ethnicity, and origin ACS 2023
- Neighborhood character
- Predominantly Hispanic (71%)
- Race & ethnicity
- Hispanic / Latino 71% Two or more races 31% White 16% Black 9% Asian 4% Native American 1%
- Hispanic origin (detail)
- Mexican 61%
- Common ancestry
- Slovak 1% Lithuanian 1%
- Foreign-born
- 33% · Canada, Vietnam, Jamaica
- Languages at home
- 37% English-only · Spanish 60% Other Asian/Pacific 1% Vietnamese 1%
Political lean MEDSL · Harris
- 2024 margin
- Lean D (+5.5) · D 52.0% · R 46.4% · Other 1.6%
- 2008→2024 swing
- +3.9pp toward D · 2008: 1.6pp · 2024: 5.5pp
- All cycles
- 2024: D+5.5 2020: D+13.3 2016: D+12.4 2012: D+0.1 2008: D+1.6
Not yet ingested
- Civics
- —
Market trends
- HPI YoY
- ▼ -172.05%
- Current HPI
- 292.1862
- Rent YoY
- ▲ 16.85%
- Metro
- Houston-The Woodlands-Sugar Land, TX
- State GDP YoY
- ▲ 3.95%
- F500 in state
- 110
Industry mix (Fortune 500 HQ in TX)
| Industry | F500 HQs | Revenue |
|---|---|---|
| Energy | 16 | $1,198B |
|
||
| Technology | 5 | $198B |
|
||
| Engineering / Construction | 4 | $72B |
|
||
| Energy Services | 3 | $60B |
|
||
| Utilities | 3 | $41B |
|
||
| Healthcare | 2 | $330B |
|
||
Price history
+283.2% since first listed26 events — show timeline
- 2026-05-15 Listed $229,900 HARMLS
- 2025-04-01 Sold (Public Records) — Public Records
- 2025-04-01 Sold (MLS) — HARMLS
- 2025-03-19 Pending — HARMLS
- 2025-03-14 Pending — HARMLS
- 2024-10-13 Price Changed $217,900 HARMLS
- 2024-09-29 Listed $219,900 HARMLS
- 2019-03-18 Sold (Public Records) — Public Records
- 2019-03-15 Sold (MLS) — HARMLS
- 2019-02-17 Pending — HARMLS
- 2019-02-04 Relisted — HARMLS
- 2019-01-30 Pending — HARMLS
- 2019-01-02 Listed $167,900 HARMLS
- 2017-12-13 Sold (Public Records) — Public Records
- 2017-05-25 Sold (Public Records) — Public Records
- 2017-02-28 Listing Removed — HARMLS
- 2017-02-09 Relisted — HARMLS
- 2017-02-02 Pending — HARMLS
- 2017-01-06 Listed $140,000 HARMLS
- 2016-05-03 Sold (Public Records) — Public Records
- 2012-01-01 Listing Removed — HARMLS
- 2011-04-22 Listed $79,000 HARMLS
- 2010-10-17 Listing Removed — HARMLS
- 2010-10-02 Listed $87,000 HARMLS
- 1996-12-17 Sold (Public Records) — Public Records
- 1994-06-01 Sold (Public Records) $60,000 Public Records
Property tax history
+3.5%/yrLatest (2025): $4,481 · +4.1% YoY. Source: county tax records.
Cash-flow waterfall
monthlySold comps — $/sqft
last 12 mo · ≤1 miLoading sold comps…