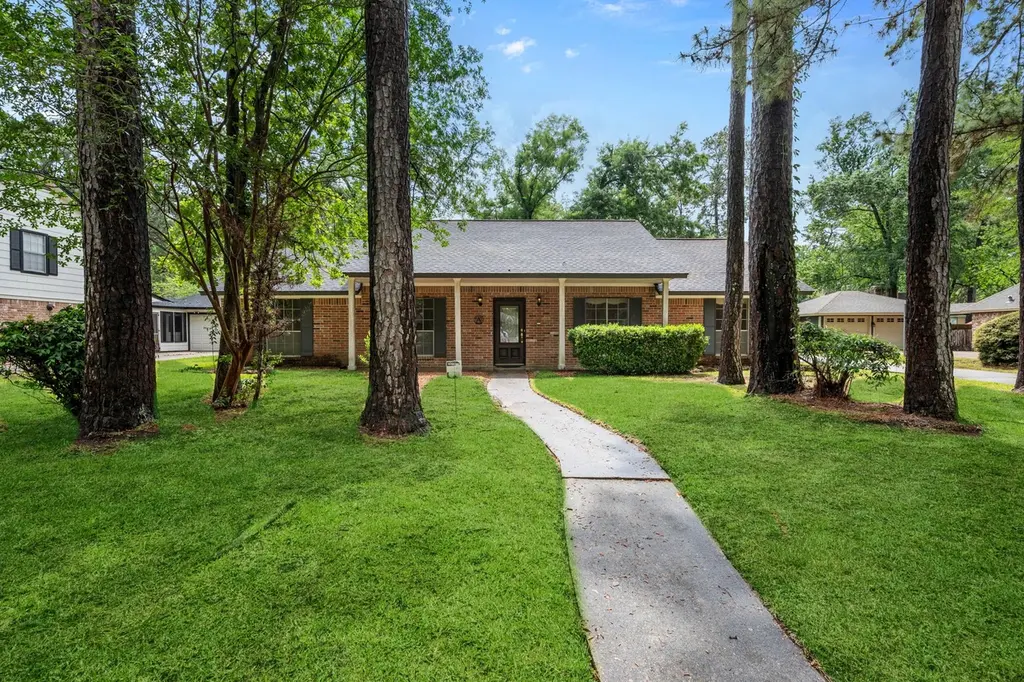
2006 Running Springs Dr · Houston, TX
Flood risk 4/10 · Minor
- FEMA flood zone
- X (unshaded)
- Chance of flooding over 30 yrs
- 0.22%
- Est. flood insurance / yr
- $507 – $1,088
Fire risk 1/10 · Minimal
- Est. fire insurance / yr
- $1,222 – $2,270
Heat risk 9/10 · Severe
- Hot days now (above 110°F)
- 7 days/yr
- Hot days in 30 yrs
- 24 days/yr
Wind risk 9/10 · Severe
- Chance of severe wind over 30 yrs
- 99.0%
Air-quality risk 3/10 · Minor
- Unhealthy air days now
- 3 days/yr
- Unhealthy air days in 30 yrs
- 3 days/yr
Risk factors via First Street. Map © Google.
Why this score? — see what drove the D grade
The composite is a weighted blend of 9 inputs, each scored 0–100. Each bar is that input's sub-score; the figure is the points it added to the 100-point composite (weight × sub-score).
- ARV discount +15.0/15.0
- Cash flow +6.7/30.0
- Appreciation +5.2/10.0
- Schools +3.9/10.0
- Livability +3.7/5.0
- 1% rule +3.1/10.0
- Condition / age +2.5/5.0
- Rent growth +2.4/5.0
- DSCR +1.0/10.0
$265,000
🖨 Deal sheet (PDF) 📄 Offer letter ✓ Due diligence
Listing remarks MLS
Traditional home located on a spacious lot. The home offers a formal living and dining room at the front. These rooms could also be used as a study or a game room. The kitchen and breakfast room are filled with natural light. The focal point of the family room is a fireplace with a large hearth and mantle. There are 3 spacious secondary bedrooms, and the secondary bathroom has double sinks and a door to the tub area. The owner's retreat is located at the rear of the home with a walk-in closet. The bathroom offers a lovely shower. A long driveway provides plenty of parking. The garage was replaced after Hurricane Beryl. The location offers quick access to HWY 59, shopping and local restaurants.
Key facts
- 0.26 acre lot
- 2 garage spots
- Community pool
Neighborhood map
What this means for you Summary
Snapshot
- This is a 4-bed/2.0-bath single-family listed at $265k.
Deal economics
- At list price, monthly cash flow is $-421 ($-5k/yr) — negative.
- To cash-flow at today's rent, offer at most $191k (28.1% below list).
- To meet the 1% rule (rent ≥ 1% of price), the offer needs to be $215k (19.0% below list).
- Recommended offer: $191k (28.1% below list) — sets the bar for cash-flow.
- Cap rate 4.4% vs local median 3.2% in Houston — top-decile yield for the area; either an underpriced asset or a hidden risk that comps aren't pricing in. Stress-test before assuming the spread holds.
Location & tenants
- Location reads 74/100 on livability (#184 in TX, #4,771 nationally) — a middle-class / working-renter tenant base. Strengths: amenities A+, cost of living A+, housing A+; Watch: crime F.
- Humble ISD (urban): math 38% / reading 44% proficiency, ranked #262 of 826 in TX (top 32%) — families likely to look elsewhere, expect single-tenant / working-renter base with shorter leases.
- Zoned schools: Foster El (math 42% / reading 43%, grade F, #1,313 of 4,322 statewide, top 31%, 559 students, 50% FRL); Kingwood Middle (math 39% / reading 44%, grade F, #595 of 1,662 statewide, top 37%, 1,002 students, 48% FRL); Humble H S (math 15% / reading 31%, grade F, #1,348 of 1,632 statewide, top 83%, 2,867 students, 77% FRL) — zoned schools average 58% FRL vs 32% district-wide (26 pts higher); higher-poverty schools than district average — tighter screening recommended.
- Market conditions: Rents soft (-0.6%/yr); 316 active listings in the ZIP; 15 comparable units currently listed for rent nearby; rentals at typical pace (median 26d on market — plan ~3-4 weeks tenant-placement turnaround); 47% of comp listings sitting > 30 days — soft ceiling on asking rent; solid renter incomes; 29,883 units permitted in Harris County in 2024 (8,621 in 5+ unit buildings).
- This rent runs 31% of the median local income ($84k/yr) — at the standard rent-burdened threshold; future hikes will face affordability resistance.
Forward outlook
- In year one you build about $3k of equity ($2k loan paydown + $1k appreciation (0.5% local appreciation)).
- Harris County population projected at +47% by 2050 — long-run rental-demand tailwind backs the buy-and-hold thesis.
- By year 9, paydown + projected appreciation supports a ~$31k cash-out refi (75% LTV) — recoverable capital for the next deal without selling this one.
Negotiation context
- It's been on market 40 days — a 3% lower offer ($257k) is reasonable based on typical stale-listing flexibility.
- 2 sale attempts since 22y ago with the ask held roughly flat each time — persistent listings suggest the price (not the market) is what's stuck; bring a comps-based counter.
Risks & watch-outs
- Watch-outs: property tax is 2.6% of price.
- Climate carrying-cost: severe wind risk, 99% chance of damaging wind over 30y; extreme-heat days projected 7→24/yr by 2055 (HVAC capex compounding) — expect insurance premiums to compound above CPI over the hold.
Questions for the listing agent
- What do current leases actually rent for vs. the listed asking? Can we see a recent rent roll and the last 12 months of T-12 income?
- It's been on market 40 days. Have you received any prior offers? Is the seller open to a 28% concession, seller financing, or rate buy-down credit?
- Built in 1974 — when were the roof, HVAC, electrical panel, plumbing, and water heater last replaced?
- Property tax is high relative to price — has the assessment been appealed recently, and will the sale trigger a re-assessment?
- What does the HOA fee cover, when was the last increase, and are there any pending special assessments or reserve-fund shortfalls?
- Is there a deadline driving the sale (1031 exchange, divorce, estate, relocation)? That informs how much negotiation room exists.
- Schools are D-rated, which usually means shorter tenancies and higher turnover. Who's the typical renter profile here, and what's been the actual vacancy rate?
- Crime grade is F in this area — have there been break-ins, vandalism, or insurance claims at this property in the last 3 years? What carrier currently insures it and at what premium?
- The area grade is low — what's the realistic commute time and amenity access for the typical tenant pool here? Any planned neighborhood developments (good or bad) we should know about?
- What's the average days-on-market for RENTAL listings here right now (not sales)? A rising rental-DOM trend means longer vacancies and softer asking-rent achievability than the comps imply.
- What's the recent tenant-quality profile in this submarket — average credit score on applications, eviction rate, late-payment / NSF rate, and stable-employment percentage? A property-management company in the area should have these aggregated.
- How much new for-sale + rental construction is in the pipeline within 1–3 miles? Heavy new supply typically softens prices + rents 12–24 months out; constrained supply supports both.
Investment metrics
- 1% rule
- 0.81% ✗
- Cap rate
- 4.38%
- Cash-on-cash
- -6.82%
- DSCR
- 0.70
- GRM
- 10.3
CMA / ARV
- ARV (median comp)
- $320,370
- List price
- $265,000
- Delta
- -17.28%
- Verdict
- UNDERPRICED
- Comps
- 20 within 1.0 mi
Show comp detail 12 sales within ~0.75 mi
| Address | Dist | Beds/Ba | Sqft | Sold | Price | $/sf | Match |
|---|---|---|---|---|---|---|---|
| 2006 Running Springs Dr | 0.00mi | 4/2.5 | 2,130 (0%) | 1mo | $265,000 | $124 | 98 |
| 2003 Hidden Creek Dr | 0.20mi | 4/2.5 | 2,241 (+5%) | 0mo | $298,000 | $133 | 80 |
| 1906 Maple Lakes Dr | 0.43mi | 4/2.5 | 2,109 (-1%) | 1mo | $325,000 | $154 | 76 |
| 1618 Stoney Park Dr | 0.51mi | 3/2.0 (-1) | 2,039 (-4%) | 2mo | $319,900 | $157 | 63 |
| 1710 Palomino Ln | 0.54mi | 4/2.5 | 2,294 (+8%) | 1mo | $360,000 | $157 | 59 |
| 2707 Wildridge Dr | 0.36mi | 4/2.5 | 2,388 (+12%) | 2mo | $315,000 | $132 | 59 |
| 1519 Sandy Park Dr | 0.57mi | 3/2.0 (-1) | 1,989 (-7%) | 3mo | $290,000 | $146 | 55 |
| 1707 Sandy Trail Ct | 0.43mi | 3/2.0 (-1) | 1,869 (-12%) | 1mo | $325,000 | $174 | 54 |
| 2202 Parkdale Dr | 0.57mi | 4/2.0 | 1,844 (-13%) | 1mo | $199,900 | $108 | 50 |
| 1946 Shadow Rock Dr | 0.63mi | 4/2.0 | 1,892 (-11%) | 3mo | $245,000 | $129 | 50 |
| 2203 Rolling Meadows Dr | 0.51mi | 3/2.5 (-1) | 2,395 (+12%) | 2mo | $334,999 | $140 | 47 |
| 1418 Summer Rain Dr | 0.72mi | 3/2.5 (-1) | 2,335 (+10%) | 1mo | $310,000 | $133 | 43 |
Match score weights: distance 35% · size 25% · config 20% · recency 20%. Top-matched comps best support the ARV.
Projected returns pro-forma
0.48% appreciation · 0.0% rent growth · sell at horizon
- IRR
- -9.8%
- Equity multiple
- 0.53×
- Total profit
- $-34,678
- Equity at exit
- $83,329
- IRR
- -5.9%
- Equity multiple
- 0.37×
- Total profit
- $-46,538
- Equity at exit
- $105,410
Cash invested: $74,200 (down + closing). Projections, not guarantees.
Landlord ↔ Tenant lean methodology
- Overall (STATE)
- 87 Strongly Landlord-Friendly
- State Texas
- 87 Strongly Landlord-Friendly · R+5
- County
- — inherits STATE
- City
- — inherits STATE
ZIP-level market 77339
- Home prices YoY
- 0.2%
- Rents YoY
- -0.6%
- Active inventory
- 316
- Price-to-rent
- 10.3×
Monthly cashflow live
- Estimated rent
- $2,146 high interval (Pro) →
- Mortgage (P&I)
- −$1,390
- Tax from tax record
- −$578 /mo · $6,941/yr
- Insurance
- −$110
- HOA
- −$38
- Vacancy / Maint / Mgmt
- −$451
- Net cashflow
- $-421
Break-even live
Sensitivity live
| Price | -10% $-271 | -5% $-346 | +0% $-421 | +5% $-496 | +10% $-571 |
|---|---|---|---|---|---|
| Rent | -10% $-591 | -5% $-506 | +0% $-421 | +5% $-337 | +10% $-252 |
| Rate | -1.0pp $-288 | -0.5pp $-354 | base $-421 | +0.5pp $-490 | +1.0pp $-560 |
UW: 25.0% down · 7.5% · 30yr · 1.5% tax · 5.0% vac · 8.0% maint · 8.0% mgmt
Financing live
Cash to close
- Down payment
- $66,250
- Closing costs
- $7,950
- Reserves months
- —
- Total cash needed
- —
Loan-product check · same deal, 3 products live
Conventional
25% down · 7.5% · 30yr
- Down + closing
- —
- Monthly P&I
- —
- Monthly cashflow
- —
- DSCR
- —
- Eligible?
- —
Personal DTI + credit; lowest rate.
DSCR
20% down · 8.5% · 30yr
- Down + closing
- —
- Monthly P&I
- —
- Monthly cashflow
- —
- DSCR
- —
- Eligible?
- —
No personal income docs; deal must DSCR.
Hard money
10% down · 12.0% · 12mo
- Down + closing
- —
- Monthly P&I
- —
- Monthly cashflow
- —
- DSCR
- —
- Eligible?
- —
Short-term bridge; refi at stabilization.
Rent comps 15 comps
| Address | Beds | Baths | Sqft | Rent | $/sqft | DOM | Units | Dist |
|---|---|---|---|---|---|---|---|---|
| 2003 Ridgeway Park Dr Kingwood, TX | 4.0 | 2.5 | 2477 | $1,850 | $0.75 | 45d | 1 | 0.40mi |
| 1735 Wilderness Park Ct Kingwood, TX | 3.0 | 2.5 | 2172 | $2,319 | $1.07 | 26d | 1 | 0.41mi |
| 2230 Lakeville Dr Kingwood, TX | 4.0 | 3.0 | 2456 | $2,400 | $0.98 | 45d | 1 | 0.44mi |
| 2135 Lake Hills Dr Kingwood, TX | 1.0–3.0 | 1.0–2.0 | 1061 | $1,570 | $1.48 | 0d | 12 | 0.75mi |
| 3515 Hidden Pines Dr Kingwood, TX | 3.0 | 2.5 | 1986 | $1,850 | $0.93 | 45d | 1 | 1.07mi |
| 21554 Kings Bend Dr Kingwood, TX | 3.0 | 2.0 | 1834 | $1,806 | $0.98 | 24d | 1 | 1.13mi |
| 21504 Palace Pines Dr Kingwood, TX | 3.0 | 2.5 | 2264 | $2,100 | $0.93 | 7d | 1 | 1.16mi |
| 2215 Silver Falls Dr Kingwood, TX | 4.0 | 2.0 | 2004 | $2,075 | $1.04 | 45d | 1 | 1.19mi |
| 21476 Palace Pines Dr Kingwood, TX | 3.0 | 2.0 | 1755 | $1,899 | $1.08 | 45d | 1 | 1.22mi |
| 21476 Palace Pines Dr Kingwood, TX | 3.0 | 2.0 | 1755 | $1,899 | $1.08 | 0d | 1 | 1.22mi |
| 26108 Knights Tower Ct Kingwood, TX | 4.0 | 2.5 | 2662 | $2,486 | $0.93 | 24d | 1 | 1.26mi |
| 2115 Oak Shores Dr Kingwood, TX | 3.0 | 2.0 | 1590 | $1,800 | $1.13 | 45d | 1 | 1.26mi |
| 21324 Kings Guild Ln Kingwood, TX | 4.0 | 2.5 | 2506 | $2,141 | $0.85 | 45d | 1 | 1.32mi |
| 2222 Riverford Dr Kingwood, TX | 3.0 | 3.0 | 1908 | $1,895 | $0.99 | 26d | 1 | 1.35mi |
| 3806 Village Oaks Dr Kingwood, TX | 4.0 | 2.5 | 2465 | $2,300 | $0.93 | 24d | 1 | 1.48mi |
HOA detail
- Monthly dues
- $38 · $456/yr
Listing history 7 events
-
2026-05-12status Pending 703-char remark
Show marketing remark (703 chars)
Traditional home located on a spacious lot. The home offers a formal living and dining room at the front. These rooms could also be used as a study or a game room. The kitchen and breakfast room are filled with natural light. The focal point of the family room is a fireplace with a large hearth and mantle. There are 3 spacious secondary bedrooms, and the secondary bathroom has double sinks and a door to the tub area. The owner's retreat is located at the rear of the home with a walk-in closet. The bathroom offers a lovely shower. A long driveway provides plenty of parking. The garage was replaced after Hurricane Beryl. The location offers quick access to HWY 59, shopping and local restaurants.
-
2026-05-07status Pending 703-char remark
Show marketing remark (703 chars)
Traditional home located on a spacious lot. The home offers a formal living and dining room at the front. These rooms could also be used as a study or a game room. The kitchen and breakfast room are filled with natural light. The focal point of the family room is a fireplace with a large hearth and mantle. There are 3 spacious secondary bedrooms, and the secondary bathroom has double sinks and a door to the tub area. The owner's retreat is located at the rear of the home with a walk-in closet. The bathroom offers a lovely shower. A long driveway provides plenty of parking. The garage was replaced after Hurricane Beryl. The location offers quick access to HWY 59, shopping and local restaurants.
-
2026-04-02$265,000 Active 703-char remark
Show marketing remark (703 chars)
Traditional home located on a spacious lot. The home offers a formal living and dining room at the front. These rooms could also be used as a study or a game room. The kitchen and breakfast room are filled with natural light. The focal point of the family room is a fireplace with a large hearth and mantle. There are 3 spacious secondary bedrooms, and the secondary bathroom has double sinks and a door to the tub area. The owner's retreat is located at the rear of the home with a walk-in closet. The bathroom offers a lovely shower. A long driveway provides plenty of parking. The garage was replaced after Hurricane Beryl. The location offers quick access to HWY 59, shopping and local restaurants.
-
2005-05-04soldstatus
-
2005-01-21historical
-
2004-10-21$134,900
-
1988-01-02soldstatus
ⓘ Source: listings_history table (triggers on properties + properties_extension) + one-shot
backfill from property_details.listing_events for pre-trigger history.
Tax reassessment forecast TX · Resets to sale price
- Current annual tax
- $6,941 · $578/mo
- Projected year-2 tax
- $6,941 · $578/mo
- Expected delta
- $0/yr ($0/mo · 0.0%)
ⓘ Screening estimate from a state-policy table — verify with the county assessor before closing.
Climate risk First Street
- Flood 4/10 Moderate FEMA zone X (unshaded) · 22% chance over 30 yrs
- Wildfire 1/10 Low
- Heat 9/10 Extreme 7 d/yr ≥110°F today · 24 d/yr by 30 yrs out
- Wind 9/10 Extreme 99% chance of damaging wind over 30 yrs
- Air quality 3/10 Moderate 3 unhealthy d/yr today · 3 by 30 yrs out
Nearby sold comps map
Loading sold comps map…
Walkable amenities ~0.75 mi
Loading nearby amenities…
Taxation est. · year 1
- Rental income
- $25,747
- − Mortgage interest
- −$14,844
- − Property taxes
- −$6,941
- − Insurance
- −$1,325
- − Repairs & maintenance
- −$2,060
- − Management
- −$2,060
- − HOA
- −$456
- − Depreciation
- −$7,709
- Taxable loss
- −$9,647
- Est. tax savings @ 24.0%
- +$2,315
- After-tax cash flow
- $-2,742/yr
For passive investors: Depreciation is non-cash, so a rental often shows a tax loss while cash-flowing — sheltering income. Rental losses are passive: they offset passive income freely, and up to $25,000/yr can offset ordinary (W-2) income if you actively participate and your MAGI is under $100k (phasing out to $0 by $150k); unused losses carry forward. On sale, claimed depreciation is recaptured at up to 25%, and gains may owe capital-gains tax (a 1031 exchange can defer both). Figures are a year-1 estimate at your 24.0% rate — not tax advice; consult a CPA.
Schools (NCES district)
- District
- Humble ISD
- NCES district ID
- 4823910
- Math proficiency
- 38% ▼ -11.00%
- Reading proficiency
- 44% ▼ -7.00%
- Median HH income
- $83,946
- Composite
- 38.55/100
- National rank
- #4171
- State rank
- #262 of 826 in TX
Livability — Houston
- Score
- 74/100
- State rank
- #184
- US rank
- #4771
Category grades
Schools grade is shown separately in the Schools card above.
Census & demographics
- Census place
- Houston, TX
- County
- Harris County · 4,702,590 people
- City population
- 3,226,434
- Metro
- Houston-The Woodlands-Sugar Land, TX
- Population (ZIP)
- 44,538
- Household income
- $84,102
- Rent vs Own
- Severe rent burden
- 2198.0
Population outlook (Harris County) Hauer SSP2
- Today (2025)
- 5,571,493 people
- By 2030
- 6,089,821 · +9.3%
- By 2040
- 7,142,806 · +28.2%
- By 2050
- 8,185,864 · +46.9%
- By 2075
- 10,574,329 · +89.8%
- By 2100
- 12,109,958 · +117.4%
Race, ethnicity, and origin ACS 2023
- Neighborhood character
- Diverse neighborhood (Simpson 0.58)
- Race & ethnicity
- White 59% Hispanic / Latino 24% Two or more races 13% Black 5% Asian 5%
- Hispanic origin (detail)
- Mexican 17%
- Common ancestry
- Lithuanian 3% Slovak 2% Portuguese 2%
- Foreign-born
- 12% · Canada, China, Jamaica
- Languages at home
- 77% English-only · Spanish 17% Other Indo-European 2% Vietnamese 1%
Political lean MEDSL · Harris
- 2024 margin
- Lean D (+5.5) · D 52.0% · R 46.4% · Other 1.6%
- 2008→2024 swing
- +3.9pp toward D · 2008: 1.6pp · 2024: 5.5pp
- All cycles
- 2024: D+5.5 2020: D+13.3 2016: D+12.4 2012: D+0.1 2008: D+1.6
Not yet ingested
- Civics
- —
Market trends
- HPI YoY
- ▲ 0.48%
- Current HPI
- 233.4147
- Rent YoY
- ▼ -0.59%
- Metro
- Houston-The Woodlands-Sugar Land, TX
- State GDP YoY
- ▲ 3.95%
- F500 in state
- 110
Industry mix (Fortune 500 HQ in TX)
| Industry | F500 HQs | Revenue |
|---|---|---|
| Energy | 16 | $1,198B |
|
||
| Technology | 5 | $198B |
|
||
| Engineering / Construction | 4 | $72B |
|
||
| Energy Services | 3 | $60B |
|
||
| Utilities | 3 | $41B |
|
||
| Healthcare | 2 | $330B |
|
||
Price history
+96.4% since first listed7 events — show timeline
- 2026-05-12 Pending — HARMLS
- 2026-05-07 Pending — HARMLS
- 2026-04-02 Listed $265,000 HARMLS
- 2005-05-04 Sold (Public Records) — Public Records
- 2005-01-21 Listing Removed — HARMLS
- 2004-10-21 Listed $134,900 HARMLS
- 1988-01-02 Sold (Public Records) — Public Records
Property tax history
+3.0%/yrLatest (2025): $6,941 · +6.8% YoY. Source: county tax records.
Cash-flow waterfall
monthlySold comps — $/sqft
last 12 mo · ≤1 miLoading sold comps…