 Duplex
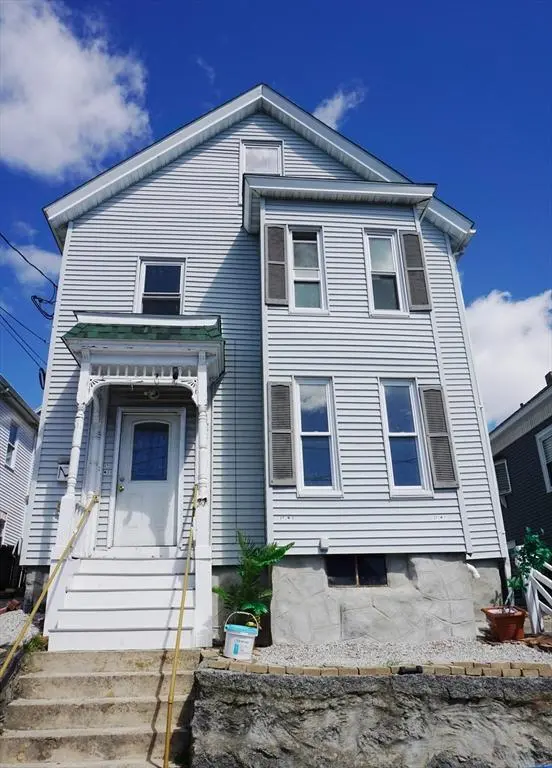
27 Shaw St · Lowell, MA
Flood risk 1/10 · Minimal
- FEMA flood zone
- X (unshaded)
- Chance of flooding over 30 yrs
- 0.0%
- Est. flood insurance / yr
- $473 – $860
Fire risk 1/10 · Minimal
- Est. fire insurance / yr
- $915 – $1,699
Heat risk 5/10 · Moderate
- Hot days now (above 96°F)
- 7 days/yr
- Hot days in 30 yrs
- 17 days/yr
Wind risk 6/10 · Moderate
- Chance of severe wind over 30 yrs
- 27.0%
Air-quality risk 3/10 · Minor
- Unhealthy air days now
- 2 days/yr
- Unhealthy air days in 30 yrs
- 3 days/yr
Risk factors via First Street. Map © Google.
Why this score? — see what drove the D+ grade
The composite is a weighted blend of 9 inputs, each scored 0–100. Each bar is that input's sub-score; the figure is the points it added to the 100-point composite (weight × sub-score).
- Cash flow +14.3/30.0
- ARV discount +11.0/15.0
- DSCR +4.3/10.0
- Livability +4.0/5.0
- 1% rule +3.5/10.0
- Rent growth +3.5/5.0
- Condition / age +2.5/5.0
- Schools +2.1/10.0
- Appreciation +0.0/10.0
$650,000
🖨 Deal sheet (PDF) 📄 Offer letter ✓ Due diligence
Multi-family units
County records classify this as Multi-Family (2-4 Unit). Listing-text estimate: 2 units. confirmed
Listing remarks MLS
Bank Owned Property! All Offers MUST be accompanied with lender specific Pre-Approval or Proof or Funds Letter. Offers are subject to Bank’s Addendum. This home is sold “As Is”; Home Inspection for informational purposes only and must be completed within 5 days of signed offer. Offer instructions and sample addendums available through MA Pass.
Key facts
- Large eat-in kitchen
- Bonus room
- Two family home
Tags
Property features AI
Finance
- Other: Building total area listed as 3,064; Lot size approximately 0.08 acres; Public records as source for year built
- Financial info: No investor-specific income or expense details provided
- HOA & community: Not a senior community; Community offers nearby public transportation, shopping, medical facility, laundromat, highway access, public school, T-Station, and university access
Exterior
- Parking: Open parking available
- Security: No security features listed
- Utilities: Public water; Public sewer; Electric with circuit breakers
- Home design: Multi-family property; 3 total stories; 3 levels total; Approximate year built (from public records); Solar energy generation
- Construction: Frame construction; Stone foundation
- Exterior features: Gentle sloping lot; Public road frontage; Shingle roof
Interior
- Kitchen: Includes standard kitchen (specific appliances not listed)
- Bedrooms: Unit 1: 1 level; Unit 2: 2 levels
- Flooring: Vinyl flooring
- Bathrooms: 2 full bathrooms
- Heating & cooling: 2 heating units; No cooling units listed
- Interior features: Living room; Kitchen; 13 total rooms
- Laundry & utility: No specific laundry appliances listed
Neighborhood map
What this means for you Summary
Snapshot
- This is a 2 × 4-bed/1.0-bath units multifamily listed at $650k.
Deal economics
- At list price, monthly cash flow is $116 ($1k/yr) — positive. Per door: $58/mo.
- The deal already cash-flows at list — no discount required.
- To meet the 1% rule (rent ≥ 1% of price), the offer needs to be $552k (15.1% below list).
- Recommended offer: $552k (15.1% below list) — sets the bar for 1% rule.
- Cap rate 6.5% vs local median 2.9% in Lowell — top-decile yield for the area; either an underpriced asset or a hidden risk that comps aren't pricing in. Stress-test before assuming the spread holds.
Location & tenants
- Location reads 80/100 on livability (#36 in MA, #1,677 nationally) — a professional / high-income tenant draw. Strengths: amenities A+, commute A+, health & safety A+; Watch: crime F, cost of living F.
- Lowell (suburban): math 20% / reading 28% proficiency, ranked #277 of 302 in MA (top 92%) — low school quality limits family demand, transient renter base, plan for 1-2y turnover; 64% free/reduced lunch — lower-income household profile, screen leases tightly.
- Zoned schools: Abraham Lincoln (math 17% / reading 32%, grade F, #721 of 938 statewide, top 79%, 492 students, 0% FRL); Lowell High (math 40% / reading 50%, grade D-, #201 of 343 statewide, top 59%, 3,167 students, 0% FRL) — zoned schools average 0% FRL vs 64% district-wide (64 pts lower); this property's tenant base skews higher-income than the district average.
- Market conditions: Rents rising fast (+4.2%/yr); 22 active listings in the ZIP; 1 comparable units currently listed for rent nearby; solid renter incomes; 3,670 units permitted in Middlesex County in 2024 (2,611 in 5+ unit buildings).
- At $5,516/mo this rent would consume 72% of the median local household income ($92k/yr) (locally 1866% of renters already pay >50% of income on rent) — very limited rent-growth headroom before tenants either downsize or default.
Forward outlook
- Local home prices are declining (-3.0%/yr); year-one equity from $4k of loan paydown is wiped out by about $20k of value loss. Plan a longer hold.
- Middlesex County population projected at +20% by 2050 — long-run rental-demand tailwind backs the buy-and-hold thesis.
Negotiation context
- It's been on market 60 days — a 3% lower offer ($630k) is reasonable based on typical stale-listing flexibility.
- 5 sale attempts since 31y ago; this cycle's ask has dropped $55k (8%) from the opening price — seller is motivated, your offer sets the floor, not the list.
- Current owner paid $112k; list at $650k implies a 480% gain — meaningful room to come down on a strong offer.
Risks & watch-outs
- Watch-outs: built in 1900 — expect roof / HVAC / electrical / plumbing capex.
- Climate carrying-cost: major wind risk, 27% chance of damaging wind over 30y; extreme-heat days projected 7→17/yr by 2055 (HVAC capex compounding) — expect insurance premiums to compound above CPI over the hold.
Questions for the listing agent
- It's been on market 60 days. Have you received any prior offers? Is the seller open to a 15% concession, seller financing, or rate buy-down credit?
- Can we see the unit-by-unit rent roll, current vacancy, and any below-market leases? What's the average tenancy length?
- What capital expenditures (roof, boiler, parking lot, exteriors) have been made in the last 5 years, and what's planned in the next 2?
- Built in 1900 — when were the roof, HVAC, electrical panel, plumbing, and water heater last replaced?
- Is there a deadline driving the sale (1031 exchange, divorce, estate, relocation)? That informs how much negotiation room exists.
- Crime grade is F in this area — have there been break-ins, vandalism, or insurance claims at this property in the last 3 years? What carrier currently insures it and at what premium?
- The area grade is low — what's the realistic commute time and amenity access for the typical tenant pool here? Any planned neighborhood developments (good or bad) we should know about?
- What's the average days-on-market for RENTAL listings here right now (not sales)? A rising rental-DOM trend means longer vacancies and softer asking-rent achievability than the comps imply.
- What's the recent tenant-quality profile in this submarket — average credit score on applications, eviction rate, late-payment / NSF rate, and stable-employment percentage? A property-management company in the area should have these aggregated.
- How much new apartment / multifamily construction is in the pipeline within 1–3 miles? Heavy new supply (>2% of stock underway) typically softens rents 12–24 months out; light construction supports rent growth.
Investment metrics
- 1% rule
- 0.85% ✗
- Cap rate
- 6.51%
- Cash-on-cash
- 0.76%
- DSCR
- 1.03
- GRM
- 9.8
CMA / ARV
- ARV (median comp)
- $704,963
- List price
- $650,000
- Delta
- -7.80%
- Verdict
- FAIR
- Comps
- 20 within 1.0 mi
Show comp detail 12 sales within ~0.75 mi
| Address | Dist | Beds/Ba | Sqft | Sold | Price | $/sf | Match |
|---|---|---|---|---|---|---|---|
| 118 & 120 Gates St | 0.24mi | 7/2.0 | 2,793 (-9%) | 12mo | $685,000 | $245 | 64 |
| 246-248 Shaw St | 0.41mi | 6/2.0 (-1) | 2,916 (-5%) | 6mo | $672,000 | $230 | 63 |
| 117-119 Liberty | 0.16mi | 7/2.0 | 2,626 (-14%) | 13mo | $683,000 | $260 | 58 |
| 23 Ralph St | 0.41mi | 7/3.0 | 3,288 (+7%) | 16mo | $595,000 | $181 | 52 |
| 53 Royal St | 0.34mi | 6/2.5 (-1) | 3,444 (+12%) | 7mo | $730,000 | $212 | 51 |
| 36 Highland Ave | 0.62mi | 6/2.0 (-1) | 3,215 (+5%) | 10mo | $860,000 | $267 | 50 |
| 390 Wilder St | 0.53mi | 6/2.0 (-1) | 2,963 (-3%) | 18mo | $755,000 | $255 | 50 |
| 23-25 Mckinley Ave | 0.75mi | 6/3.0 (-1) | 3,126 (+2%) | 7mo | $710,000 | $227 | 47 |
| 143 Branch St | 0.49mi | 8/4.0 (+1) | 2,927 (-4%) | 11mo | $680,000 | $232 | 47 |
| 242 Parker St | 0.53mi | 6/2.0 (-1) | 2,829 (-8%) | 12mo | $670,000 | $237 | 47 |
| 68 Forest St | 0.65mi | 6/2.0 (-1) | 2,798 (-9%) | 11mo | $735,000 | $263 | 41 |
| 1000 Central St | 0.72mi | 8/3.5 (+1) | 3,426 (+12%) | 8mo | $815,000 | $238 | 29 |
Match score weights: distance 35% · size 25% · config 20% · recency 20%. Top-matched comps best support the ARV.
Projected returns pro-forma
-3.0% appreciation · 4.15% rent growth · sell at horizon
- IRR
- -13.9%
- Equity multiple
- 0.50×
- Total profit
- $-91,573
- Equity at exit
- $96,917
- IRR
- -3.4%
- Equity multiple
- 0.76×
- Total profit
- $-43,419
- Equity at exit
- $56,200
Cash invested: $182,000 (down + closing). Projections, not guarantees.
Landlord ↔ Tenant lean methodology
- Overall (STATE)
- 20 Strongly Tenant-Friendly
- State Massachusetts
- 20 Strongly Tenant-Friendly · D+15
- County
- — inherits STATE
- City
- — inherits STATE
ZIP-level market 01851
- Home prices YoY
- -22.6%
- Rents YoY
- 4.2%
- Active inventory
- 22
- Price-to-rent
- 19.6×
Monthly cashflow live
- Estimated rent
- $5,516 high interval (Pro) →
- Mortgage (P&I)
- −$3,409
- Tax from tax record
- −$562 /mo · $6,749/yr
- Insurance
- −$271
- HOA
- −$0
- Vacancy / Maint / Mgmt
- −$1,158
- Net cashflow
- $116
Break-even live
Sensitivity live
| Price | -10% $484 | -5% $300 | +0% $116 | +5% $-68 | +10% $-252 |
|---|---|---|---|---|---|
| Rent | -10% $-320 | -5% $-102 | +0% $116 | +5% $334 | +10% $551 |
| Rate | -1.0pp $443 | -0.5pp $281 | base $116 | +0.5pp $-53 | +1.0pp $-224 |
2-unit breakdown (identical units grouped — click to expand)
| Units | Beds | Baths | Est. rent |
|---|---|---|---|
| 2× units | 4 | 1 | $5,516 |
| #1 | 4 | 1 | $2,758 |
| #2 | 4 | 1 | $2,758 |
| Total (2 units) | $5,516 | ||
UW: 25.0% down · 7.5% · 30yr · 1.5% tax · 5.0% vac · 8.0% maint · 8.0% mgmt
Financing live
Cash to close
- Down payment
- $162,500
- Closing costs
- $19,500
- Reserves months
- —
- Total cash needed
- —
Loan-product check · same deal, 3 products live
Conventional
25% down · 7.5% · 30yr
- Down + closing
- —
- Monthly P&I
- —
- Monthly cashflow
- —
- DSCR
- —
- Eligible?
- —
Personal DTI + credit; lowest rate.
DSCR
20% down · 8.5% · 30yr
- Down + closing
- —
- Monthly P&I
- —
- Monthly cashflow
- —
- DSCR
- —
- Eligible?
- —
No personal income docs; deal must DSCR.
Hard money
10% down · 12.0% · 12mo
- Down + closing
- —
- Monthly P&I
- —
- Monthly cashflow
- —
- DSCR
- —
- Eligible?
- —
Short-term bridge; refi at stabilization.
Rent comps 1 comps
| Address | Beds | Baths | Sqft | Rent | $/sqft | DOM | Units | Dist |
|---|---|---|---|---|---|---|---|---|
| 13 Phillips St Lowell, MA | 6.0 | 2.0 | 2500 | $3,500 | $1.40 | 45d | 1 | 0.90mi |
Listing history 30 events
-
2026-06-21days on market $650,000 Active 60 DOM
-
2026-06-18days on market $650,000 Active 57 DOM
-
2026-06-17days on market $650,000 Active 56 DOM
-
2026-06-16days on market $650,000 Active 55 DOM
-
2026-06-15days on market $650,000 Active 54 DOM
-
2026-06-13days on market $650,000 Active 52 DOM
-
2026-06-13days on market $650,000 Active 51 DOM
-
2026-06-09days on market $650,000 Active 48 DOM
-
2026-06-08days on market $650,000 Active 47 DOM
-
2026-06-07statusdays on market $650,000 Active 46 DOM
-
2026-06-04days on market $650,000 Price Changed 43 DOM
-
2026-06-03pricestatusdays on market $650,000 Price Changed 42 DOM
-
2026-06-02days on market $675,000 Active 41 DOM
-
2026-06-01days on market $675,000 Active 40 DOM
-
2026-05-31days on market $675,000 Active 39 DOM
-
2026-05-04price $675,000 678-char remark
-
2026-04-22$705,000 New 678-char remark
-
2026-04-10price $2,650
-
2026-03-21$2,900
-
2010-06-30soldstatus $112,000 Sold 363-char remark
Show marketing remark (363 chars)
Bank Owned Property! All Offers MUST be accompanied with lender specific Pre-Approval or Proof or Funds Letter. Offers are subject to Bank’s Addendum. This home is sold “As Is”; Home Inspection for informational purposes only and must be completed within 5 days of signed offer. Offer instructions and sample addendums available through MA Pass.
-
2010-05-28historical Active (Accepted Offer to Purchase) 363-char remark
Show marketing remark (363 chars)
Bank Owned Property! All Offers MUST be accompanied with lender specific Pre-Approval or Proof or Funds Letter. Offers are subject to Bank’s Addendum. This home is sold “As Is”; Home Inspection for informational purposes only and must be completed within 5 days of signed offer. Offer instructions and sample addendums available through MA Pass.
-
2010-05-25$97,900 New 363-char remark
Show marketing remark (363 chars)
Bank Owned Property! All Offers MUST be accompanied with lender specific Pre-Approval or Proof or Funds Letter. Offers are subject to Bank’s Addendum. This home is sold “As Is”; Home Inspection for informational purposes only and must be completed within 5 days of signed offer. Offer instructions and sample addendums available through MA Pass.
-
1998-10-13soldstatus $73,500
Show marketing remark (132 chars)
GOOD RENTAL PROPERTY. CONVENIENT LOCATION. MANY UPDATES. HEAT: 1ST FL. FHAXGAS; 2ND FL. GAS SPACE HEATER; 3RD, ELECTRIC BASE BOARD.
-
1998-10-13soldstatus $73,500
Show marketing remark (132 chars)
GOOD RENTAL PROPERTY. CONVENIENT LOCATION. MANY UPDATES. HEAT: 1ST FL. FHAXGAS; 2ND FL. GAS SPACE HEATER; 3RD, ELECTRIC BASE BOARD.
-
1998-08-06historical
Show marketing remark (132 chars)
GOOD RENTAL PROPERTY. CONVENIENT LOCATION. MANY UPDATES. HEAT: 1ST FL. FHAXGAS; 2ND FL. GAS SPACE HEATER; 3RD, ELECTRIC BASE BOARD.
-
1998-07-27$74,900
Show marketing remark (132 chars)
GOOD RENTAL PROPERTY. CONVENIENT LOCATION. MANY UPDATES. HEAT: 1ST FL. FHAXGAS; 2ND FL. GAS SPACE HEATER; 3RD, ELECTRIC BASE BOARD.
-
1995-11-07soldstatus $38,000
-
1995-11-07soldstatus $38,000
-
1995-10-11historical
-
1995-08-14$39,900
ⓘ Source: listings_history table (triggers on properties + properties_extension) + one-shot
backfill from property_details.listing_events for pre-trigger history.
Tax reassessment forecast MA · Partial reset (capped growth)
- Current annual tax
- $6,749 · $562/mo
- Projected year-2 tax
- $7,372 · $614/mo
- Expected delta
- +$623/yr (+$52/mo · 9.2%)
ⓘ Screening estimate from a state-policy table — verify with the county assessor before closing.
Climate risk First Street
- Flood 1/10 Low FEMA zone X (unshaded) · 0% chance over 30 yrs
- Wildfire 1/10 Low
- Heat 5/10 Major 7 d/yr ≥96°F today · 17 d/yr by 30 yrs out
- Wind 6/10 Major 27% chance of damaging wind over 30 yrs
- Air quality 3/10 Moderate 2 unhealthy d/yr today · 3 by 30 yrs out
Nearby sold comps map
Loading sold comps map…
Walkable amenities ~0.75 mi
Loading nearby amenities…
Taxation est. · year 1
- Rental income
- $66,192
- − Mortgage interest
- −$36,410
- − Property taxes
- −$6,749
- − Insurance
- −$3,250
- − Repairs & maintenance
- −$5,295
- − Management
- −$5,295
- − Depreciation
- −$18,909
- Taxable loss
- −$9,717
- Est. tax savings @ 24.0%
- +$2,332
- After-tax cash flow
- $3,721/yr
For passive investors: Depreciation is non-cash, so a rental often shows a tax loss while cash-flowing — sheltering income. Rental losses are passive: they offset passive income freely, and up to $25,000/yr can offset ordinary (W-2) income if you actively participate and your MAGI is under $100k (phasing out to $0 by $150k); unused losses carry forward. On sale, claimed depreciation is recaptured at up to 25%, and gains may owe capital-gains tax (a 1031 exchange can defer both). Figures are a year-1 estimate at your 24.0% rate — not tax advice; consult a CPA.
Schools (NCES district)
- District
- Lowell
- NCES district ID
- 2507020
- Math proficiency
- 20% ▼ -18.00%
- Reading proficiency
- 28% ▼ -11.00%
- Median HH income
- $49,291
- Composite
- 21.14/100
- National rank
- #8430
- State rank
- #277 of 302 in MA
Livability — Lowell
- Score
- 80/100
- State rank
- #36
- US rank
- #1677
Category grades
Schools grade is shown separately in the Schools card above.
Census & demographics
- Census place
- Lowell, MA
- County
- Middlesex County · 1,437,704 people
- City population
- 100,628
- Metro
- Boston-Cambridge-Newton, MA-NH
- Population (ZIP)
- 33,403
- Household income
- $92,401
- Rent vs Own
- Severe rent burden
- 1866.0
Population outlook (Middlesex County) Hauer SSP2
- Today (2025)
- 1,740,269 people
- By 2030
- 1,817,187 · +4.4%
- By 2040
- 1,963,195 · +12.8%
- By 2050
- 2,087,461 · +20.0%
- By 2075
- 2,344,036 · +34.7%
- By 2100
- 2,383,776 · +37.0%
Race, ethnicity, and origin ACS 2023
- Neighborhood character
- Highly diverse neighborhood (Simpson 0.71)
- Race & ethnicity
- Asian 40% White 31% Hispanic / Latino 14% Black 9% Two or more races 8%
- Hispanic origin (detail)
- Puerto Rican 6% Dominican 4%
- Common ancestry
- Estonian 3% Lithuanian 3% Romanian 2%
- Foreign-born
- 39% · Canada, Vietnam, Jamaica
- Languages at home
- 48% English-only · Other Asian/Pacific 26% Spanish 10% Other Indo-European 7%
Political lean MEDSL · Middlesex
- 2024 margin
- Solid D (+39.5) · D 68.5% · R 29.0% · Other 2.5%
- 2008→2024 swing
- +9.3pp toward D · 2008: 30.1pp · 2024: 39.5pp
- All cycles
- 2024: D+39.5 2020: D+45.2 2016: D+38.1 2012: D+26.9 2008: D+30.1
Not yet ingested
- Civics
- —
Market trends
- HPI YoY
- ▼ -120.87%
- Current HPI
- 414.2799
- Rent YoY
- ▲ 4.15%
- Metro
- Boston-Cambridge-Newton, MA-NH
- State GDP YoY
- ▲ 2.28%
- F500 in state
- 38
Industry mix (Fortune 500 HQ in MA)
| Industry | F500 HQs | Revenue |
|---|---|---|
| Technology | 3 | $17B |
|
||
| Insurance | 2 | $84B |
|
||
| Retail | 2 | $76B |
|
||
| Life Sciences | 1 | $43B |
|
||
| Energy Technology | 1 | $31B |
|
||
| Aerospace / Defense | 1 | $18B |
|
||
Price history
+1529.1% since first listed16 events — show timeline
- 2026-06-02 Price Changed $650,000 MLS PIN
- 2026-05-04 Price Changed $675,000 MLS PIN
- 2026-04-22 Listed $705,000 MLS PIN
- 2026-04-10 Price Changed $2,650 RENTALBEAST
- 2026-03-21 Listed for Rent $2,900 RENTALBEAST
- 2010-06-30 Sold (MLS) $112,000 MLS PIN
- 2010-05-28 Contingent — MLS PIN
- 2010-05-25 Listed $97,900 MLS PIN
- 1998-10-13 Sold (Public Records) $73,500 Public Records
- 1998-10-13 Sold (MLS) $73,500 MLS PIN
- 1998-08-06 Listing Removed — MLS PIN
- 1998-07-27 Listed $74,900 MLS PIN
- 1995-11-07 Sold (Public Records) $38,000 Public Records
- 1995-11-07 Sold (MLS) $38,000 MLS PIN
- 1995-10-11 Listing Removed — MLS PIN
- 1995-08-14 Listed $39,900 MLS PIN
Property tax history
+5.5%/yrLatest (2025): $6,749 · +7.9% YoY. Source: county tax records.
Cash-flow waterfall
monthlySold comps — $/sqft
last 12 mo · ≤1 miLoading sold comps…