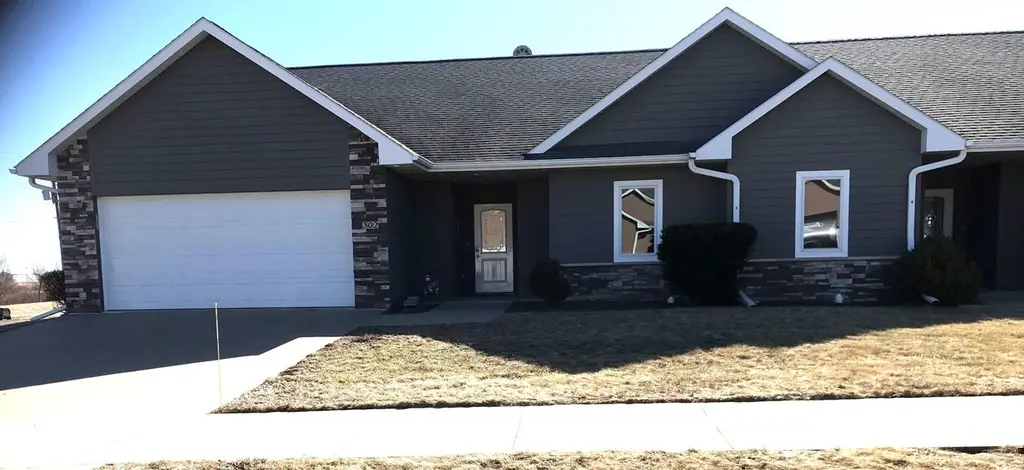
302 Coneflower Ct · Monroe, IA
Flood risk 1/10 · Minimal
- FEMA flood zone
- X (unshaded)
- Chance of flooding over 30 yrs
- 0.0%
- Est. flood insurance / yr
- $507 – $1,088
Fire risk 3/10 · Minor
- Est. fire insurance / yr
- $902 – $1,676
Heat risk 3/10 · Minor
- Hot days now (above 105°F)
- 7 days/yr
- Hot days in 30 yrs
- 15 days/yr
Wind risk 2/10 · Minimal
- Chance of severe wind over 30 yrs
- —
Air-quality risk 1/10 · Minimal
- Unhealthy air days now
- 0 days/yr
- Unhealthy air days in 30 yrs
- 0 days/yr
Risk factors via First Street. Map © Google.
Why this score? — see what drove the D grade
The composite is a weighted blend of 9 inputs, each scored 0–100. Each bar is that input's sub-score; the figure is the points it added to the 100-point composite (weight × sub-score).
- ARV discount +15.0/15.0
- Appreciation +9.6/10.0
- Schools +6.0/10.0
- Livability +4.0/5.0
- Rent growth +2.5/5.0
- Condition / age +2.5/5.0
- Cash flow +1.2/30.0
- 1% rule +0.0/10.0
- DSCR +0.0/10.0
$279,000
🖨 Deal sheet (PDF) 📄 Offer letter ✓ Due diligence
Listing remarks MLS
This immaculate 2 BR/2 Bath, 1338 SF town home located on a spacious corner lot in small-town Iowa awaits you! The front entrance opens to a beautiful foyer connecting you to the main living area; a spacious open concept living/dining/ kitchen area with vinyl plank flooring, beautiful woodwork, ceiling fans, Anderson windows, central air and accent lighting for your comfort and convenience. Appliances include a refrigerator, microwave, stove and dishwasher. The laundry area includes a large walk-in pantry and hidden crawl space for utilities below that include the furnace, sump pump, radon extraction hook-ups and an on-demand water heater. Beautiful oak finished cupboards in the kitchen will provide ample storage space. There are two bedrooms; both carpeted. The master bathroom features a ¾ bath with walk-in shower and large walk-in closet. The 2nd bedroom is located near the front hallway and is next to the main full bathroom. A nice outdoor entertainment area features a 16 X 16 vinyl composite deck that is virtually maintenance free! The 400 SF attached garage will provide protection for your vehicles and additional storage space. This nearly maintenance-free home located within blocks of uptown amenities can be yours!
Key facts
- Open concept living
- Corner lot
- Vinyl plank flooring
Tags
Neighborhood map
What this means for you Summary
Snapshot
- This is a 2-bed/2.0-bath single-family listed at $279k.
Deal economics
- At list price, monthly cash flow is $-1k ($-14k/yr) — negative.
- To cash-flow at today's rent, offer at most $79k (71.7% below list).
- To meet the 1% rule (rent ≥ 1% of price), the offer needs to be $110k (60.5% below list).
- Recommended offer: $79k (71.7% below list) — sets the bar for cash-flow.
Location & tenants
- Location reads 79/100 on livability (#118 in IA, #2,215 nationally) — a middle-class / working-renter tenant base. Strengths: crime A+, cost of living A+, housing A+; Watch: amenities F, commute F.
- Pcm Community School District (rural): math 65% / reading 75% proficiency, ranked #124 of 289 in IA (top 43%) — strong family-tenant draw, lease renewals of 3-5y typical; only 18% free/reduced lunch — higher-income household profile.
- Zoned schools: Prairie City Elementary School (math 72% / reading 77%, grade A, #131 of 616 statewide, top 27%, 320 students, 25% FRL); Pcm Middle School (math 65% / reading 72%, grade A, #126 of 246 statewide, top 53%, 247 students, 29% FRL); Pcm High School (math 64% / reading 83%, grade B+, #108 of 336 statewide, top 33%, 357 students, 21% FRL).
- Market conditions: 36 active listings in the ZIP; 16 units permitted in Jasper County in 2024 (0 in 5+ unit buildings).
Forward outlook
- In year one you build about $28k of equity ($2k loan paydown + $26k appreciation (9.3% local appreciation)).
- Jasper County population projected to shrink 7% by 2050 — rents likely to lag national; underwrite the cash flow, not the appreciation.
- By year 2, paydown + projected appreciation supports a ~$45k cash-out refi (75% LTV) — recoverable capital for the next deal without selling this one.
Negotiation context
- It's been on market 118 days — a 9% lower offer ($254k) is reasonable based on typical stale-listing flexibility.
- 4 sale attempts since 11y ago with the ask held roughly flat each time — persistent listings suggest the price (not the market) is what's stuck; bring a comps-based counter.
- Current owner paid $165k; list at $279k implies a 69% gain — meaningful room to come down on a strong offer.
Questions for the listing agent
- What do current leases actually rent for vs. the listed asking? Can we see a recent rent roll and the last 12 months of T-12 income?
- It's been on market 118 days. Have you received any prior offers? Is the seller open to a 72% concession, seller financing, or rate buy-down credit?
- What does the HOA fee cover, when was the last increase, and are there any pending special assessments or reserve-fund shortfalls?
- Why hasn't it sold? Are there any deal-killer items the seller is aware of (foundation, flood, title, zoning, code violations)?
- Is there a deadline driving the sale (1031 exchange, divorce, estate, relocation)? That informs how much negotiation room exists.
- Schools are A-rated — typically a magnet for longer-tenancy family renters. What's the average tenant stay here, and is there a school-zone premium baked into asking?
- The area grade is low — what's the realistic commute time and amenity access for the typical tenant pool here? Any planned neighborhood developments (good or bad) we should know about?
- What's the average days-on-market for RENTAL listings here right now (not sales)? A rising rental-DOM trend means longer vacancies and softer asking-rent achievability than the comps imply.
- What's the recent tenant-quality profile in this submarket — average credit score on applications, eviction rate, late-payment / NSF rate, and stable-employment percentage? A property-management company in the area should have these aggregated.
- How much new for-sale + rental construction is in the pipeline within 1–3 miles? Heavy new supply typically softens prices + rents 12–24 months out; constrained supply supports both.
Investment metrics
- 1% rule
- 0.40% ✗
- Cap rate
- 1.42%
- Cash-on-cash
- -17.39%
- DSCR
- 0.23
- GRM
- 21.1
CMA / ARV
- ARV (median comp)
- $363,302
- List price
- $279,000
- Delta
- -23.20%
- Verdict
- UNDERPRICED
- Comps
- 3 within 1.0 mi
Show comp detail 8 sales within ~0.75 mi
| Address | Dist | Beds/Ba | Sqft | Sold | Price | $/sf | Match |
|---|---|---|---|---|---|---|---|
| 302 Big Bluestem Dr | 0.06mi | 3/2.5 (+1) | 1,308 (-2%) | 8mo | $295,000 | $226 | 80 |
| 312 Coneflower Ct | 0.07mi | 2/2.0 | 1,352 (+1%) | 20mo | $309,000 | $229 | 79 |
| 310 Coneflower Ct | 0.05mi | 2/2.0 | 1,240 (-7%) | 17mo | $330,000 | $266 | 71 |
| 414 Prairie Dr | 0.24mi | 3/2.0 (+1) | 1,444 (+8%) | 12mo | $300,000 | $208 | 61 |
| 406 Coneflower Ct | 0.12mi | 3/3.5 (+1) | 1,269 (-5%) | 20mo | $352,000 | $277 | 58 |
| 404 Prairie Dr | 0.16mi | 3/2.5 (+1) | 1,176 (-12%) | 22mo | $245,000 | $208 | 47 |
| 606 W South St | 0.45mi | 2/2.0 | 1,144 (-14%) | 15mo | $245,000 | $214 | 42 |
| 313 E Marion St | 0.61mi | 3/2.0 (+1) | 1,200 (-10%) | 13mo | $297,500 | $248 | 38 |
Match score weights: distance 35% · size 25% · config 20% · recency 20%. Top-matched comps best support the ARV.
Projected returns pro-forma
9.3% appreciation · 3.0% rent growth · sell at horizon
- IRR
- 10.5%
- Equity multiple
- 1.85×
- Total profit
- $66,593
- Equity at exit
- $237,179
- IRR
- 11.6%
- Equity multiple
- 4.20×
- Total profit
- $249,931
- Equity at exit
- $497,126
Cash invested: $78,120 (down + closing). Projections, not guarantees.
Landlord ↔ Tenant lean methodology
- Overall (STATE)
- 83 Strongly Landlord-Friendly
- State Iowa
- 83 Strongly Landlord-Friendly · R+6
- County
- — inherits STATE
- City
- — inherits STATE
ZIP-level market 50170
- Home prices YoY
- 3.6%
- Active inventory
- 36
- Price-to-rent
- 21.1×
Monthly cashflow live
- Estimated rent
- $1,103 medium interval (Pro) →
- Mortgage (P&I)
- −$1,463
- Tax from tax record
- −$324 /mo · $3,888/yr
- Insurance
- −$116
- HOA
- −$100
- Vacancy / Maint / Mgmt
- −$232
- Net cashflow
- $-1,132
Break-even live
Sensitivity live
| Price | -10% $-974 | -5% $-1,053 | +0% $-1,132 | +5% $-1,211 | +10% $-1,290 |
|---|---|---|---|---|---|
| Rent | -10% $-1,219 | -5% $-1,176 | +0% $-1,132 | +5% $-1,089 | +10% $-1,045 |
| Rate | -1.0pp $-992 | -0.5pp $-1,061 | base $-1,132 | +0.5pp $-1,204 | +1.0pp $-1,278 |
UW: 25.0% down · 7.5% · 30yr · 1.5% tax · 5.0% vac · 8.0% maint · 8.0% mgmt
Financing live
Cash to close
- Down payment
- $69,750
- Closing costs
- $8,370
- Reserves months
- —
- Total cash needed
- —
Loan-product check · same deal, 3 products live
Conventional
25% down · 7.5% · 30yr
- Down + closing
- —
- Monthly P&I
- —
- Monthly cashflow
- —
- DSCR
- —
- Eligible?
- —
Personal DTI + credit; lowest rate.
DSCR
20% down · 8.5% · 30yr
- Down + closing
- —
- Monthly P&I
- —
- Monthly cashflow
- —
- DSCR
- —
- Eligible?
- —
No personal income docs; deal must DSCR.
Hard money
10% down · 12.0% · 12mo
- Down + closing
- —
- Monthly P&I
- —
- Monthly cashflow
- —
- DSCR
- —
- Eligible?
- —
Short-term bridge; refi at stabilization.
HOA detail
- Monthly dues
- $100 · $1,200/yr
- Likely covers
- water
Listing history 26 events
-
2026-06-22days on market $279,000 Active 118 DOM
-
2026-06-21days on market $279,000 Active 117 DOM
-
2026-06-19days on market $279,000 Active 115 DOM
-
2026-06-18days on market $279,000 Active 114 DOM
-
2026-06-17days on market $279,000 Active 113 DOM
-
2026-06-16days on market $279,000 Active 112 DOM
-
2026-06-15days on market $279,000 Active 111 DOM
-
2026-06-14days on market $279,000 Active 109 DOM
-
2026-06-13price $279,000 Active 108 DOM
-
2026-06-12days on market $285,000 Active 108 DOM
-
2026-06-09days on market $285,000 Active 105 DOM
-
2026-06-08days on market $285,000 Active 104 DOM
-
2026-06-07days on market $285,000 Active 103 DOM
-
2026-06-07days on market $285,000 Active 102 DOM
-
2026-06-03days on market $285,000 Active 99 DOM
-
2026-06-02days on market $285,000 Active 98 DOM
-
2026-06-01days on market $285,000 Active 97 DOM
-
2026-05-31days on market $285,000 Active 96 DOM
-
2026-05-30days on market $285,000 Active 95 DOM
-
2026-02-24$285,000 Active 1249-char remark
Show marketing remark (1249 chars)
This immaculate 2 BR/2 Bath, 1338 SF town home located on a spacious corner lot in small-town Iowa awaits you! The front entrance opens to a beautiful foyer connecting you to the main living area; a spacious open concept living/dining/ kitchen area with vinyl plank flooring, beautiful woodwork, ceiling fans, Anderson windows, central air and accent lighting for your comfort and convenience. Appliances include a refrigerator, microwave, stove and dishwasher. The laundry area includes a large walk-in pantry and hidden crawl space for utilities below that include the furnace, sump pump, radon extraction hook-ups and an on-demand water heater. Beautiful oak finished cupboards in the kitchen will provide ample storage space. There are two bedrooms; both carpeted. The master bathroom features a ¾ bath with walk-in shower and large walk-in closet. The 2nd bedroom is located near the front hallway and is next to the main full bathroom. A nice outdoor entertainment area features a 16 X 16 vinyl composite deck that is virtually maintenance free! The 400 SF attached garage will provide protection for your vehicles and additional storage space. This nearly maintenance-free home located within blocks of uptown amenities can be yours!
-
2016-07-21soldstatus $165,000
-
2016-07-15soldstatus $165,000
-
2016-01-27historical
-
2015-01-27$165,000
-
2015-01-27$165,000
-
2015-01-27$165,000
ⓘ Source: listings_history table (triggers on properties + properties_extension) + one-shot
backfill from property_details.listing_events for pre-trigger history.
Tax reassessment forecast IA · Partial reset (capped growth)
- Current annual tax
- $3,888 · $324/mo
- Projected year-2 tax
- $4,134 · $345/mo
- Expected delta
- +$246/yr (+$21/mo · 6.3%)
ⓘ Screening estimate from a state-policy table — verify with the county assessor before closing.
Climate risk First Street
- Flood 1/10 Low FEMA zone X (unshaded) · 0% chance over 30 yrs
- Wildfire 3/10 Moderate
- Heat 3/10 Moderate 7 d/yr ≥105°F today · 15 d/yr by 30 yrs out
- Wind 2/10 Low
- Air quality 1/10 Low 0 unhealthy d/yr today · 0 by 30 yrs out
Nearby sold comps map
Loading sold comps map…
Walkable amenities ~0.75 mi
Loading nearby amenities…
Taxation est. · year 1
- Rental income
- $13,234
- − Mortgage interest
- −$15,628
- − Property taxes
- −$3,888
- − Insurance
- −$1,395
- − Repairs & maintenance
- −$1,059
- − Management
- −$1,059
- − HOA
- −$1,200
- − Depreciation
- −$8,116
- Taxable loss
- −$19,111
- Est. tax savings @ 24.0%
- +$4,587
- After-tax cash flow
- $-8,999/yr
For passive investors: Depreciation is non-cash, so a rental often shows a tax loss while cash-flowing — sheltering income. Rental losses are passive: they offset passive income freely, and up to $25,000/yr can offset ordinary (W-2) income if you actively participate and your MAGI is under $100k (phasing out to $0 by $150k); unused losses carry forward. On sale, claimed depreciation is recaptured at up to 25%, and gains may owe capital-gains tax (a 1031 exchange can defer both). Figures are a year-1 estimate at your 24.0% rate — not tax advice; consult a CPA.
Schools (NCES district)
- District
- Pcm Community School District
- NCES district ID
- 1999017
- Math proficiency
- 65% ▼ -6.00%
- Reading proficiency
- 75% ▲ 2.00%
- Median HH income
- $60,380
- Composite
- 60.32/100
- National rank
- #851
- State rank
- #124 of 289 in IA
Livability — Monroe
- Score
- 79/100
- State rank
- #118
- US rank
- #2215
Category grades
Schools grade is shown separately in the Schools card above.
Census & demographics
- Census place
- Monroe, IA
- Population (ZIP)
- 2,914
Population outlook (Jasper County) Hauer SSP2
- Today (2025)
- 36,216 people
- By 2030
- 35,730 · -1.3%
- By 2040
- 34,727 · -4.1%
- By 2050
- 33,802 · -6.7%
- By 2075
- 33,382 · -7.8%
- By 2100
- 32,761 · -9.5%
Race, ethnicity, and origin ACS 2023
- Neighborhood character
- Predominantly White (97%)
- Race & ethnicity
- White 97% Two or more races 1% Asian 1%
- Common ancestry
- Iranian 12% Italian 6% Romanian 3%
- Foreign-born
- 1%
- Languages at home
- 99% English-only · Spanish 1%
Political lean MEDSL · Jasper
- 2024 margin
- Strong R (+27.6) · D 35.4% · R 63.0% · Other 1.5%
- 2008→2024 swing
- -35.1pp toward R · 2008: 7.5pp · 2024: -27.6pp
- All cycles
- 2024: R+27.6 2020: R+21.5 2016: R+18.4 2012: D+7.1 2008: D+7.5
Not yet ingested
- Civics
- —
Market trends
- HPI YoY
- ▲ 9.30%
- Current HPI
- 266.6155
- Rent YoY
- —
- Metro
- —
- State GDP YoY
- ▲ 2.48%
- F500 in state
- 4
Industry mix (Fortune 500 HQ in IA)
| Industry | F500 HQs | Revenue |
|---|---|---|
| Financial Services | 1 | $16B |
|
||
| Retail / Convenience | 1 | $15B |
|
||
Price history
+72.7% since first listed7 events — show timeline
- 2026-02-24 Listed $285,000 DMMLS
- 2016-07-21 Sold (Public Records) $165,000 Public Records
- 2016-07-15 Sold (MLS) $165,000 DMMLS
- 2016-01-27 Listing Removed — NORTHSTARMLS as Distributed by MLS Grid
- 2015-01-27 Listed $165,000 NORTHSTARMLS as Distributed by MLS Grid
- 2015-01-27 Listed $165,000 DMMLS
- 2015-01-27 Listed $165,000 IAR
Property tax history
+86.9%/yrLatest (2025): $3,888 · -2.6% YoY. Source: county tax records.
Cash-flow waterfall
monthlySold comps — $/sqft
last 12 mo · ≤1 miLoading sold comps…