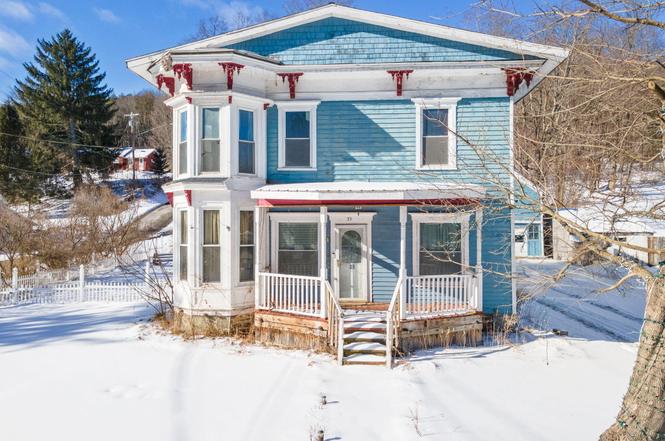
39 Water St · Worcester, NY
Flood risk 10/10 · Severe
- FEMA flood zone
- A
- Chance of flooding over 30 yrs
- 0.99%
- Est. flood insurance / yr
- $1,009 – $1,996
Fire risk 1/10 · Minimal
- Est. fire insurance / yr
- $691 – $1,283
Heat risk 2/10 · Minimal
- Hot days now (above 89°F)
- 8 days/yr
- Hot days in 30 yrs
- 19 days/yr
Wind risk 2/10 · Minimal
- Chance of severe wind over 30 yrs
- 2.0%
Air-quality risk 1/10 · Minimal
- Unhealthy air days now
- 0 days/yr
- Unhealthy air days in 30 yrs
- 0 days/yr
Risk factors via First Street. Map © Google.
Why this score? — see what drove the D+ grade
The composite is a weighted blend of 9 inputs, each scored 0–100. Each bar is that input's sub-score; the figure is the points it added to the 100-point composite (weight × sub-score).
- Cash flow +15.9/30.0
- Appreciation +5.9/10.0
- 1% rule +5.6/10.0
- DSCR +4.9/10.0
- ARV discount +4.9/15.0
- Schools +3.7/10.0
- Livability +3.0/5.0
- Rent growth +2.5/5.0
- Condition / age +2.5/5.0
$137,400
🖨 Deal sheet (PDF) 📄 Offer letter ✓ Due diligence
Listing remarks
Timeless Victorian elegance meets modern family fun. This sprawling 2,500-square-foot masterpiece sits proudly on a large corner lot, offering the kind of space and character rarely found today. From the sun-drenched living room and formal dining area to the massive country kitchen, every inch of this 6-bedroom home is designed for gathering. A rare first-floor bedroom with an ensuite bath offers convenience, while five additional bedrooms upstairs provide room for everyone. Outside, your private oasis awaits: choose between two breezy porches for your morning coffee, or head to the fenced-in backyard for a dip in the pool and s'mores by the firepit. All this, just a short stroll from Worce
Key facts
- Country kitchen
- First-floor bedroom
- Formal dining room
Tags
Neighborhood map
What this means for you Summary
Snapshot
- This is a 6-bed/2.5-bath single-family listed at $137k.
Deal economics
- At list price, monthly cash flow is $-59 ($-708/yr) — negative.
- To cash-flow at today's rent, offer at most $127k (7.6% below list).
- Meets the 1% rule at list price ($1k rent vs $137k).
- Recommended offer: $121k (12.0% below list) — sets the bar for market timing.
Location & tenants
- Location reads 59/100 on livability (#1,037 in NY) — a working-class tenant base; expect higher turnover. Strengths: housing A+, cost of living A; Watch: health & safety C-, schools D-, crime F.
- Worcester Central School District (rural): math 40% / reading 40% proficiency, ranked #642 of 755 in NY (top 85%) — families likely to look elsewhere, expect single-tenant / working-renter base with shorter leases.
- Market conditions: 24 active listings in the ZIP; 133 units permitted in Otsego County in 2024 (10 in 5+ unit buildings).
Forward outlook
- In year one you build about $4k of equity ($950 loan paydown + $3k appreciation (1.9% local appreciation)).
- Otsego County population projected at -21% by 2050 — secular population decline; favor cash flow + early exit over multi-decade hold.
- At projected returns (1.9% appreciation + 3.0% rent growth), your $38k cash investment doubles in ~9 years — after that, you're playing with house money.
- By year 9, paydown + projected appreciation supports a ~$31k cash-out refi (75% LTV) — recoverable capital for the next deal without selling this one.
Negotiation context
- It's been on market 185 days — a 12% lower offer ($121k) is reasonable based on typical stale-listing flexibility.
- 8 sale attempts since 5y ago with the ask held roughly flat each time — persistent listings suggest the price (not the market) is what's stuck; bring a comps-based counter.
Risks & watch-outs
- Watch-outs: property tax is 2.7% of price; flood insurance adds $125/mo; built in 1900 — expect roof / HVAC / electrical / plumbing capex.
- Climate carrying-cost: in FEMA flood zone A (mandatory federal flood insurance) — expect insurance premiums to compound above CPI over the hold.
Questions for the listing agent
- What do current leases actually rent for vs. the listed asking? Can we see a recent rent roll and the last 12 months of T-12 income?
- It's been on market 185 days. Have you received any prior offers? Is the seller open to a 12% concession, seller financing, or rate buy-down credit?
- Built in 1900 — when were the roof, HVAC, electrical panel, plumbing, and water heater last replaced?
- Property tax is high relative to price — has the assessment been appealed recently, and will the sale trigger a re-assessment?
- What's the actual annual flood-insurance premium (NFIP or private), and is the property in a SFHA with mandatory coverage?
- Why hasn't it sold? Are there any deal-killer items the seller is aware of (foundation, flood, title, zoning, code violations)?
- Is there a deadline driving the sale (1031 exchange, divorce, estate, relocation)? That informs how much negotiation room exists.
- Schools are D-rated, which usually means shorter tenancies and higher turnover. Who's the typical renter profile here, and what's been the actual vacancy rate?
- Crime grade is F in this area — have there been break-ins, vandalism, or insurance claims at this property in the last 3 years? What carrier currently insures it and at what premium?
- The area grade is low — what's the realistic commute time and amenity access for the typical tenant pool here? Any planned neighborhood developments (good or bad) we should know about?
- What's the average days-on-market for RENTAL listings here right now (not sales)? A rising rental-DOM trend means longer vacancies and softer asking-rent achievability than the comps imply.
- What's the recent tenant-quality profile in this submarket — average credit score on applications, eviction rate, late-payment / NSF rate, and stable-employment percentage? A property-management company in the area should have these aggregated.
- How much new for-sale + rental construction is in the pipeline within 1–3 miles? Heavy new supply typically softens prices + rents 12–24 months out; constrained supply supports both.
Investment metrics
- 1% rule
- 1.06% ✓
- Cap rate
- 6.87%
- Cash-on-cash
- 2.06%
- DSCR
- 1.09
- GRM
- 7.9
CMA / ARV
- ARV (on-the-fly)
- $130,000
- Comps found
- 1
Show comp detail 1 sale within ~0.75 mi
| Address | Dist | Beds/Ba | Sqft | Sold | Price | $/sf | Match |
|---|---|---|---|---|---|---|---|
| 39 Water St | 0.00mi | 6/2.5 | 2,500 (0%) | 1mo | $130,000 | $52 | 99 |
Match score weights: distance 35% · size 25% · config 20% · recency 20%. Top-matched comps best support the ARV.
Projected returns pro-forma
1.88% appreciation · 3.0% rent growth · sell at horizon
- IRR
- 2.4%
- Equity multiple
- 1.13×
- Total profit
- $5,007
- Equity at exit
- $53,306
- IRR
- 6.5%
- Equity multiple
- 1.88×
- Total profit
- $33,745
- Equity at exit
- $76,086
Cash invested: $38,472 (down + closing). Projections, not guarantees.
Landlord ↔ Tenant lean methodology
- Overall (STATE)
- 15 Strongly Tenant-Friendly
- State New York
- 15 Strongly Tenant-Friendly · D+10
- County
- — inherits STATE
- City
- — inherits STATE
ZIP-level market 12197
- Home prices YoY
- 0.6%
- Active inventory
- 24
- Price-to-rent
- 7.9×
Monthly cashflow live
- Estimated rent
- $1,456 medium interval (Pro) →
- Mortgage (P&I)
- −$721
- Tax from tax record
- −$306 /mo · $3,673/yr
- Insurance
- −$57
- Flood insurance flood zone
- −$125 /mo · $1,502/yr
- HOA
- −$0
- Vacancy / Maint / Mgmt
- −$306
- Net cashflow
- $-59
Break-even live
Sensitivity live
| Price | -10% $19 | -5% $-20 | +0% $-59 | +5% $-98 | +10% $-137 |
|---|---|---|---|---|---|
| Rent | -10% $-174 | -5% $-117 | +0% $-59 | +5% $-2 | +10% $56 |
| Rate | -1.0pp $10 | -0.5pp $-24 | base $-59 | +0.5pp $-95 | +1.0pp $-131 |
UW: 25.0% down · 7.5% · 30yr · 1.5% tax · 5.0% vac · 8.0% maint · 8.0% mgmt
Financing live
Cash to close
- Down payment
- $34,350
- Closing costs
- $4,122
- Reserves months
- —
- Total cash needed
- —
Loan-product check · same deal, 3 products live
Conventional
25% down · 7.5% · 30yr
- Down + closing
- —
- Monthly P&I
- —
- Monthly cashflow
- —
- DSCR
- —
- Eligible?
- —
Personal DTI + credit; lowest rate.
DSCR
20% down · 8.5% · 30yr
- Down + closing
- —
- Monthly P&I
- —
- Monthly cashflow
- —
- DSCR
- —
- Eligible?
- —
No personal income docs; deal must DSCR.
Hard money
10% down · 12.0% · 12mo
- Down + closing
- —
- Monthly P&I
- —
- Monthly cashflow
- —
- DSCR
- —
- Eligible?
- —
Short-term bridge; refi at stabilization.
Listing history 24 events
-
2026-03-17status Pending
-
2026-03-13status Active
-
2026-03-12historical
-
2026-02-06$137,400 Active
-
2025-11-11price $137,400
-
2025-09-13price $139,900
-
2025-09-12$144,900 Active
-
2025-09-05historical Contingent
-
2025-04-29status Pending
-
2025-04-29historical
-
2025-01-16$144,900 Active
-
2024-12-31historical
-
2024-10-16price $149,900
-
2024-08-24price $169,500
-
2024-07-16price $177,500
-
2024-05-22$179,500 Active
-
2022-01-27soldstatus $167,500
-
2022-01-18soldstatus $167,500
-
2022-01-18soldstatus $167,500
-
2022-01-12soldstatus $167,500
-
2021-05-18$179,900
-
2021-05-18$179,900
-
2021-05-18$179,900
-
1997-08-04soldstatus $58,400
ⓘ Source: listings_history table (triggers on properties + properties_extension) + one-shot
backfill from property_details.listing_events for pre-trigger history.
Tax reassessment forecast NY · Partial reset (capped growth)
- Current annual tax
- $3,673 · $306/mo
- Projected year-2 tax
- $3,673 · $306/mo
- Expected delta
- $0/yr ($0/mo · 0.0%)
ⓘ Screening estimate from a state-policy table — verify with the county assessor before closing.
Climate risk First Street
- Flood 10/10 Extreme FEMA zone A · 99% chance over 30 yrs
- Wildfire 1/10 Low
- Heat 2/10 Low 8 d/yr ≥89°F today · 19 d/yr by 30 yrs out
- Wind 2/10 Low 2% chance of damaging wind over 30 yrs
- Air quality 1/10 Low 0 unhealthy d/yr today · 0 by 30 yrs out
Nearby sold comps map
Loading sold comps map…
Walkable amenities ~0.75 mi
Loading nearby amenities…
Taxation est. · year 1
- Rental income
- $17,469
- − Mortgage interest
- −$7,697
- − Property taxes
- −$3,673
- − Insurance
- −$2,190
- − Repairs & maintenance
- −$1,398
- − Management
- −$1,398
- − Depreciation
- −$3,997
- Taxable loss
- −$2,882
- Est. tax savings @ 24.0%
- +$692
- After-tax cash flow
- $-17/yr
For passive investors: Depreciation is non-cash, so a rental often shows a tax loss while cash-flowing — sheltering income. Rental losses are passive: they offset passive income freely, and up to $25,000/yr can offset ordinary (W-2) income if you actively participate and your MAGI is under $100k (phasing out to $0 by $150k); unused losses carry forward. On sale, claimed depreciation is recaptured at up to 25%, and gains may owe capital-gains tax (a 1031 exchange can defer both). Figures are a year-1 estimate at your 24.0% rate — not tax advice; consult a CPA.
Schools (NCES district)
- District
- Worcester Central School District
- NCES district ID
- 3631740
- Math proficiency
- 40% ▼ -5.00%
- Reading proficiency
- 40% ▲ 5.00%
- Median HH income
- $45,846
- Composite
- 36.52/100
- National rank
- #9306
- State rank
- #642 of 755 in NY
Livability — Worcester
- Score
- 59/100
- State rank
- #1037
- US rank
- #20500
Category grades
Schools grade is shown separately in the Schools card above.
Census & demographics
- Census place
- Worcester, NY
- City population
- 2,275
- Population (ZIP)
- 2,275
Population outlook (Otsego County) Hauer SSP2
- Today (2025)
- 57,987 people
- By 2030
- 55,403 · -4.5%
- By 2040
- 50,336 · -13.2%
- By 2050
- 45,715 · -21.2%
- By 2075
- 38,769 · -33.1%
- By 2100
- 33,468 · -42.3%
Race, ethnicity, and origin ACS 2023
- Neighborhood character
- Predominantly White (83%)
- Race & ethnicity
- White 83% Hispanic / Latino 11% Two or more races 8%
- Hispanic origin (detail)
- Puerto Rican 3%
- Common ancestry
- Italian 4% Romanian 3% Slovak 2%
- Foreign-born
- 6% · Canada
- Languages at home
- 92% English-only · Spanish 7%
Political lean MEDSL · Otsego
- 2024 margin
- Lean R (+7.9) · D 46.1% · R 53.9%
- 2008→2024 swing
- -13.8pp toward R · 2008: 5.9pp · 2024: -7.9pp
- All cycles
- 2024: R+7.9 2020: R+5.0 2016: R+13.0 2012: D+2.0 2008: D+5.9
Not yet ingested
- Civics
- —
Market trends
- HPI YoY
- ▲ 1.88%
- Current HPI
- 341.3108
- Rent YoY
- —
- Metro
- —
- State GDP YoY
- ▲ 2.60%
- F500 in state
- 92
Industry mix (Fortune 500 HQ in NY)
| Industry | F500 HQs | Revenue |
|---|---|---|
| Financial Services | 10 | $950B |
|
||
| Consumer Goods | 9 | $162B |
|
||
| Insurance | 4 | $225B |
|
||
| Telecommunications | 2 | $144B |
|
||
| Pharmaceuticals | 2 | $112B |
|
||
| Media / Entertainment | 2 | $69B |
|
||
Price history
+135.3% since first listed24 events — show timeline
- 2026-03-17 Pending — Global MLS
- 2026-03-13 Relisted — Global MLS
- 2026-03-12 Listing Removed — Global MLS
- 2026-02-06 Listed $137,400 HVCRMLS
- 2025-11-11 Price Changed $137,400 Global MLS
- 2025-09-13 Price Changed $139,900 Global MLS
- 2025-09-12 Listed $144,900 Global MLS
- 2025-09-05 Contingent — Global MLS
- 2025-04-29 Pending — Global MLS
- 2025-04-29 Listing Removed — Global MLS
- 2025-01-16 Listed $144,900 Global MLS
- 2024-12-31 Listing Removed — UNYREIS
- 2024-10-16 Price Changed $149,900 UNYREIS
- 2024-08-24 Price Changed $169,500 UNYREIS
- 2024-07-16 Price Changed $177,500 UNYREIS
- 2024-05-22 Listed $179,500 UNYREIS
- 2022-01-27 Sold (Public Records) $167,500 Public Records
- 2022-01-18 Sold (MLS) $167,500 ODBOR
- 2022-01-18 Sold (MLS) $167,500 UNYREIS
- 2022-01-12 Sold (MLS) $167,500 Global MLS
- 2021-05-18 Listed $179,900 Global MLS
- 2021-05-18 Listed $179,900 ODBOR
- 2021-05-18 Listed $179,900 UNYREIS
- 1997-08-04 Sold (Public Records) $58,400 Public Records
Property tax history
+3.8%/yrLatest (2025): $3,673 · +1.3% YoY. Source: county tax records.
Cash-flow waterfall
monthlySold comps — $/sqft
last 12 mo · ≤1 miLoading sold comps…