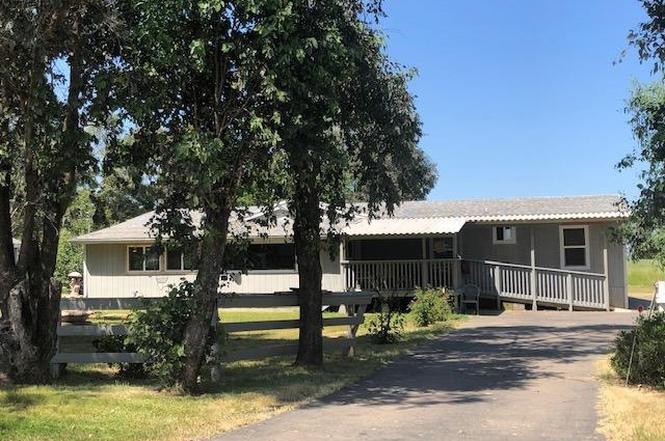
12234 Clay Station Rd · Clay, CA
Flood risk 1/10 · Minimal
- FEMA flood zone
- X (unshaded)
- Chance of flooding over 30 yrs
- 0.0%
- Est. flood insurance / yr
- $507 – $1,088
Fire risk 8/10 · Major
- Est. fire insurance / yr
- $659 – $1,223
Heat risk 8/10 · Major
- Hot days now (above 102°F)
- 7 days/yr
- Hot days in 30 yrs
- 15 days/yr
Wind risk 1/10 · Minimal
- Chance of severe wind over 30 yrs
- —
Air-quality risk 10/10 · Severe
- Unhealthy air days now
- 24 days/yr
- Unhealthy air days in 30 yrs
- 29 days/yr
Risk factors via First Street. Map © Google.
Why this score? — see what drove the D+ grade
The composite is a weighted blend of 9 inputs, each scored 0–100. Each bar is that input's sub-score; the figure is the points it added to the 100-point composite (weight × sub-score).
- Cash flow +16.1/30.0
- ARV discount +7.5/15.0
- Appreciation +5.7/10.0
- DSCR +5.0/10.0
- Schools +4.4/10.0
- 1% rule +3.4/10.0
- Rent growth +2.5/5.0
- Livability +2.5/5.0
- Condition / age +2.5/5.0
$595,000
🖨 Deal sheet (PDF) 📄 Offer letter ✓ Due diligence
Listing remarks
Look no further! Large open floor plan 3bed 2bath manufactured home with separate family and living room on 5 acres updated with newer int/ext paint, flooring and updated kitchen. A Must See!
Key facts
- 5 acre lot
- Built 1989
- Listed 85 days
Property features AI
Finance
- HOA & community: No homeowners association; Not a senior community
Exterior
- Parking: No garage
- Utilities: Well water; Septic system; Propane tank (leased); 220 volt electric
- Home design: Detached manufactured home; Single-story
- Construction: Shingle roof; Built in 1989
- Exterior features: Allows horses; Cross-fenced and fenced areas for horses; Shed(s) and storage structures; Regular-shaped lot (see remarks)
Interior
- Kitchen: Free standing gas range; Range hood
- Bedrooms: 3 bedrooms (all on the main level, including the master bedroom)
- Flooring: Laminate; Tile; Wood
- Bathrooms: 2 full bathrooms; Master bath with shower stall(s), double sinks and tub; Other baths with tub/shower over tub
- Heating & cooling: Central heating; Central air conditioning
- Interior features: Quartz and stone kitchen counters; Dining and family room combined; Living room with additional features
- Laundry & utility: Indoor laundry hookups only
Neighborhood map
What this means for you Summary
Snapshot
- This is a 3-bed/2.0-bath manufactured listed at $595k.
Deal economics
- At list price, monthly cash flow is $310 ($4k/yr) — positive.
- The deal already cash-flows at list — no discount required.
- To meet the 1% rule (rent ≥ 1% of price), the offer needs to be $500k (16.1% below list).
- Recommended offer: $500k (16.1% below list) — sets the bar for 1% rule.
Location & tenants
- Location reads 50/100 on livability (#1,124 in CA) — a working-class tenant base; expect higher turnover. Strengths: crime A+, employment A+, housing B; Watch: schools F, amenities F, commute F.
- Galt Joint Union High (town): math 75% / reading 25% proficiency, ranked #137 of 517 in CA (top 26%) — acceptable for families but not a draw, mixed tenant base, ~2y average lease.
- Market conditions: 14 active listings in the ZIP; 1 comparable units currently listed for rent nearby; 6,825 units permitted in Sacramento County in 2024 (1,752 in 5+ unit buildings).
Forward outlook
- In year one you build about $13k of equity ($4k loan paydown + $9k appreciation (1.5% local appreciation)).
- Sacramento County population projected at +17% by 2050 — long-run rental-demand tailwind backs the buy-and-hold thesis.
- At projected returns (1.5% appreciation + 3.0% rent growth), your $167k cash investment doubles in ~8 years — after that, you're playing with house money.
- By year 4, paydown + projected appreciation supports a ~$45k cash-out refi (75% LTV) — recoverable capital for the next deal without selling this one.
Negotiation context
- It's been on market 85 days — a 6% lower offer ($559k) is reasonable based on typical stale-listing flexibility.
- Current owner paid $269k; list at $595k implies a 121% gain — meaningful room to come down on a strong offer.
Risks & watch-outs
- Climate carrying-cost: severe wildfire risk; extreme-heat days projected 7→15/yr by 2055 (HVAC capex compounding) — expect insurance premiums to compound above CPI over the hold.
Questions for the listing agent
- It's been on market 85 days. Have you received any prior offers? Is the seller open to a 16% concession, seller financing, or rate buy-down credit?
- Why hasn't it sold? Are there any deal-killer items the seller is aware of (foundation, flood, title, zoning, code violations)?
- Is there a deadline driving the sale (1031 exchange, divorce, estate, relocation)? That informs how much negotiation room exists.
- Schools are F-rated, which usually means shorter tenancies and higher turnover. Who's the typical renter profile here, and what's been the actual vacancy rate?
- The area grade is low — what's the realistic commute time and amenity access for the typical tenant pool here? Any planned neighborhood developments (good or bad) we should know about?
- What's the average days-on-market for RENTAL listings here right now (not sales)? A rising rental-DOM trend means longer vacancies and softer asking-rent achievability than the comps imply.
- What's the recent tenant-quality profile in this submarket — average credit score on applications, eviction rate, late-payment / NSF rate, and stable-employment percentage? A property-management company in the area should have these aggregated.
- How much new for-sale + rental construction is in the pipeline within 1–3 miles? Heavy new supply typically softens prices + rents 12–24 months out; constrained supply supports both.
Investment metrics
- 1% rule
- 0.84% ✗
- Cap rate
- 6.92%
- Cash-on-cash
- 2.23%
- DSCR
- 1.10
- GRM
- 9.9
CMA / ARV
No comps found within radius.
Projected returns pro-forma
1.46% appreciation · 3.0% rent growth · sell at horizon
- IRR
- 5.1%
- Equity multiple
- 1.26×
- Total profit
- $44,061
- Equity at exit
- $217,400
- IRR
- 9.0%
- Equity multiple
- 2.15×
- Total profit
- $191,472
- Equity at exit
- $300,286
Cash invested: $166,600 (down + closing). Projections, not guarantees.
Landlord ↔ Tenant lean methodology
- Overall (STATE)
- 18 Strongly Tenant-Friendly
- State California
- 18 Strongly Tenant-Friendly · D+13
- County
- — inherits STATE
- City
- — inherits STATE
ZIP-level market 95638
- Home prices YoY
- 0.4%
- Active inventory
- 14
- Price-to-rent
- 9.9×
Monthly cashflow live
- Estimated rent
- $4,995 medium interval (Pro) →
- Mortgage (P&I)
- −$3,120
- Tax from tax record
- −$268 /mo · $3,217/yr
- Insurance
- −$248
- HOA
- −$0
- Vacancy / Maint / Mgmt
- −$1,049
- Net cashflow
- $310
Break-even live
Sensitivity live
| Price | -10% $647 | -5% $478 | +0% $310 | +5% $141 | +10% $-27 |
|---|---|---|---|---|---|
| Rent | -10% $-85 | -5% $112 | +0% $310 | +5% $507 | +10% $704 |
| Rate | -1.0pp $609 | -0.5pp $461 | base $310 | +0.5pp $156 | +1.0pp $-1 |
UW: 25.0% down · 7.5% · 30yr · 1.5% tax · 5.0% vac · 8.0% maint · 8.0% mgmt
Financing live
Cash to close
- Down payment
- $148,750
- Closing costs
- $17,850
- Reserves months
- —
- Total cash needed
- —
Loan-product check · same deal, 3 products live
Conventional
25% down · 7.5% · 30yr
- Down + closing
- —
- Monthly P&I
- —
- Monthly cashflow
- —
- DSCR
- —
- Eligible?
- —
Personal DTI + credit; lowest rate.
DSCR
20% down · 8.5% · 30yr
- Down + closing
- —
- Monthly P&I
- —
- Monthly cashflow
- —
- DSCR
- —
- Eligible?
- —
No personal income docs; deal must DSCR.
Hard money
10% down · 12.0% · 12mo
- Down + closing
- —
- Monthly P&I
- —
- Monthly cashflow
- —
- DSCR
- —
- Eligible?
- —
Short-term bridge; refi at stabilization.
Rent comps 1 comps
| Address | Beds | Baths | Sqft | Rent | $/sqft | DOM | Units | Dist |
|---|---|---|---|---|---|---|---|---|
| 12999 Borden Rd Herald, CA | 2.0 | 2.0 | 1607 | $4,995 | $3.11 | 2d | 1 | 1.49mi |
Listing history 4 events
-
2026-06-01days on market $595,000 Active 85 DOM
-
2026-05-31days on market $595,000 Active 84 DOM
-
2019-07-25soldstatus $269,000
-
1989-10-18soldstatus $10,000
ⓘ Source: listings_history table (triggers on properties + properties_extension) + one-shot
backfill from property_details.listing_events for pre-trigger history.
Tax reassessment forecast CA · Resets to sale price
- Current annual tax
- $3,217 · $268/mo
- Projected year-2 tax
- $4,522 · $377/mo
- Expected delta
- +$1,305/yr (+$109/mo · 40.6%)
ⓘ Screening estimate from a state-policy table — verify with the county assessor before closing.
Climate risk First Street
- Flood 1/10 Low FEMA zone X (unshaded) · 0% chance over 30 yrs
- Wildfire 8/10 Severe
- Heat 8/10 Severe 7 d/yr ≥102°F today · 15 d/yr by 30 yrs out
- Wind 1/10 Low
- Air quality 10/10 Extreme 24 unhealthy d/yr today · 29 by 30 yrs out
Nearby sold comps map
Loading sold comps map…
Walkable amenities ~0.75 mi
Loading nearby amenities…
Taxation est. · year 1
- Rental income
- $59,940
- − Mortgage interest
- −$33,329
- − Property taxes
- −$3,217
- − Insurance
- −$2,975
- − Repairs & maintenance
- −$4,795
- − Management
- −$4,795
- − Depreciation
- −$17,309
- Taxable loss
- −$6,481
- Est. tax savings @ 24.0%
- +$1,555
- After-tax cash flow
- $5,273/yr
For passive investors: Depreciation is non-cash, so a rental often shows a tax loss while cash-flowing — sheltering income. Rental losses are passive: they offset passive income freely, and up to $25,000/yr can offset ordinary (W-2) income if you actively participate and your MAGI is under $100k (phasing out to $0 by $150k); unused losses carry forward. On sale, claimed depreciation is recaptured at up to 25%, and gains may owe capital-gains tax (a 1031 exchange can defer both). Figures are a year-1 estimate at your 24.0% rate — not tax advice; consult a CPA.
Schools (NCES district)
- District
- Galt Joint Union High
- NCES district ID
- 0614820
- Math proficiency
- 75% ▲ 48.00%
- Reading proficiency
- 25% ▼ -32.00%
- Median HH income
- $62,916
- Composite
- 44.24/100
- National rank
- #2844
- State rank
- #137 of 517 in CA
Livability — Clay
- Score
- 50/100
- State rank
- #1124
- US rank
- #25638
Category grades
Schools grade is shown separately in the Schools card above.
Census & demographics
- Census place
- Clay, CA
- Population (ZIP)
- 2,295
Population outlook (Sacramento County) Hauer SSP2
- Today (2025)
- 1,660,763 people
- By 2030
- 1,732,990 · +4.3%
- By 2040
- 1,855,755 · +11.7%
- By 2050
- 1,941,335 · +16.9%
- By 2075
- 2,046,162 · +23.2%
- By 2100
- 1,961,444 · +18.1%
Race, ethnicity, and origin ACS 2023
- Neighborhood character
- Predominantly White (67%)
- Race & ethnicity
- White 67% Hispanic / Latino 21% Two or more races 9% Black 7% Asian 2%
- Hispanic origin (detail)
- Mexican 16%
- Common ancestry
- Russian 7% Portuguese 4% Lithuanian 2%
- Foreign-born
- 7% · Canada, Vietnam
- Languages at home
- 85% English-only · Spanish 13% Other Indo-European 1% Tagalog/Filipino 1%
Political lean MEDSL · Sacramento
- 2024 margin
- D (+19.7) · D 58.1% · R 38.4% · Other 3.5%
- 2008→2024 swing
- +0.7pp no change · 2008: 19.0pp · 2024: 19.7pp
- All cycles
- 2024: D+19.7 2020: D+25.3 2016: D+23.7 2012: D+16.3 2008: D+19.0
Not yet ingested
- Civics
- —
Market trends
- HPI YoY
- ▲ 1.46%
- Current HPI
- 356.2815
- Rent YoY
- —
- Metro
- —
- State GDP YoY
- ▲ 3.21%
- F500 in state
- 116
Industry mix (Fortune 500 HQ in CA)
| Industry | F500 HQs | Revenue |
|---|---|---|
| Technology | 27 | $1,492B |
|
||
| Financial Services | 3 | $174B |
|
||
| Retail | 3 | $44B |
|
||
| Insurance | 3 | $26B |
|
||
| Media / Entertainment | 2 | $115B |
|
||
| Pharmaceuticals / Biotech | 2 | $62B |
|
||
Price history
+2590.0% since first listed2 events — show timeline
- 2019-07-25 Sold (Public Records) $269,000 Public Records
- 1989-10-18 Sold (Public Records) $10,000 Public Records
Property tax history
+5.1%/yrLatest (2025): $3,217 · +1.9% YoY. Source: county tax records.
Cash-flow waterfall
monthlySold comps — $/sqft
last 12 mo · ≤1 miLoading sold comps…