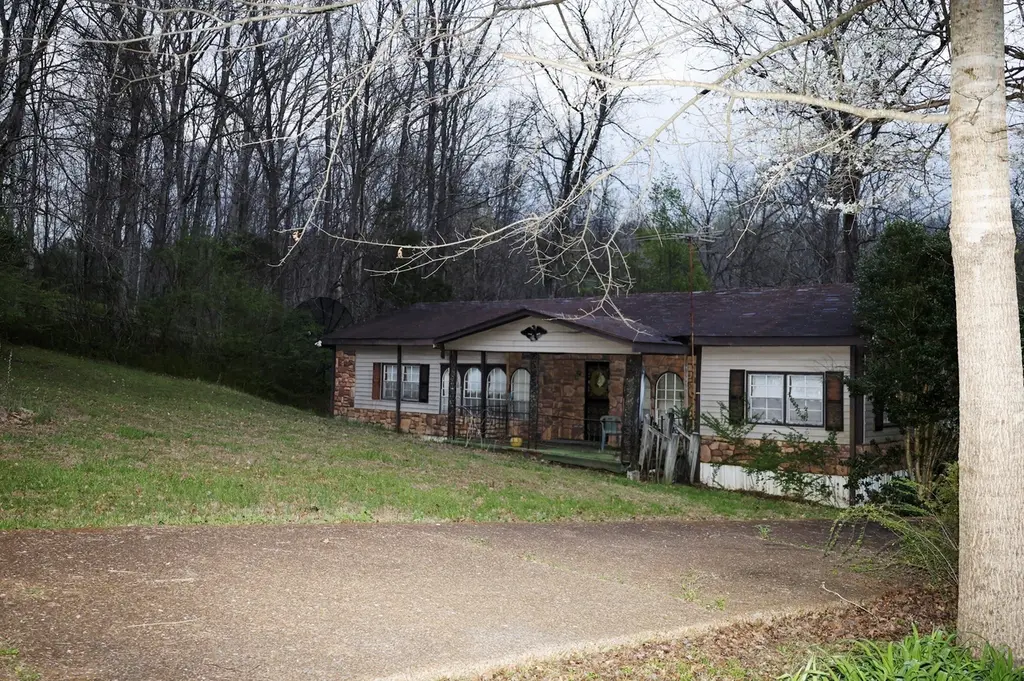
1040 Macon Wall Rd · Ashland City, TN
Flood risk 3/10 · Minor
- FEMA flood zone
- X (unshaded)
- Chance of flooding over 30 yrs
- 0.17%
- Est. flood insurance / yr
- $507 – $1,088
Fire risk 4/10 · Minor
- Est. fire insurance / yr
- $949 – $1,763
Heat risk 5/10 · Moderate
- Hot days now (above 109°F)
- 7 days/yr
- Hot days in 30 yrs
- 19 days/yr
Wind risk 4/10 · Minor
- Chance of severe wind over 30 yrs
- 10.0%
Air-quality risk 2/10 · Minimal
- Unhealthy air days now
- 0 days/yr
- Unhealthy air days in 30 yrs
- 1 days/yr
Risk factors via First Street. Map © Google.
Why this score? — see what drove the B- grade
The composite is a weighted blend of 9 inputs, each scored 0–100. Each bar is that input's sub-score; the figure is the points it added to the 100-point composite (weight × sub-score).
- Cash flow +30.0/30.0
- 1% rule +10.0/10.0
- DSCR +10.0/10.0
- ARV discount +7.5/15.0
- Livability +3.2/5.0
- Rent growth +3.0/5.0
- Condition / age +2.5/5.0
- Schools +2.3/10.0
- Appreciation +0.0/10.0
$125,000
🖨 Deal sheet (PDF) 📄 Offer letter ✓ Due diligence
Listing remarks
Excellent investment opportunity in growing Ashland City! Conveniently located with access to public utilities and just a short drive to Nashville. Ideal for investors, builders, or buyers looking for redevelopment potential. Property being sold as-is. Don’t miss this opportunity in a rapidly developing area.
Key facts
- Nashville area
- 0.8 acre lot
- Built 1999
Tags
Property features AI
Exterior
- Utilities: Public water; Public sewer; Water available
- Home design: Manufactured on land; One story
- Construction: Built existing (year recorded by assessor); Other construction materials
- Exterior features: Patio; Covered patio; Covered porch; Back yard fencing
Interior
- Kitchen: Double oven
- Bedrooms: 3 bedrooms (all on the main level)
- Flooring: Carpet
- Bathrooms: 2 full bathrooms
- Heating & cooling: Central heating; Central air conditioning
- Interior features: Double oven; Carpet flooring; Crawl space basement
Neighborhood map
What this means for you Summary
Snapshot
- This is a 3-bed/3.0-bath manufactured listed at $125k.
Deal economics
- At list price, monthly cash flow is $681 ($8k/yr) — positive.
- The deal already cash-flows at list — no discount required.
- Meets the 1% rule at list price ($2k rent vs $125k).
- Recommended offer: $121k (3.0% below list) — sets the bar for market timing.
- Cap rate 12.8% vs local median 3.5% in Ashland City — top-decile yield for the area; either an underpriced asset or a hidden risk that comps aren't pricing in. Stress-test before assuming the spread holds.
Location & tenants
- Location reads 65/100 on livability (#138 in TN) — a middle-class / working-renter tenant base. Strengths: crime A+, cost of living A+, housing A+; Watch: amenities F, commute F, health & safety F.
- Cheatham County (rural): math 24% / reading 28% proficiency, ranked #74 of 139 in TN (top 53%) — low school quality limits family demand, transient renter base, plan for 1-2y turnover.
- Zoned schools: East Cheatham Elementary (math 32% / reading 27%, grade F, #423 of 952 statewide, top 48%, 393 students, 0% FRL); Cheatham Co Central (math 2% / reading 32%, grade F, #215 of 332 statewide, top 67%, 581 students, 0% FRL) — zoned schools average 0% FRL vs 40% district-wide (40 pts lower); this property's tenant base skews higher-income than the district average.
- Market conditions: Rents rising (+2.1%/yr); 167 active listings in the ZIP; solid renter incomes; 271 units permitted in Cheatham County in 2024 (0 in 5+ unit buildings).
Forward outlook
- Local home prices are declining (-3.0%/yr); year-one equity from $864 of loan paydown is wiped out by about $4k of value loss. Plan a longer hold.
- At projected returns (-3.0% appreciation + 2.1% rent growth), your $35k cash investment doubles in ~6 years — after that, you're playing with house money.
Negotiation context
- It's been on market 35 days — a 3% lower offer ($121k) is reasonable based on typical stale-listing flexibility.
- 3 sale attempts; this cycle's ask has dropped $45k (26%) from the opening price — seller is motivated, your offer sets the floor, not the list.
Risks & watch-outs
- Climate carrying-cost: extreme-heat days projected 7→19/yr by 2055 (HVAC capex compounding) — expect insurance premiums to compound above CPI over the hold.
Questions for the listing agent
- It's been on market 35 days. Have you received any prior offers? Is the seller open to a 3% concession, seller financing, or rate buy-down credit?
- Is there a deadline driving the sale (1031 exchange, divorce, estate, relocation)? That informs how much negotiation room exists.
- Schools are F-rated, which usually means shorter tenancies and higher turnover. Who's the typical renter profile here, and what's been the actual vacancy rate?
- What's the average days-on-market for RENTAL listings here right now (not sales)? A rising rental-DOM trend means longer vacancies and softer asking-rent achievability than the comps imply.
- What's the recent tenant-quality profile in this submarket — average credit score on applications, eviction rate, late-payment / NSF rate, and stable-employment percentage? A property-management company in the area should have these aggregated.
- How much new for-sale + rental construction is in the pipeline within 1–3 miles? Heavy new supply typically softens prices + rents 12–24 months out; constrained supply supports both.
Investment metrics
- 1% rule
- 1.51% ✓
- Cap rate
- 12.83%
- Cash-on-cash
- 23.36%
- DSCR
- 2.04
- GRM
- 5.5
CMA / ARV
- ARV (median comp)
- $265,000
- List price
- $125,000
- Delta
- -52.83%
- Verdict
- UNDERPRICED
- Comps
- 1 within 2.0 mi
Projected returns pro-forma
-3.0% appreciation · 2.13% rent growth · sell at horizon
- IRR
- 15.5%
- Equity multiple
- 1.61×
- Total profit
- $21,503
- Equity at exit
- $18,638
- IRR
- 23.5%
- Equity multiple
- 2.94×
- Total profit
- $67,986
- Equity at exit
- $10,808
Cash invested: $35,000 (down + closing). Projections, not guarantees.
Landlord ↔ Tenant lean methodology
- Overall (STATE)
- 87 Strongly Landlord-Friendly
- State Tennessee
- 87 Strongly Landlord-Friendly · R+13
- County
- — inherits STATE
- City
- — inherits STATE
ZIP-level market 37015
- Home prices YoY
- -21.7%
- Rents YoY
- 2.1%
- Active inventory
- 167
- Price-to-rent
- 5.5×
Monthly cashflow live
- Estimated rent
- $1,887 medium interval (Pro) →
- Mortgage (P&I)
- −$656
- Tax from tax record
- −$102 /mo · $1,219/yr
- Insurance
- −$52
- HOA
- −$0
- Vacancy / Maint / Mgmt
- −$396
- Net cashflow
- $681
Break-even live
Sensitivity live
| Price | -10% $752 | -5% $717 | +0% $681 | +5% $646 | +10% $611 |
|---|---|---|---|---|---|
| Rent | -10% $532 | -5% $607 | +0% $681 | +5% $756 | +10% $830 |
| Rate | -1.0pp $744 | -0.5pp $713 | base $681 | +0.5pp $649 | +1.0pp $616 |
UW: 25.0% down · 7.5% · 30yr · 1.5% tax · 5.0% vac · 8.0% maint · 8.0% mgmt
Financing live
Cash to close
- Down payment
- $31,250
- Closing costs
- $3,750
- Reserves months
- —
- Total cash needed
- —
Loan-product check · same deal, 3 products live
Conventional
25% down · 7.5% · 30yr
- Down + closing
- —
- Monthly P&I
- —
- Monthly cashflow
- —
- DSCR
- —
- Eligible?
- —
Personal DTI + credit; lowest rate.
DSCR
20% down · 8.5% · 30yr
- Down + closing
- —
- Monthly P&I
- —
- Monthly cashflow
- —
- DSCR
- —
- Eligible?
- —
No personal income docs; deal must DSCR.
Hard money
10% down · 12.0% · 12mo
- Down + closing
- —
- Monthly P&I
- —
- Monthly cashflow
- —
- DSCR
- —
- Eligible?
- —
Short-term bridge; refi at stabilization.
Listing history 13 events
-
2026-06-13statusdays on market $125,000 Pending 35 DOM
-
2026-06-09days on market $125,000 Active 33 DOM
-
2026-06-08days on market $125,000 Active 32 DOM
-
2026-06-07pricedays on market $125,000 Active 31 DOM
-
2026-06-03days on market $170,000 Active 27 DOM
-
2026-06-02days on market $170,000 Active 26 DOM
-
2026-06-01days on market $170,000 Active 25 DOM
-
2026-05-31days on market $170,000 Active 24 DOM
-
2026-05-08$170,000 Active 316-char remark
-
2026-05-06historical
-
2026-05-06historical
-
2026-03-30$450,000 Active
-
2026-03-30$450,000 Active
ⓘ Source: listings_history table (triggers on properties + properties_extension) + one-shot
backfill from property_details.listing_events for pre-trigger history.
Tax reassessment forecast TN · Resets to sale price
- Current annual tax
- $1,219 · $102/mo
- Projected year-2 tax
- $1,219 · $102/mo
- Expected delta
- $0/yr ($0/mo · 0.0%)
ⓘ Screening estimate from a state-policy table — verify with the county assessor before closing.
Climate risk First Street
- Flood 3/10 Moderate FEMA zone X (unshaded) · 17% chance over 30 yrs
- Wildfire 4/10 Moderate
- Heat 5/10 Major 7 d/yr ≥109°F today · 19 d/yr by 30 yrs out
- Wind 4/10 Moderate 10% chance of damaging wind over 30 yrs
- Air quality 2/10 Low 0 unhealthy d/yr today · 1 by 30 yrs out
Nearby sold comps map
Loading sold comps map…
Walkable amenities ~0.75 mi
Loading nearby amenities…
Taxation est. · year 1
- Rental income
- $22,642
- − Mortgage interest
- −$7,002
- − Property taxes
- −$1,219
- − Insurance
- −$625
- − Repairs & maintenance
- −$1,811
- − Management
- −$1,811
- − Depreciation
- −$3,636
- Taxable income
- $6,537
- Est. tax owed @ 24.0%
- −$1,569
- After-tax cash flow
- $6,608/yr
For passive investors: Depreciation is non-cash, so a rental often shows a tax loss while cash-flowing — sheltering income. Rental losses are passive: they offset passive income freely, and up to $25,000/yr can offset ordinary (W-2) income if you actively participate and your MAGI is under $100k (phasing out to $0 by $150k); unused losses carry forward. On sale, claimed depreciation is recaptured at up to 25%, and gains may owe capital-gains tax (a 1031 exchange can defer both). Figures are a year-1 estimate at your 24.0% rate — not tax advice; consult a CPA.
Schools (NCES district)
- District
- Cheatham County
- NCES district ID
- 4700570
- Math proficiency
- 24% ▼ -15.00%
- Reading proficiency
- 28% ▼ -4.00%
- Median HH income
- $53,027
- Composite
- 23.17/100
- National rank
- #7949
- State rank
- #74 of 139 in TN
Livability — Ashland City
- Score
- 65/100
- State rank
- #138
- US rank
- #12483
Category grades
Schools grade is shown separately in the Schools card above.
Census & demographics
- County
- Cheatham County · 18,988 people
- City population
- 18,988
- Metro
- Nashville-Davidson--Murfreesboro--Franklin, TN
- Population (ZIP)
- 18,988
- Household income
- $79,092
- Rent vs Own
- Severe rent burden
- 396.0
Population outlook (Cheatham County) Hauer SSP2
- Today (2025)
- 41,312 people
- By 2030
- 41,739 · +1.0%
- By 2040
- 41,726 · +1.0%
- By 2050
- 40,413 · -2.2%
- By 2075
- 37,125 · -10.1%
- By 2100
- 31,619 · -23.5%
Race, ethnicity, and origin ACS 2023
- Neighborhood character
- Predominantly White (89%)
- Race & ethnicity
- White 89% Hispanic / Latino 6% Two or more races 4% Black 2%
- Hispanic origin (detail)
- Mexican 5%
- Common ancestry
- Slovak 3% Serbian 2% Italian 2%
- Foreign-born
- 3% · Canada
- Languages at home
- 95% English-only · Spanish 4%
Political lean MEDSL · Cheatham
- 2024 margin
- Solid R (+45.9) · D 26.3% · R 72.3% · Other 1.4%
- 2008→2024 swing
- -14.2pp toward R · 2008: -31.7pp · 2024: -45.9pp
- All cycles
- 2024: R+45.9 2020: R+44.0 2016: R+46.9 2012: R+37.0 2008: R+31.7
Not yet ingested
- Civics
- —
Market trends
- HPI YoY
- ▼ -87.06%
- Current HPI
- 313.8358
- Rent YoY
- ▲ 2.13%
- Metro
- Nashville-Davidson--Murfreesboro--Franklin, TN
- State GDP YoY
- ▲ 2.78%
- F500 in state
- 22
Industry mix (Fortune 500 HQ in TN)
| Industry | F500 HQs | Revenue |
|---|---|---|
| Healthcare | 3 | $91B |
|
||
| Retail | 3 | $72B |
|
||
| Transportation / Logistics | 1 | $88B |
|
||
| Paper / Packaging | 1 | $19B |
|
||
| Insurance | 1 | $13B |
|
||
| Energy | 1 | $12B |
|
||
Price history
-72.2% since first listed7 events — show timeline
- 2026-06-11 Pending — REALTRACS as Distributed by MLS Grid
- 2026-06-04 Price Changed $125,000 REALTRACS as Distributed by MLS Grid
- 2026-05-08 Listed $170,000 REALTRACS as Distributed by MLS Grid
- 2026-05-06 Listing Removed — REALTRACS as Distributed by MLS Grid
- 2026-05-06 Listing Removed — REALTRACS as Distributed by MLS Grid
- 2026-03-30 Listed $450,000 REALTRACS as Distributed by MLS Grid
- 2026-03-30 Listed $450,000 REALTRACS as Distributed by MLS Grid
Property tax history
+3.8%/yrLatest (2025): $1,219 · +11.4% YoY. Source: county tax records.
Cash-flow waterfall
monthlySold comps — $/sqft
last 12 mo · ≤1 miLoading sold comps…