 🌊 Lakefront
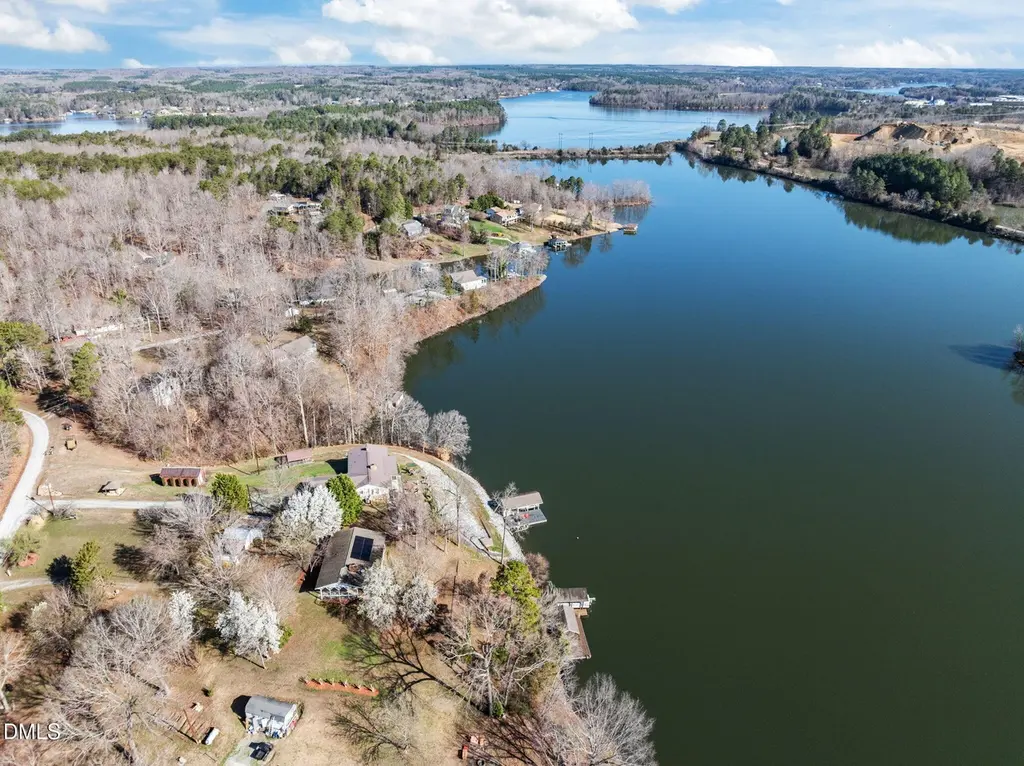
154 Spinnaker Ln · Roxboro, NC
Flood risk 1/10 · Minimal
- FEMA flood zone
- X (unshaded)
- Chance of flooding over 30 yrs
- 0.0%
- Est. flood insurance / yr
- $473 – $860
Fire risk 3/10 · Minor
- Est. fire insurance / yr
- $906 – $1,684
Heat risk 6/10 · Moderate
- Hot days now (above 104°F)
- 7 days/yr
- Hot days in 30 yrs
- 17 days/yr
Wind risk 6/10 · Moderate
- Chance of severe wind over 30 yrs
- 27.0%
Air-quality risk 2/10 · Minimal
- Unhealthy air days now
- 1 days/yr
- Unhealthy air days in 30 yrs
- 2 days/yr
Risk factors via First Street. Map © Google.
Why this score? — see what drove the F grade
The composite is a weighted blend of 9 inputs, each scored 0–100. Each bar is that input's sub-score; the figure is the points it added to the 100-point composite (weight × sub-score).
- ARV discount +15.0/15.0
- Appreciation +6.3/10.0
- Schools +3.4/10.0
- Livability +2.8/5.0
- Rent growth +2.5/5.0
- Condition / age +2.5/5.0
- Cash flow +0.4/30.0
- 1% rule +0.0/10.0
- DSCR +0.0/10.0
$575,000
🖨 Deal sheet 📄 Offer letter ✓ Due diligence
Listing remarks
154 Spinnaker feels like the lake house you grew up visiting as a kid . .. the one where everyone gathered, laughter carried across the water, and summer days somehow felt endless. Coffee on the dock in the morning. Wet towels draped over chairs after long afternoons on the lake. Card games around the table. Cousins piled into sleeping bags downstairs after sunburned days on the water. The kind of place where memories were made in the simple moments. And maybe that is exactly what makes this home special. Not every lake house is meant to feel brand new. Some are meant to feel familiar, comfortable, and timeless. Fully furnished and ready to enjoy now, this Hyco Lake retreat offers wide-open
Key facts
- Lake view
- Finished basement
- Solar panels
Tags
Property features AI
Finance
- HOA & community: No association
Exterior
- Parking: Attached carport providing 2 covered spaces; 2 additional open parking spaces (4 total)
- Utilities: Well water; Septic tank
- Home design: House with dock; Two levels
- Construction: Brick and wood siding exterior; Shingle roof; Permanent foundation; Built as a house (structure type: house/dock)
- Exterior features: Lakefront/waterfront on Hyco Lake; Boat house; Shed(s); Additional storage
Interior
- Kitchen: Eat-in kitchen
- Bedrooms: 3 bedrooms (all on the main level)
- Flooring: Carpet; Luxury vinyl; Vinyl
- Bathrooms: 2 full bathrooms
- Heating & cooling: Heating: Electric, Heat Pump, Propane (see remarks); Central air (electric)
- Interior features: Bathtub/Shower combination; Separate shower; Walk-in shower; Beamed ceilings; Bookcases; Ceiling fans; Eat-in kitchen; Storage
- Laundry & utility: Basement with storage and finished/heated space (exterior and interior entry, walk-up/walk-out access)
Neighborhood map
What this means for you Summary
Snapshot
- This is a 3-bed/2.0-bath single-family listed at $575k.
Deal economics
- At list price, monthly cash flow is $-3k ($-30k/yr) — negative.
- To cash-flow at today's rent, offer at most $128k (77.8% below list).
- To meet the 1% rule (rent ≥ 1% of price), the offer needs to be $133k (76.9% below list).
- Recommended offer: $128k (77.8% below list) — sets the bar for cash-flow.
- Cap rate 1.0% vs local median 4.5% in Roxboro — below-typical yield; the buyer is paying a premium for something (appreciation thesis, condition, location) that the cap rate doesn't capture.
Location & tenants
- Location reads 55/100 on livability (#649 in NC) — a working-class tenant base; expect higher turnover. Strengths: cost of living A+; Watch: crime F, amenities F, commute F.
- Person County Schools (rural): math 39% / reading 42% proficiency, ranked #110 of 178 in NC (top 62%) — families likely to look elsewhere, expect single-tenant / working-renter base with shorter leases.
- Zoned schools: Person High (math 45% / reading 44%, grade F, #352 of 535 statewide, top 68%, 1,079 students, 60% FRL).
- Market conditions: 42 active listings in the ZIP; 113 units permitted in Person County in 2024 (0 in 5+ unit buildings).
Forward outlook
- In year one you build about $18k of equity ($4k loan paydown + $14k appreciation (2.5% local appreciation)).
- Person County population projected at -15% by 2050 — secular population decline; favor cash flow + early exit over multi-decade hold.
- By year 3, paydown + projected appreciation supports a ~$46k cash-out refi (75% LTV) — recoverable capital for the next deal without selling this one.
Negotiation context
- It's been on market 98 days — a 9% lower offer ($523k) is reasonable based on typical stale-listing flexibility.
- Current owner paid $495k; 16% above their basis — modest negotiation headroom, anchor on the comps not their cost.
Risks & watch-outs
- Climate carrying-cost: major wind risk, 27% chance of damaging wind over 30y; extreme-heat days projected 7→17/yr by 2055 (HVAC capex compounding) — expect insurance premiums to compound above CPI over the hold.
Questions for the listing agent
- What do current leases actually rent for vs. the listed asking? Can we see a recent rent roll and the last 12 months of T-12 income?
- It's been on market 98 days. Have you received any prior offers? Is the seller open to a 78% concession, seller financing, or rate buy-down credit?
- Built in 1975 — when were the roof, HVAC, electrical panel, plumbing, and water heater last replaced?
- Why hasn't it sold? Are there any deal-killer items the seller is aware of (foundation, flood, title, zoning, code violations)?
- Is there a deadline driving the sale (1031 exchange, divorce, estate, relocation)? That informs how much negotiation room exists.
- Schools are D-rated, which usually means shorter tenancies and higher turnover. Who's the typical renter profile here, and what's been the actual vacancy rate?
- Crime grade is F in this area — have there been break-ins, vandalism, or insurance claims at this property in the last 3 years? What carrier currently insures it and at what premium?
- The area grade is low — what's the realistic commute time and amenity access for the typical tenant pool here? Any planned neighborhood developments (good or bad) we should know about?
- This sits on a lake — are riparian / water-frontage rights deeded with the parcel? Any dock permits, shoreline easements, or HOA water-use restrictions?
- What's the documented flood / surge / shoreline-erosion history here (FEMA AND non-FEMA — e.g., storm surge, creek backup, septic-field saturation)?
- Any water-quality or seasonal algae-bloom issues that affect tenant satisfaction or short-term-rental demand?
- What's the average days-on-market for RENTAL listings here right now (not sales)? A rising rental-DOM trend means longer vacancies and softer asking-rent achievability than the comps imply.
- What's the recent tenant-quality profile in this submarket — average credit score on applications, eviction rate, late-payment / NSF rate, and stable-employment percentage? A property-management company in the area should have these aggregated.
- How much new for-sale + rental construction is in the pipeline within 1–3 miles? Heavy new supply typically softens prices + rents 12–24 months out; constrained supply supports both.
Investment metrics
- 1% rule
- 0.23% ✗
- Cap rate
- 1.01%
- Cash-on-cash
- -18.87%
- DSCR
- 0.16
- GRM
- 36.1
CMA / ARV
- ARV (on-the-fly)
- $748,440
- Comps found
- 2
Show comp detail 2 sales within ~0.75 mi
| Address | Dist | Beds/Ba | Sqft | Sold | Price | $/sf | Match |
|---|---|---|---|---|---|---|---|
| 47 Cottonwood Trl | 0.70mi | 3/3.0 | 2,240 (-11%) | 10mo | $665,000 | $297 | 36 |
| 138 Beech Dr | 0.69mi | 3/3.0 | 2,204 (-12%) | 16mo | $400,000 | $181 | 29 |
Match score weights: distance 35% · size 25% · config 20% · recency 20%. Top-matched comps best support the ARV.
Projected returns pro-forma
2.51% appreciation · 3.0% rent growth · sell at horizon
- IRR
- -11.9%
- Equity multiple
- 0.34×
- Total profit
- $-107,052
- Equity at exit
- $242,738
- IRR
- -5.7%
- Equity multiple
- 0.15×
- Total profit
- $-136,489
- Equity at exit
- $362,234
Cash invested: $161,000 (down + closing). Projections, not guarantees.
Landlord ↔ Tenant lean methodology
- Overall (STATE)
- 85 Strongly Landlord-Friendly
- State North Carolina
- 85 Strongly Landlord-Friendly · R+3
- County
- — inherits STATE
- City
- — inherits STATE
ZIP-level market 27343
- Home prices YoY
- 0.7%
- Active inventory
- 42
- Price-to-rent
- 36.1×
Monthly cashflow live
- Estimated rent
- $1,326 medium interval (Pro) →
- Mortgage (P&I)
- −$3,015
- Tax from tax record
- −$324 /mo · $3,892/yr
- Insurance
- −$240
- HOA
- −$0
- Vacancy / Maint / Mgmt
- −$278
- Net cashflow
- $-2,532
Break-even live
UW: 25.0% down · 7.5% · 30yr · 1.5% tax · 5.0% vac · 8.0% maint · 8.0% mgmt
Financing live
Cash to close
- Down payment
- $143,750
- Closing costs
- $17,250
- Reserves months
- —
- Total cash needed
- —
Loan-product check · same deal, 3 products live
Conventional
25% down · 7.5% · 30yr
- Down + closing
- —
- Monthly P&I
- —
- Monthly cashflow
- —
- DSCR
- —
- Eligible?
- —
Personal DTI + credit; lowest rate.
DSCR
20% down · 8.5% · 30yr
- Down + closing
- —
- Monthly P&I
- —
- Monthly cashflow
- —
- DSCR
- —
- Eligible?
- —
No personal income docs; deal must DSCR.
Hard money
10% down · 12.0% · 12mo
- Down + closing
- —
- Monthly P&I
- —
- Monthly cashflow
- —
- DSCR
- —
- Eligible?
- —
Short-term bridge; refi at stabilization.
Listing history 22 events
-
2026-06-18days on market $575,000 Active 98 DOM
-
2026-06-17days on market $575,000 Active 97 DOM
-
2026-06-16days on market $575,000 Active 96 DOM
-
2026-06-15days on market $575,000 Active 95 DOM
-
2026-06-13days on market $575,000 Active 93 DOM
-
2026-06-12days on market $575,000 Active 92 DOM
-
2026-06-09days on market $575,000 Active 89 DOM
-
2026-06-08days on market $575,000 Active 88 DOM
-
2026-06-07days on market $575,000 Active 87 DOM
-
2026-06-05days on market $575,000 Active 85 DOM
-
2026-06-04days on market $575,000 Active 83 DOM
-
2026-06-02days on market $575,000 Active 82 DOM
-
2026-06-01days on market $575,000 Active 81 DOM
-
2026-05-31days on market $575,000 Active 80 DOM
-
2026-05-18price $575,000
-
2026-04-29price $589,000
-
2026-04-11price $599,000
-
2026-03-29price $610,000
-
2026-03-22price $625,000
-
2026-03-12$629,000 Active
-
2024-04-26soldstatus $495,000
-
1996-06-07soldstatus $160,000
ⓘ Source: listings_history table (triggers on properties + properties_extension) + one-shot
backfill from property_details.listing_events for pre-trigger history.
Tax reassessment forecast NC · Resets to sale price
- Current annual tax
- $3,892 · $324/mo
- Projected year-2 tax
- $4,715 · $393/mo
- Expected delta
- +$823/yr (+$69/mo · 21.2%)
ⓘ Screening estimate from a state-policy table — verify with the county assessor before closing.
Climate risk First Street
- Flood 1/10 Low FEMA zone X (unshaded) · 0% chance over 30 yrs
- Wildfire 3/10 Moderate
- Heat 6/10 Major 7 d/yr ≥104°F today · 17 d/yr by 30 yrs out
- Wind 6/10 Major 27% chance of damaging wind over 30 yrs
- Air quality 2/10 Low 1 unhealthy d/yr today · 2 by 30 yrs out
Nearby sold comps map
Loading sold comps map…
Walkable amenities ~0.75 mi
Loading nearby amenities…
Taxation est. · year 1
- Rental income
- $15,914
- − Mortgage interest
- −$32,209
- − Property taxes
- −$3,892
- − Insurance
- −$2,875
- − Repairs & maintenance
- −$1,273
- − Management
- −$1,273
- − Depreciation
- −$16,727
- Taxable loss
- −$42,335
- Est. tax savings @ 24.0%
- +$10,160
- After-tax cash flow
- $-20,219/yr
For passive investors: Depreciation is non-cash, so a rental often shows a tax loss while cash-flowing — sheltering income. Rental losses are passive: they offset passive income freely, and up to $25,000/yr can offset ordinary (W-2) income if you actively participate and your MAGI is under $100k (phasing out to $0 by $150k); unused losses carry forward. On sale, claimed depreciation is recaptured at up to 25%, and gains may owe capital-gains tax (a 1031 exchange can defer both). Figures are a year-1 estimate at your 24.0% rate — not tax advice; consult a CPA.
Schools (NCES district)
- District
- Person County Schools
- NCES district ID
- 3703630
- Math proficiency
- 39% ▬ 0.00%
- Reading proficiency
- 42% ▲ 2.00%
- Median HH income
- $43,729
- Composite
- 34.3/100
- National rank
- #5242
- State rank
- #110 of 178 in NC
Livability — Roxboro
- Score
- 55/100
- State rank
- #649
- US rank
- #23536
Category grades
Schools grade is shown separately in the Schools card above.
Census & demographics
- City population
- 11,954
- Population (ZIP)
- 1,606
Population outlook (Person County) Hauer SSP2
- Today (2025)
- 38,577 people
- By 2030
- 37,847 · -1.9%
- By 2040
- 35,740 · -7.4%
- By 2050
- 32,683 · -15.3%
- By 2075
- 24,979 · -35.2%
- By 2100
- 15,779 · -59.1%
Race, ethnicity, and origin ACS 2023
- Neighborhood character
- Diverse neighborhood (Simpson 0.56)
- Race & ethnicity
- White 58% Black 29% Hispanic / Latino 10% Two or more races 2%
- Hispanic origin (detail)
- Mexican 8%
- Common ancestry
- Slovak 5% Lithuanian 3% Romanian 2%
- Foreign-born
- 5% · Canada
- Languages at home
- 90% English-only · Spanish 10%
Political lean MEDSL · Person
- 2024 margin
- Strong R (+23.7) · D 37.7% · R 61.4%
- 2008→2024 swing
- -15.2pp toward R · 2008: -8.5pp · 2024: -23.7pp
- All cycles
- 2024: R+23.7 2020: R+21.6 2016: R+17.3 2012: R+11.0 2008: R+8.5
Not yet ingested
- Civics
- —
Market trends
- HPI YoY
- ▲ 2.51%
- Current HPI
- 358.3065
- Rent YoY
- —
- Metro
- —
- State GDP YoY
- ▲ 3.28%
- F500 in state
- 26
Industry mix (Fortune 500 HQ in NC)
| Industry | F500 HQs | Revenue |
|---|---|---|
| Financial Services | 2 | $213B |
|
||
| Retail | 2 | $95B |
|
||
| Industrial Conglomerate | 1 | $38B |
|
||
| Metals / Steel | 1 | $35B |
|
||
| Utilities | 1 | $30B |
|
||
| Industrial Machinery | 1 | $19B |
|
||
Price history
+259.4% since first listed8 events — show timeline
- 2026-05-18 Price Changed $575,000 TMLS
- 2026-04-29 Price Changed $589,000 TMLS
- 2026-04-11 Price Changed $599,000 TMLS
- 2026-03-29 Price Changed $610,000 TMLS
- 2026-03-22 Price Changed $625,000 TMLS
- 2026-03-12 Listed $629,000 TMLS
- 2024-04-26 Sold (Public Records) $495,000 Public Records
- 1996-06-07 Sold (Public Records) $160,000 Public Records
Property tax history
+5.5%/yrLatest (2025): $3,892 · +28.9% YoY. Source: county tax records.
Cash-flow waterfall
monthlySold comps — $/sqft
last 12 mo · ≤1 miLoading sold comps…