1147 County Road 150 · Abilene, TX
Flood risk No data
- FEMA flood zone
- —
- Chance of flooding over 30 yrs
- —
- Est. flood insurance / yr
- —
Fire risk No data
- Est. fire insurance / yr
- —
Heat risk No data
- Hot days now (above threshold)
- —
- Hot days in 30 yrs
- —
Wind risk No data
- Chance of severe wind over 30 yrs
- —
Air-quality risk No data
- Unhealthy air days now
- —
- Unhealthy air days in 30 yrs
- —
Risk factors via First Street. Map © Google.
Why this score? — see what drove the C grade
The composite is a weighted blend of 9 inputs, each scored 0–100. Each bar is that input's sub-score; the figure is the points it added to the 100-point composite (weight × sub-score).
- Cash flow +21.6/30.0
- ARV discount +7.5/15.0
- DSCR +6.9/10.0
- Rent growth +5.0/5.0
- 1% rule +4.4/10.0
- Livability +3.8/5.0
- Schools +3.6/10.0
- Condition / age +2.5/5.0
- Appreciation +0.0/10.0
$241,900
🖨 Deal sheet 📄 Offer letter ✓ Due diligence
Listing remarks
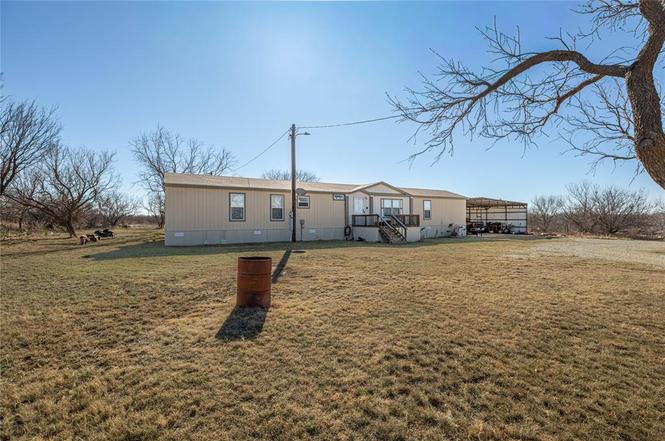
Looking for peaceful country living without giving up the convenience of town? This charming 3-bedroom, 2-bath home sits on 2.5 acres just north of Abilene, offering the perfect blend of space and accessibility. Located only 10 minutes from I-20, shopping, and restaurants, you’ll also enjoy easy access to ACU and Hardin-Simmons University. Plus, it’s just minutes from the area’s growing AI data centers. The property features several outbuildings, providing plenty of storage and workspace, along with a large carport for covered parking. Don’t miss this opportunity to enjoy country living with all the conveniences of city life nearby!
Key facts
- 2.5 acre lot
- 2 parking spots
- Built 2015
Property features AI
Finance
- Other: Property sits on approximately 2.5 acres; Will not subdivide
- Financial info: Accepts Cash, Conventional, FHA, and VA financing
- HOA & community: No homeowners association
Exterior
- Parking: Covered parking for 2; 2 carport spaces; Additional parking
- Security: Video recording permitted on property
- Utilities: Electricity connected; Aerobic septic system; Co-op water service; Individual water meter
- Home design: Mobile home (residential); One level; Preowned (built 2015)
- Construction: Wood construction; Built in 2015
- Exterior features: Gravel and additional parking areas; Aerobic septic; Co-op water; Individual water meter
Interior
- Kitchen: No appliances included
- Bedrooms: 3 bedrooms total; Primary bedroom on level 1 (approx. 12 x 14)
- Bathrooms: 2 full bathrooms
- Heating & cooling: Central heating (electric); Central air conditioning (electric)
- Interior features: Cable TV available; Pantry; One living area; One dining area; Two total rooms (listed)
- Laundry & utility: Utility room with full-size washer/dryer area; Washer hookup
Neighborhood map
What this means for you Summary
Snapshot
- This is a 3-bed/2.0-bath manufactured listed at $242k.
Deal economics
- At list price, monthly cash flow is $366 ($4k/yr) — positive.
- The deal already cash-flows at list — no discount required.
- To meet the 1% rule (rent ≥ 1% of price), the offer needs to be $228k (5.7% below list).
- Recommended offer: $213k (12.0% below list) — sets the bar for market timing.
- Cap rate 8.1% vs local median 6.7% in Abilene — meaningfully above typical; check what's discounted (condition, days-on-market, listing class) to confirm the premium yield is real.
Location & tenants
- Location reads 75/100 on livability (#142 in TX, #4,037 nationally) — a middle-class / working-renter tenant base. Strengths: cost of living A+, housing A+, health & safety A+; Watch: crime D, commute F.
- Clyde CISD (town): math 42% / reading 42% proficiency, ranked #341 of 826 in TX (top 41%) — families likely to look elsewhere, expect single-tenant / working-renter base with shorter leases.
- Zoned schools: Clyde El (366 students, 58% FRL).
- Market conditions: Rents rising fast (+43.4%/yr); 195 active listings in the ZIP.
- At $2,282/mo this rent would consume 51% of the median local household income ($54k/yr) (locally 1240% of renters already pay >50% of income on rent) — very limited rent-growth headroom before tenants either downsize or default.
Forward outlook
- Local home prices are declining (-3.0%/yr); year-one equity from $2k of loan paydown is wiped out by about $7k of value loss. Plan a longer hold.
- Shackelford County population projected at +6% by 2050 — modest demand growth; plan on rents tracking national, not racing it.
- At projected returns (-3.0% appreciation + 8.0% rent growth), your $68k cash investment doubles in ~9 years — after that, you're playing with house money.
Negotiation context
- It's been on market 150 days — a 12% lower offer ($213k) is reasonable based on typical stale-listing flexibility.
Questions for the listing agent
- It's been on market 150 days. Have you received any prior offers? Is the seller open to a 12% concession, seller financing, or rate buy-down credit?
- Why hasn't it sold? Are there any deal-killer items the seller is aware of (foundation, flood, title, zoning, code violations)?
- Is there a deadline driving the sale (1031 exchange, divorce, estate, relocation)? That informs how much negotiation room exists.
- Schools are D-rated, which usually means shorter tenancies and higher turnover. Who's the typical renter profile here, and what's been the actual vacancy rate?
- Crime grade is D in this area — have there been break-ins, vandalism, or insurance claims at this property in the last 3 years? What carrier currently insures it and at what premium?
- What's the average days-on-market for RENTAL listings here right now (not sales)? A rising rental-DOM trend means longer vacancies and softer asking-rent achievability than the comps imply.
- What's the recent tenant-quality profile in this submarket — average credit score on applications, eviction rate, late-payment / NSF rate, and stable-employment percentage? A property-management company in the area should have these aggregated.
- How much new for-sale + rental construction is in the pipeline within 1–3 miles? Heavy new supply typically softens prices + rents 12–24 months out; constrained supply supports both.
Investment metrics
- 1% rule
- 0.94% ✗
- Cap rate
- 8.11%
- Cash-on-cash
- 6.48%
- DSCR
- 1.29
- GRM
- 8.8
CMA / ARV
No comps found within radius.
Projected returns pro-forma
-3.0% appreciation · 8.0% rent growth · sell at horizon
- IRR
- -1.5%
- Equity multiple
- 0.94×
- Total profit
- $-3,965
- Equity at exit
- $36,068
- IRR
- 12.5%
- Equity multiple
- 2.20×
- Total profit
- $80,971
- Equity at exit
- $20,915
Cash invested: $67,732 (down + closing). Projections, not guarantees.
Landlord ↔ Tenant lean methodology
- Overall (STATE)
- 87 Strongly Landlord-Friendly
- State Texas
- 87 Strongly Landlord-Friendly · R+5
- County
- — inherits STATE
- City
- — inherits STATE
ZIP-level market 79601
- Home prices YoY
- -22.8%
- Rents YoY
- 43.4%
- Active inventory
- 195
- Price-to-rent
- 8.8×
Monthly cashflow live
- Estimated rent
- $2,282 medium interval (Pro) →
- Mortgage (P&I)
- −$1,269
- Tax from tax record
- −$68 /mo · $814/yr
- Insurance
- −$101
- HOA
- −$0
- Vacancy / Maint / Mgmt
- −$479
- Net cashflow
- $366
Break-even live
UW: 25.0% down · 7.5% · 30yr · 1.5% tax · 5.0% vac · 8.0% maint · 8.0% mgmt
Financing live
Cash to close
- Down payment
- $60,475
- Closing costs
- $7,257
- Reserves months
- —
- Total cash needed
- —
Loan-product check · same deal, 3 products live
Conventional
25% down · 7.5% · 30yr
- Down + closing
- —
- Monthly P&I
- —
- Monthly cashflow
- —
- DSCR
- —
- Eligible?
- —
Personal DTI + credit; lowest rate.
DSCR
20% down · 8.5% · 30yr
- Down + closing
- —
- Monthly P&I
- —
- Monthly cashflow
- —
- DSCR
- —
- Eligible?
- —
No personal income docs; deal must DSCR.
Hard money
10% down · 12.0% · 12mo
- Down + closing
- —
- Monthly P&I
- —
- Monthly cashflow
- —
- DSCR
- —
- Eligible?
- —
Short-term bridge; refi at stabilization.
Listing history 21 events
-
2026-06-19days on market $241,900 Active 150 DOM
-
2026-06-18days on market $241,900 Active 149 DOM
-
2026-06-17remarks 640-char remark
-
2026-06-17days on market $241,900 Active 148 DOM
-
2026-06-16days on market $241,900 Active 147 DOM
-
2026-06-15days on market $241,900 Active 146 DOM
-
2026-06-14days on market $241,900 Active 144 DOM
-
2026-06-13pricestatusdays on market $241,900 Active 143 DOM
-
2026-06-10days on market $245,000 Active Contingent 141 DOM
-
2026-06-09days on market $245,000 Active Contingent 140 DOM
-
2026-06-08days on market $245,000 Active Contingent 139 DOM
-
2026-06-07days on market $245,000 Active Contingent 138 DOM
-
2026-06-02days on market $245,000 Active Contingent 133 DOM
-
2026-06-01days on market $245,000 Active Contingent 132 DOM
-
2026-05-31days on market $245,000 Active Contingent 131 DOM
-
2026-05-30days on market $245,000 Active Contingent 130 DOM
-
2026-04-10historical Active Contingent
-
2026-04-04status Pending
-
2026-03-10historical Active Contingent
-
2026-02-16price $245,000
-
2026-01-14$250,000 Active
ⓘ Source: listings_history table (triggers on properties + properties_extension) + one-shot
backfill from property_details.listing_events for pre-trigger history.
Tax reassessment forecast TX · Resets to sale price
- Current annual tax
- $814 · $68/mo
- Projected year-2 tax
- $4,427 · $369/mo
- Expected delta
- +$3,613/yr (+$301/mo · 443.6%)
ⓘ Screening estimate from a state-policy table — verify with the county assessor before closing.
Nearby sold comps map
Loading sold comps map…
Walkable amenities ~0.75 mi
Loading nearby amenities…
Taxation est. · year 1
- Rental income
- $27,384
- − Mortgage interest
- −$13,550
- − Property taxes
- −$814
- − Insurance
- −$1,210
- − Repairs & maintenance
- −$2,191
- − Management
- −$2,191
- − Depreciation
- −$7,037
- Taxable income
- $391
- Est. tax owed @ 24.0%
- −$94
- After-tax cash flow
- $4,293/yr
For passive investors: Depreciation is non-cash, so a rental often shows a tax loss while cash-flowing — sheltering income. Rental losses are passive: they offset passive income freely, and up to $25,000/yr can offset ordinary (W-2) income if you actively participate and your MAGI is under $100k (phasing out to $0 by $150k); unused losses carry forward. On sale, claimed depreciation is recaptured at up to 25%, and gains may owe capital-gains tax (a 1031 exchange can defer both). Figures are a year-1 estimate at your 24.0% rate — not tax advice; consult a CPA.
Schools (NCES district)
- District
- Clyde CISD
- NCES district ID
- 4814450
- Math proficiency
- 42% ▼ -7.00%
- Reading proficiency
- 42% ▼ -2.00%
- Median HH income
- $46,614
- Composite
- 35.84/100
- National rank
- #4824
- State rank
- #341 of 826 in TX
Livability — Abilene
- Score
- 75/100
- State rank
- #142
- US rank
- #4037
Category grades
Schools grade is shown separately in the Schools card above.
Census & demographics
- County
- Taylor County · 136,672 people
- City population
- 136,672
- Metro
- Abilene, TX
- Population (ZIP)
- 28,050
- Household income
- $53,631
- Rent vs Own
- Severe rent burden
- 1240.0
Population outlook (Shackelford County) Hauer SSP2
- Today (2025)
- 3,413 people
- By 2030
- 3,467 · +1.6%
- By 2040
- 3,543 · +3.8%
- By 2050
- 3,610 · +5.8%
- By 2075
- 3,872 · +13.4%
- By 2100
- 3,822 · +12.0%
Race, ethnicity, and origin ACS 2023
- Neighborhood character
- Diverse neighborhood (Simpson 0.61)
- Race & ethnicity
- White 55% Hispanic / Latino 25% Black 13% Two or more races 13% Asian 3%
- Hispanic origin (detail)
- Mexican 21%
- Common ancestry
- Italian 2% Lithuanian 2% Serbian 1%
- Foreign-born
- 7% · Canada, Vietnam
- Languages at home
- 81% English-only · Spanish 15% French/Haitian/Cajun 1% Vietnamese 1%
Political lean MEDSL · Shackelford
- 2024 margin
- Solid R (+82.2) · D 8.4% · R 90.6%
- 2008→2024 swing
- -10.7pp toward R · 2008: -71.5pp · 2024: -82.2pp
- All cycles
- 2024: R+82.2 2020: R+83.2 2016: R+84.9 2012: R+79.8 2008: R+71.5
Not yet ingested
- Civics
- —
Market trends
- HPI YoY
- ▼ -63.17%
- Current HPI
- 214.4372
- Rent YoY
- ▲ 43.38%
- Metro
- Abilene, TX
- State GDP YoY
- ▲ 3.95%
- F500 in state
- 110
Industry mix (Fortune 500 HQ in TX)
| Industry | F500 HQs | Revenue |
|---|---|---|
| Energy | 16 | $1,198B |
|
||
| Technology | 5 | $198B |
|
||
| Engineering / Construction | 4 | $72B |
|
||
| Energy Services | 3 | $60B |
|
||
| Utilities | 3 | $41B |
|
||
| Healthcare | 2 | $330B |
|
||
Price history
-2.0% since first listed5 events — show timeline
- 2026-04-10 Contingent — NTREIS
- 2026-04-04 Pending — NTREIS
- 2026-03-10 Contingent — NTREIS
- 2026-02-16 Price Changed $245,000 NTREIS
- 2026-01-14 Listed $250,000 NTREIS
Property tax history
+1.0%/yrLatest (2025): $814 · +12.7% YoY. Source: county tax records.
Cash-flow waterfall
monthlySold comps — $/sqft
last 12 mo · ≤1 miLoading sold comps…