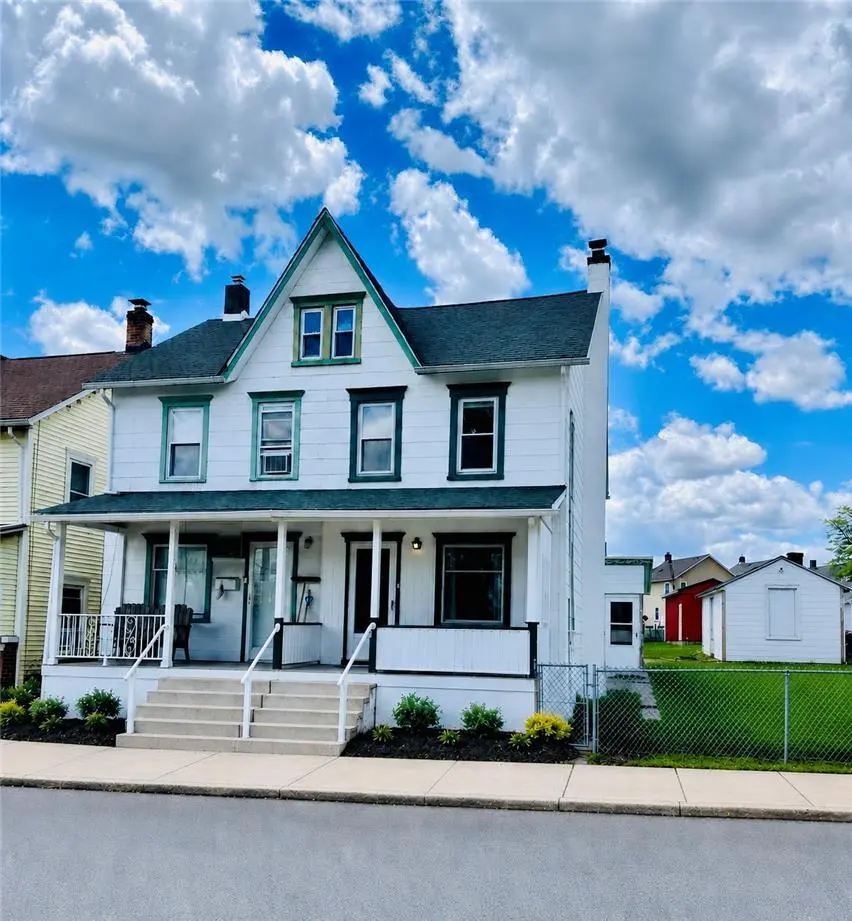
118 N Front St · Coplay, PA
Flood risk 1/10 · Minimal
- FEMA flood zone
- X (unshaded)
- Chance of flooding over 30 yrs
- 0.0%
- Est. flood insurance / yr
- $473 – $860
Fire risk 1/10 · Minimal
- Est. fire insurance / yr
- $511 – $949
Heat risk 5/10 · Moderate
- Hot days now (above 100°F)
- 7 days/yr
- Hot days in 30 yrs
- 15 days/yr
Wind risk 4/10 · Minor
- Chance of severe wind over 30 yrs
- 15.0%
Air-quality risk 2/10 · Minimal
- Unhealthy air days now
- 0 days/yr
- Unhealthy air days in 30 yrs
- 1 days/yr
Risk factors via First Street. Map © Google.
Why this score? — see what drove the D+ grade
The composite is a weighted blend of 9 inputs, each scored 0–100. Each bar is that input's sub-score; the figure is the points it added to the 100-point composite (weight × sub-score).
- Cash flow +15.6/30.0
- ARV discount +12.2/15.0
- 1% rule +4.9/10.0
- DSCR +4.8/10.0
- Livability +4.1/5.0
- Schools +3.4/10.0
- Rent growth +2.5/5.0
- Condition / age +2.5/5.0
- Appreciation +0.0/10.0
$225,900
🖨 Deal sheet (PDF) 📄 Offer letter ✓ Due diligence
Listing remarks MLS
Oversized corner lot * 3 bedrooms * Formal living and dining room * Eat-in kitchen * 1 full bath (2nd fl), 1/2 bath (1st fl) and full bath (LL) * Screened in sun porch * Shed which was a summer kitchen * Garage * Full basement with outside entrance * Full attic * Front porch * Patio * Fenced yard * All window treatments remain * Washer, dryer, refrigerator, range/stove, microwave, ceiling fans, wall & window ac units and garage door opener all remain * Mature landscaping *
Key facts
- Garage
- Built 1900
- Listed 4 days
Property features AI
Exterior
- Parking: Detached garage with garage door opener; Driveway; 1 garage space
- Security: Smoke detector(s)
- Utilities: 200+ amp electrical service; Public water; Public sewer
- Home design: Two-story property; R-2 zoning
- Construction: Built with asbestos siding materials; Asphalt/fiberglass roof
- Exterior features: Porch; Outdoor summer kitchen; Outdoor screen porch; Corner lot; Flat lot; Not in subdivision
Interior
- Kitchen: Electric oven; Electric range; Microwave; Dishwasher; Refrigerator; Eat-in kitchen
- Bedrooms: Second-level bedroom (10 x 9); Second-level bedroom (12 x 10); Second-level bedroom (14 x 12)
- Flooring: Carpet; Laminate; Resilient; Vinyl
- Bathrooms: One full bathroom (second level); One half bathroom (first level)
- Heating & cooling: Oil heating; Attic fan; Ceiling fans; Wall/window cooling units
- Interior features: Attic; Dining area; Separate/formal dining room; Eat-in kitchen
- Laundry & utility: Washer; Dryer; Laundry located on lower level; Oil water heater
Neighborhood map
What this means for you Summary
Snapshot
- This is a 3-bed/1.5-bath townhouse listed at $226k.
Deal economics
- At list price, monthly cash flow is $93 ($1k/yr) — positive.
- The deal already cash-flows at list — no discount required.
- To meet the 1% rule (rent ≥ 1% of price), the offer needs to be $223k (1.4% below list).
- Recommended offer: $223k (1.4% below list) — sets the bar for 1% rule.
Location & tenants
- Location reads 82/100 on livability (#152 in PA, #1,271 nationally) — a professional / high-income tenant draw. Strengths: crime A+, cost of living A+, housing A+; Watch: amenities D, commute F.
- Whitehall-Coplay SD (suburban): math 28% / reading 50% proficiency, ranked #356 of 539 in PA (top 66%) — families likely to look elsewhere, expect single-tenant / working-renter base with shorter leases.
- Zoned schools: George D Steckel El Sch (math 37% / reading 52%, grade F, #815 of 1,518 statewide, top 56%, 565 students, 100% FRL); Whitehall-Coplay Ms (math 14% / reading 49%, grade F, #367 of 512 statewide, top 73%, 982 students, 100% FRL); Whitehall Hs (math 57% / reading 15%, grade F, #300 of 437 statewide, top 70%, 1,459 students, 85% FRL) — zoned schools average 95% FRL vs 38% district-wide (57 pts higher); higher-poverty schools than district average — tighter screening recommended.
- Market conditions: 31 active listings in the ZIP; 7 comparable units currently listed for rent nearby; rentals leasing fast (median 5d on market — plan ~1-2 weeks tenant-placement turnaround); 765 units permitted in Lehigh County in 2024 (286 in 5+ unit buildings).
Forward outlook
- Local home prices are declining (-3.0%/yr); year-one equity from $2k of loan paydown is wiped out by about $7k of value loss. Plan a longer hold.
- Lehigh County population projected at +21% by 2050 — long-run rental-demand tailwind backs the buy-and-hold thesis.
Negotiation context
- Only 4 days on market — expect competitive offers; lowballing is unlikely to land.
- 3 sale attempts since 11y ago; this cycle's ask is 100300% above the opening price — seller raised mid-cycle; expect resistance to lowballs.
- Current owner paid $115k; list at $226k implies a 97% gain — meaningful room to come down on a strong offer.
Risks & watch-outs
- Watch-outs: built in 1900 — expect roof / HVAC / electrical / plumbing capex.
- Climate carrying-cost: extreme-heat days projected 7→15/yr by 2055 (HVAC capex compounding) — expect insurance premiums to compound above CPI over the hold.
Questions for the listing agent
- Built in 1900 — when were the roof, HVAC, electrical panel, plumbing, and water heater last replaced?
- Is there a deadline driving the sale (1031 exchange, divorce, estate, relocation)? That informs how much negotiation room exists.
- Schools are B-rated — typically a magnet for longer-tenancy family renters. What's the average tenant stay here, and is there a school-zone premium baked into asking?
- The area grade is low — what's the realistic commute time and amenity access for the typical tenant pool here? Any planned neighborhood developments (good or bad) we should know about?
- What's the average days-on-market for RENTAL listings here right now (not sales)? A rising rental-DOM trend means longer vacancies and softer asking-rent achievability than the comps imply.
- What's the recent tenant-quality profile in this submarket — average credit score on applications, eviction rate, late-payment / NSF rate, and stable-employment percentage? A property-management company in the area should have these aggregated.
- How much new for-sale + rental construction is in the pipeline within 1–3 miles? Heavy new supply typically softens prices + rents 12–24 months out; constrained supply supports both.
Investment metrics
- 1% rule
- 0.99% ✗
- Cap rate
- 6.79%
- Cash-on-cash
- 1.77%
- DSCR
- 1.08
- GRM
- 8.5
CMA / ARV
- ARV (on-the-fly)
- $252,000
- Comps found
- 12
Show comp detail 12 sales within ~0.75 mi
| Address | Dist | Beds/Ba | Sqft | Sold | Price | $/sf | Match |
|---|---|---|---|---|---|---|---|
| 1284 Main St | 0.37mi | 3/1.0 | 1,276 (+1%) | 9mo | $233,900 | $183 | 71 |
| 1309 Newport Ave | 0.32mi | 3/1.0 | 1,200 (-5%) | 8mo | $240,000 | $200 | 69 |
| 127 Stark St | 0.61mi | 3/2.0 | 1,274 (+1%) | 5mo | $250,000 | $196 | 63 |
| 826 Lincoln Ave | 0.45mi | 3/1.5 | 1,342 (+6%) | 8mo | $250,000 | $186 | 61 |
| 150 W 16th St | 0.53mi | 3/2.0 | 1,212 (-4%) | 7mo | $250,000 | $206 | 61 |
| 1510 Washington Ave | 0.61mi | 3/1.5 | 1,218 (-3%) | 7mo | $238,800 | $196 | 60 |
| 426 E 12th St | 0.70mi | 3/1.5 | 1,159 (-8%) | 2mo | $315,000 | $272 | 52 |
| 1112 Lincoln Ave | 0.51mi | 3/1.5 | 1,433 (+14%) | 3mo | $305,000 | $213 | 51 |
| 1666 Railroad St | 0.67mi | 3/1.0 | 1,324 (+5%) | 9mo | $120,000 | $91 | 51 |
| 3300 Quarry St Unit B4 | 0.69mi | 3/2.0 | 1,403 (+11%) | 6mo | $210,000 | $150 | 42 |
| 1645 Canal St | 0.60mi | 2/1.5 (-1) | 1,080 (-14%) | 4mo | $240,000 | $222 | 40 |
| 1529 Dewey Ave | 0.68mi | 3/1.0 | 1,100 (-13%) | 8mo | $228,000 | $207 | 39 |
Match score weights: distance 35% · size 25% · config 20% · recency 20%. Top-matched comps best support the ARV.
Projected returns pro-forma
-3.0% appreciation · 3.0% rent growth · sell at horizon
- IRR
- -13.4%
- Equity multiple
- 0.52×
- Total profit
- $-30,555
- Equity at exit
- $33,682
- IRR
- -4.4%
- Equity multiple
- 0.71×
- Total profit
- $-18,544
- Equity at exit
- $19,532
Cash invested: $63,252 (down + closing). Projections, not guarantees.
Landlord ↔ Tenant lean methodology
- Overall (STATE)
- 62 Landlord-Friendly
- State Pennsylvania
- 62 Landlord-Friendly · EVEN
- County
- — inherits STATE
- City
- — inherits STATE
ZIP-level market 18037
- Home prices YoY
- -24.1%
- Active inventory
- 31
- Price-to-rent
- 8.5×
Monthly cashflow live
- Estimated rent
- $2,227 high interval (Pro) →
- Mortgage (P&I)
- −$1,185
- Tax from tax record
- −$387 /mo · $4,644/yr
- Insurance
- −$94
- HOA
- −$0
- Vacancy / Maint / Mgmt
- −$468
- Net cashflow
- $93
Break-even live
Sensitivity live
| Price | -10% $221 | -5% $157 | +0% $93 | +5% $30 | +10% $-34 |
|---|---|---|---|---|---|
| Rent | -10% $-82 | -5% $6 | +0% $93 | +5% $181 | +10% $269 |
| Rate | -1.0pp $207 | -0.5pp $151 | base $93 | +0.5pp $35 | +1.0pp $-25 |
UW: 25.0% down · 7.5% · 30yr · 1.5% tax · 5.0% vac · 8.0% maint · 8.0% mgmt
Financing live
Cash to close
- Down payment
- $56,475
- Closing costs
- $6,777
- Reserves months
- —
- Total cash needed
- —
Loan-product check · same deal, 3 products live
Conventional
25% down · 7.5% · 30yr
- Down + closing
- —
- Monthly P&I
- —
- Monthly cashflow
- —
- DSCR
- —
- Eligible?
- —
Personal DTI + credit; lowest rate.
DSCR
20% down · 8.5% · 30yr
- Down + closing
- —
- Monthly P&I
- —
- Monthly cashflow
- —
- DSCR
- —
- Eligible?
- —
No personal income docs; deal must DSCR.
Hard money
10% down · 12.0% · 12mo
- Down + closing
- —
- Monthly P&I
- —
- Monthly cashflow
- —
- DSCR
- —
- Eligible?
- —
Short-term bridge; refi at stabilization.
Rent comps 7 comps
| Address | Beds | Baths | Sqft | Rent | $/sqft | DOM | Units | Dist |
|---|---|---|---|---|---|---|---|---|
| 134 S 3rd St Apt B Coplay, PA | 3.0 | 2.0 | 1250 | $2,299 | $1.84 | 46d | 1 | 0.38mi |
| 134 S 3rd St Apt B Coplay, PA | 3.0 | 2.0 | 1250 | $2,299 | $1.84 | 21d | 1 | 0.38mi |
| 160 William St Northampton, PA | 3.0 | 2.0 | 1600 | $2,690 | $1.68 | 4d | 1 | 0.66mi |
| 3124 N 2nd St Whitehall, PA | 2.0 | 1.0 | 1139 | $1,750 | $1.54 | 4d | 1 | 0.85mi |
| 1916 Washington Ave Northampton, PA | 4.0 | 1.5 | 1856 | $2,400 | $1.29 | 45d | 1 | 1.04mi |
| 3325 Carbon St Whitehall, PA | 1.0–2.0 | 1.0–1.5 | 850 | $1,844 | $2.17 | 4d | 4 | 1.06mi |
| 1108 3rd St Catasauqua, PA | 3.0 | 2.0 | 1400 | $1,795 | $1.28 | 4d | 1 | 1.35mi |
Listing history 4 events
-
2026-06-08status $225,900 Pending 4 DOM
-
2026-06-07days on market $225,900 Active 4 DOM
-
2026-06-03remarks 693-char remark
-
2026-06-03$225,900 Active 1 DOM
ⓘ Source: listings_history table (triggers on properties + properties_extension) + one-shot
backfill from property_details.listing_events for pre-trigger history.
Tax reassessment forecast PA · Partial reset (capped growth)
- Current annual tax
- $4,644 · $387/mo
- Projected year-2 tax
- $4,644 · $387/mo
- Expected delta
- $0/yr ($0/mo · 0.0%)
ⓘ Screening estimate from a state-policy table — verify with the county assessor before closing.
Climate risk First Street
- Flood 1/10 Low FEMA zone X (unshaded) · 0% chance over 30 yrs
- Wildfire 1/10 Low
- Heat 5/10 Major 7 d/yr ≥100°F today · 15 d/yr by 30 yrs out
- Wind 4/10 Moderate 15% chance of damaging wind over 30 yrs
- Air quality 2/10 Low 0 unhealthy d/yr today · 1 by 30 yrs out
Nearby sold comps map
Loading sold comps map…
Walkable amenities ~0.75 mi
Loading nearby amenities…
Taxation est. · year 1
- Rental income
- $26,723
- − Mortgage interest
- −$12,654
- − Property taxes
- −$4,644
- − Insurance
- −$1,130
- − Repairs & maintenance
- −$2,138
- − Management
- −$2,138
- − Depreciation
- −$6,572
- Taxable loss
- −$2,552
- Est. tax savings @ 24.0%
- +$613
- After-tax cash flow
- $1,734/yr
For passive investors: Depreciation is non-cash, so a rental often shows a tax loss while cash-flowing — sheltering income. Rental losses are passive: they offset passive income freely, and up to $25,000/yr can offset ordinary (W-2) income if you actively participate and your MAGI is under $100k (phasing out to $0 by $150k); unused losses carry forward. On sale, claimed depreciation is recaptured at up to 25%, and gains may owe capital-gains tax (a 1031 exchange can defer both). Figures are a year-1 estimate at your 24.0% rate — not tax advice; consult a CPA.
Schools (NCES district)
- District
- Whitehall-Coplay SD
- NCES district ID
- 4226250
- Math proficiency
- 28% ▼ -17.00%
- Reading proficiency
- 50% ▼ -15.00%
- Median HH income
- $54,716
- Composite
- 34.03/100
- National rank
- #5309
- State rank
- #356 of 539 in PA
Livability — Coplay
- Score
- 82/100
- State rank
- #152
- US rank
- #1271
Category grades
Schools grade is shown separately in the Schools card above.
Census & demographics
- Census place
- Coplay, PA
- Population (ZIP)
- 7,459
Population outlook (Lehigh County) Hauer SSP2
- Today (2025)
- 392,957 people
- By 2030
- 408,319 · +3.9%
- By 2040
- 440,007 · +12.0%
- By 2050
- 475,940 · +21.1%
- By 2075
- 590,448 · +50.3%
- By 2100
- 690,314 · +75.7%
Race, ethnicity, and origin ACS 2023
- Neighborhood character
- Predominantly White (84%)
- Race & ethnicity
- White 84% Hispanic / Latino 13% Two or more races 11%
- Hispanic origin (detail)
- Puerto Rican 8%
- Common ancestry
- Romanian 7% Danish 4% Polish 3%
- Foreign-born
- 3% · Canada
- Languages at home
- 94% English-only · Spanish 4% Arabic 1% Other Indo-European 1%
Political lean MEDSL · Lehigh
- 2024 margin
- Toss-up / Even · D 50.7% · R 48.0% · Other 1.2%
- 2008→2024 swing
- -12.9pp toward R · 2008: 15.6pp · 2024: 2.7pp
- All cycles
- 2024: D+2.7 2020: D+7.6 2016: D+4.4 2012: D+7.5 2008: D+15.6
Not yet ingested
- Civics
- —
Market trends
- HPI YoY
- ▼ -92.12%
- Current HPI
- 289.8882
- Rent YoY
- —
- Metro
- —
- State GDP YoY
- ▲ 1.68%
- F500 in state
- 34
Industry mix (Fortune 500 HQ in PA)
| Industry | F500 HQs | Revenue |
|---|---|---|
| Healthcare | 2 | $309B |
|
||
| Insurance | 2 | $27B |
|
||
| Telecommunications / Media | 1 | $124B |
|
||
| Industrial Distribution | 1 | $22B |
|
||
| Financial Services | 1 | $20B |
|
||
| Chemicals / Materials | 1 | $18B |
|
||
Price history
+244.9% since first listed9 events — show timeline
- 2026-06-03 Relisted — GLVRMLS
- 2026-05-29 Price Changed $225,900 GLVRMLS
- 2026-05-16 Listed $225 GLVRMLS
- 2016-01-29 Sold (Public Records) $114,900 Public Records
- 2016-01-28 Sold (MLS) $114,900 GLVRMLS
- 2015-12-04 Pending — GLVRMLS
- 2015-11-09 Price Changed $114,900 GLVRMLS
- 2015-10-29 Listed $124,900 GLVRMLS
- 1998-08-05 Sold (Public Records) $65,500 Public Records
Property tax history
+3.9%/yrLatest (2026): $4,644 · +3.6% YoY. Source: county tax records.
Cash-flow waterfall
monthlySold comps — $/sqft
last 12 mo · ≤1 miLoading sold comps…