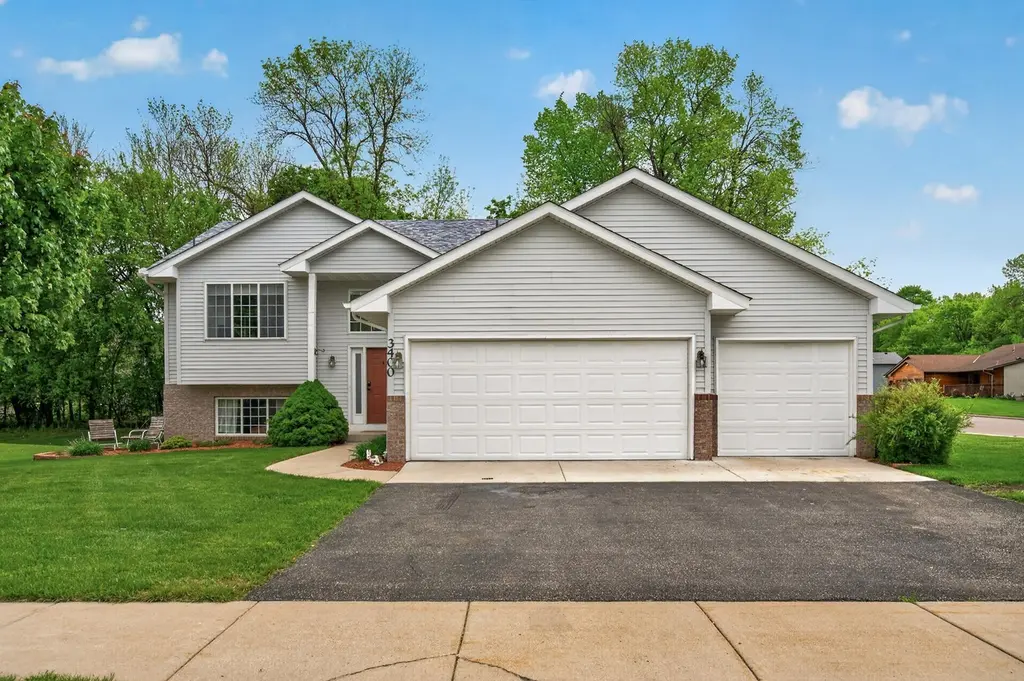
3400 Kalenda Ave NE · St. Michael, MN
Flood risk 1/10 · Minimal
- FEMA flood zone
- X
- Chance of flooding over 30 yrs
- 0.0%
- Est. flood insurance / yr
- $507 – $1,088
Fire risk 1/10 · Minimal
- Est. fire insurance / yr
- $888 – $1,650
Heat risk 2/10 · Minimal
- Hot days now (above 98°F)
- 7 days/yr
- Hot days in 30 yrs
- 14 days/yr
Wind risk 2/10 · Minimal
- Chance of severe wind over 30 yrs
- —
Air-quality risk 2/10 · Minimal
- Unhealthy air days now
- 1 days/yr
- Unhealthy air days in 30 yrs
- 2 days/yr
Risk factors via First Street. Map © Google.
Why this score? — see what drove the F grade
The composite is a weighted blend of 9 inputs, each scored 0–100. Each bar is that input's sub-score; the figure is the points it added to the 100-point composite (weight × sub-score).
- ARV discount +7.5/15.0
- Schools +5.8/10.0
- Cash flow +5.7/30.0
- Rent growth +2.5/5.0
- Livability +2.5/5.0
- Condition / age +2.5/5.0
- 1% rule +0.2/10.0
- DSCR +0.1/10.0
- Appreciation +0.0/10.0
$369,900
🖨 Deal sheet (PDF) 📄 Offer letter ✓ Due diligence
Listing remarks MLS
Newer roof, master bedroom with walk-in-closet and full bath. Very unique split foyer floor plan. Spacious and open. Great eat-in kitchen and formal dining. Room to expand.
Key facts
- 0.3 acre lot
- 3 garage spots
- Built 2001
Property features AI
Finance
- Financial info: Eligible for VA financing
Exterior
- Parking: Attached heated and insulated garage with garage door opener; 3-car garage
- Utilities: City water connected; City sewer connected; Natural gas
- Home design: Residential split-entry (bi-level) home; Main entry level and lower level living areas
- Construction: Asphalt roof (age 8 years or less); Block foundation; Built with vinyl and metal siding
- Exterior features: Vinyl and metal exterior; Invisible fencing; Storage shed; In-ground sprinkler system; Corner lot with medium tree coverage; City street with paved frontage
Interior
- Kitchen: Refrigerator; Range; Microwave; Dishwasher; Stainless steel appliances; Kitchen island
- Bedrooms: 4 bedrooms (primary suite on upper level / main and lower level bedrooms included)
- Bathrooms: 2 full bathrooms; 1 half bathroom; Primary bathroom is private with walk-in shower stall; Rough-in for additional bathroom
- Heating & cooling: Forced air heating; Central air conditioning
- Interior features: Ceiling fans; Kitchen center island; Kitchen window; Primary bedroom with walk-in closet; Walk-in closet(s); Water softener (owned); Finished daylight basement with lookout windows; Block foundation in basement
- Laundry & utility: Washer and dryer included; Lower-level laundry room; Washer/dryer hookup
Neighborhood map
What this means for you Summary
Snapshot
- This is a 2-bed/2.0-bath single-family listed at $370k.
Deal economics
- At list price, monthly cash flow is $-757 ($-9k/yr) — negative.
- To cash-flow at today's rent, offer at most $236k (36.1% below list).
- To meet the 1% rule (rent ≥ 1% of price), the offer needs to be $191k (48.4% below list).
- Recommended offer: $191k (48.4% below list) — sets the bar for 1% rule.
- Cap rate 3.8% vs local median 3.2% in St. Michael — meaningfully above typical; check what's discounted (condition, days-on-market, listing class) to confirm the premium yield is real.
Location & tenants
- Location reads: area grade F — affects rentability + tenant quality, not the cash-flow math above.
- St. Michael-Albertville School District (rural): math 62% / reading 66% proficiency, ranked #17 of 301 in MN (top 6%) — acceptable for families but not a draw, mixed tenant base, ~2y average lease; only 9% free/reduced lunch — higher-income household profile.
- Zoned schools: St. Michael Elementary (math 84% / reading 71%, grade A, #21 of 857 statewide, top 3%, 588 students, 23% FRL); St. Michael-Albertville Middle East (math 57% / reading 65%, grade B+, #24 of 258 statewide, top 9%, 892 students, 18% FRL); St. Michael-Albertville Senior High (math 60% / reading 71%, grade B, #27 of 471 statewide, top 6%, 2,240 students, 17% FRL).
- Market conditions: 356 active listings in the ZIP; high-income renter base; 1,260 units permitted in Wright County in 2024 (180 in 5+ unit buildings).
- This rent is only 17% of the median local income ($131k/yr) — well below the 30% rent-burden line; pricing power to push rent on renewal without tenant pushback.
Forward outlook
- Local home prices are declining (-3.0%/yr); year-one equity from $3k of loan paydown is wiped out by about $11k of value loss. Plan a longer hold.
- Wright County population projected at +9% by 2050 — modest demand growth; plan on rents tracking national, not racing it.
Negotiation context
- Only 8 days on market — expect competitive offers; lowballing is unlikely to land.
- 3 sale attempts since 17y ago with the ask held roughly flat each time — persistent listings suggest the price (not the market) is what's stuck; bring a comps-based counter.
- Current owner paid $180k; list at $370k implies a 106% gain — meaningful room to come down on a strong offer.
Questions for the listing agent
- What do current leases actually rent for vs. the listed asking? Can we see a recent rent roll and the last 12 months of T-12 income?
- Is there a deadline driving the sale (1031 exchange, divorce, estate, relocation)? That informs how much negotiation room exists.
- The area grade is low — what's the realistic commute time and amenity access for the typical tenant pool here? Any planned neighborhood developments (good or bad) we should know about?
- What's the average days-on-market for RENTAL listings here right now (not sales)? A rising rental-DOM trend means longer vacancies and softer asking-rent achievability than the comps imply.
- What's the recent tenant-quality profile in this submarket — average credit score on applications, eviction rate, late-payment / NSF rate, and stable-employment percentage? A property-management company in the area should have these aggregated.
- How much new for-sale + rental construction is in the pipeline within 1–3 miles? Heavy new supply typically softens prices + rents 12–24 months out; constrained supply supports both.
Investment metrics
- 1% rule
- 0.52% ✗
- Cap rate
- 3.84%
- Cash-on-cash
- -8.77%
- DSCR
- 0.61
- GRM
- 16.1
CMA / ARV
No comps found within radius.
Projected returns pro-forma
-3.0% appreciation · 3.0% rent growth · sell at horizon
- IRR
- -31.9%
- Equity multiple
- -0.05×
- Total profit
- $-108,273
- Equity at exit
- $55,153
- IRR
- -36.8%
- Equity multiple
- -0.52×
- Total profit
- $-156,935
- Equity at exit
- $31,982
Cash invested: $103,572 (down + closing). Projections, not guarantees.
Landlord ↔ Tenant lean methodology
- Overall (STATE)
- 46 Balanced
- State Minnesota
- 46 Balanced · D+2
- County
- — inherits STATE
- City
- — inherits STATE
ZIP-level market 55376
- Home prices YoY
- -30.4%
- Active inventory
- 356
- Price-to-rent
- 16.1×
Monthly cashflow live
- Estimated rent
- $1,910 medium interval (Pro) →
- Mortgage (P&I)
- −$1,940
- Tax from tax record
- −$171 /mo · $2,056/yr
- Insurance
- −$154
- HOA
- −$0
- Vacancy / Maint / Mgmt
- −$401
- Net cashflow
- $-757
Break-even live
Sensitivity live
| Price | -10% $-547 | -5% $-652 | +0% $-757 | +5% $-861 | +10% $-966 |
|---|---|---|---|---|---|
| Rent | -10% $-907 | -5% $-832 | +0% $-757 | +5% $-681 | +10% $-606 |
| Rate | -1.0pp $-570 | -0.5pp $-662 | base $-757 | +0.5pp $-852 | +1.0pp $-950 |
UW: 25.0% down · 7.5% · 30yr · 1.5% tax · 5.0% vac · 8.0% maint · 8.0% mgmt
Financing live
Cash to close
- Down payment
- $92,475
- Closing costs
- $11,097
- Reserves months
- —
- Total cash needed
- —
Loan-product check · same deal, 3 products live
Conventional
25% down · 7.5% · 30yr
- Down + closing
- —
- Monthly P&I
- —
- Monthly cashflow
- —
- DSCR
- —
- Eligible?
- —
Personal DTI + credit; lowest rate.
DSCR
20% down · 8.5% · 30yr
- Down + closing
- —
- Monthly P&I
- —
- Monthly cashflow
- —
- DSCR
- —
- Eligible?
- —
No personal income docs; deal must DSCR.
Hard money
10% down · 12.0% · 12mo
- Down + closing
- —
- Monthly P&I
- —
- Monthly cashflow
- —
- DSCR
- —
- Eligible?
- —
Short-term bridge; refi at stabilization.
Listing history 9 events
-
2026-05-22$369,900 Active
-
2026-05-19historical $369,900
-
2009-04-30soldstatus $179,900
-
2009-03-25historical 172-char remark
Show marketing remark (172 chars)
Newer roof, master bedroom with walk-in-closet and full bath. Very unique split foyer floor plan. Spacious and open. Great eat-in kitchen and formal dining. Room to expand.
-
2009-03-25soldstatus $179,900 166-char remark
Show marketing remark (172 chars)
Newer roof, master bedroom with walk-in-closet and full bath. Very unique split foyer floor plan. Spacious and open. Great eat-in kitchen and formal dining. Room to expand.
-
2009-03-25soldstatus $179,900 172-char remark
Show marketing remark (172 chars)
Newer roof, master bedroom with walk-in-closet and full bath. Very unique split foyer floor plan. Spacious and open. Great eat-in kitchen and formal dining. Room to expand.
-
2009-03-07historical 166-char remark
Show marketing remark (166 chars)
Very Unique split foyer plan. Spacious and open. Newer roof, Master Beddroom has walk-in closet and full bath. Great eat-in kitchen and family dining. Room to expand.
-
2009-02-17$179,900 172-char remark
Show marketing remark (172 chars)
Newer roof, master bedroom with walk-in-closet and full bath. Very unique split foyer floor plan. Spacious and open. Great eat-in kitchen and formal dining. Room to expand.
-
2009-01-27$179,900 166-char remark
Show marketing remark (166 chars)
Very Unique split foyer plan. Spacious and open. Newer roof, Master Beddroom has walk-in closet and full bath. Great eat-in kitchen and family dining. Room to expand.
ⓘ Source: listings_history table (triggers on properties + properties_extension) + one-shot
backfill from property_details.listing_events for pre-trigger history.
Tax reassessment forecast MN · Partial reset (capped growth)
- Current annual tax
- $2,056 · $171/mo
- Projected year-2 tax
- $3,099 · $258/mo
- Expected delta
- +$1,043/yr (+$87/mo · 50.8%)
ⓘ Screening estimate from a state-policy table — verify with the county assessor before closing.
Climate risk First Street
- Flood 1/10 Low FEMA zone X · 0% chance over 30 yrs
- Wildfire 1/10 Low
- Heat 2/10 Low 7 d/yr ≥98°F today · 14 d/yr by 30 yrs out
- Wind 2/10 Low
- Air quality 2/10 Low 1 unhealthy d/yr today · 2 by 30 yrs out
Nearby sold comps map
Loading sold comps map…
Walkable amenities ~0.75 mi
Loading nearby amenities…
Taxation est. · year 1
- Rental income
- $22,917
- − Mortgage interest
- −$20,720
- − Property taxes
- −$2,056
- − Insurance
- −$1,850
- − Repairs & maintenance
- −$1,833
- − Management
- −$1,833
- − Depreciation
- −$10,761
- Taxable loss
- −$16,136
- Est. tax savings @ 24.0%
- +$3,873
- After-tax cash flow
- $-5,206/yr
For passive investors: Depreciation is non-cash, so a rental often shows a tax loss while cash-flowing — sheltering income. Rental losses are passive: they offset passive income freely, and up to $25,000/yr can offset ordinary (W-2) income if you actively participate and your MAGI is under $100k (phasing out to $0 by $150k); unused losses carry forward. On sale, claimed depreciation is recaptured at up to 25%, and gains may owe capital-gains tax (a 1031 exchange can defer both). Figures are a year-1 estimate at your 24.0% rate — not tax advice; consult a CPA.
Schools (NCES district)
- District
- St. Michael-Albertville School District
- NCES district ID
- 2733790
- Math proficiency
- 62% ▼ -13.00%
- Reading proficiency
- 66% ▼ -10.00%
- Median HH income
- $86,897
- Composite
- 57.91/100
- National rank
- #1042
- State rank
- #17 of 301 in MN
Livability — St. Michael
No livability data for this city. (Only ~50 U.S. cities are tracked.)
Census & demographics
- Census place
- St. Michael, MN
- County
- Wright County · 79,164 people
- City population
- 19,317
- Metro
- Minneapolis-St. Paul-Bloomington, MN-WI
- Population (ZIP)
- 20,106
- Household income
- $131,266
- Rent vs Own
- Severe rent burden
- 132.0
Population outlook (Wright County) Hauer SSP2
- Today (2025)
- 142,526 people
- By 2030
- 146,915 · +3.1%
- By 2040
- 153,625 · +7.8%
- By 2050
- 155,416 · +9.0%
- By 2075
- 150,352 · +5.5%
- By 2100
- 130,631 · -8.3%
Race, ethnicity, and origin ACS 2023
- Neighborhood character
- Predominantly White (87%)
- Race & ethnicity
- White 87% Black 4% Two or more races 4% Hispanic / Latino 3% Asian 3%
- Common ancestry
- Portuguese 13% Romanian 5% Lithuanian 4%
- Foreign-born
- 4% · Canada, South Korea, Vietnam
- Languages at home
- 95% English-only · Spanish 2% Other Asian/Pacific 1% German/W. Germanic 1%
Political lean MEDSL · Wright
- 2024 margin
- Strong R (+29.4) · D 34.4% · R 63.8% · Other 1.8%
- 2008→2024 swing
- -11.9pp toward R · 2008: -17.4pp · 2024: -29.4pp
- All cycles
- 2024: R+29.4 2020: R+28.6 2016: R+33.2 2012: R+21.4 2008: R+17.4
Not yet ingested
- Civics
- —
Market trends
- HPI YoY
- ▼ -100.03%
- Current HPI
- 229.5977
- Rent YoY
- —
- Metro
- Minneapolis-St. Paul-Bloomington, MN-WI
- State GDP YoY
- ▲ 2.41%
- F500 in state
- 34
Industry mix (Fortune 500 HQ in MN)
| Industry | F500 HQs | Revenue |
|---|---|---|
| Healthcare | 2 | $407B |
|
||
| Retail | 2 | $150B |
|
||
| Consumer Goods | 2 | $32B |
|
||
| Industrial Machinery | 2 | $6B |
|
||
| Agriculture | 1 | $40B |
|
||
| Healthcare / Medical Devices | 1 | $32B |
|
||
Price history
+105.6% since first listed9 events — show timeline
- 2026-05-22 Listed $369,900 NORTHSTARMLS as Distributed by MLS Grid
- 2026-05-19 Coming Soon $369,900 NORTHSTARMLS as Distributed by MLS Grid
- 2009-04-30 Sold (Public Records) $179,900 Public Records
- 2009-03-25 Sold (MLS) $179,900 NORTHSTARMLS as Distributed by MLS Grid
- 2009-03-25 Listing Removed — NORTHSTARMLS as Distributed by MLS Grid
- 2009-03-25 Sold (MLS) $179,900 NORTHSTARMLS as Distributed by MLS Grid
- 2009-03-07 Listing Removed — NORTHSTARMLS as Distributed by MLS Grid
- 2009-02-17 Listed $179,900 NORTHSTARMLS as Distributed by MLS Grid
- 2009-01-27 Listed $179,900 NORTHSTARMLS as Distributed by MLS Grid
Property tax history
-0.2%/yrLatest (2025): $2,056 · +4.9% YoY. Source: county tax records.
Cash-flow waterfall
monthlySold comps — $/sqft
last 12 mo · ≤1 miLoading sold comps…