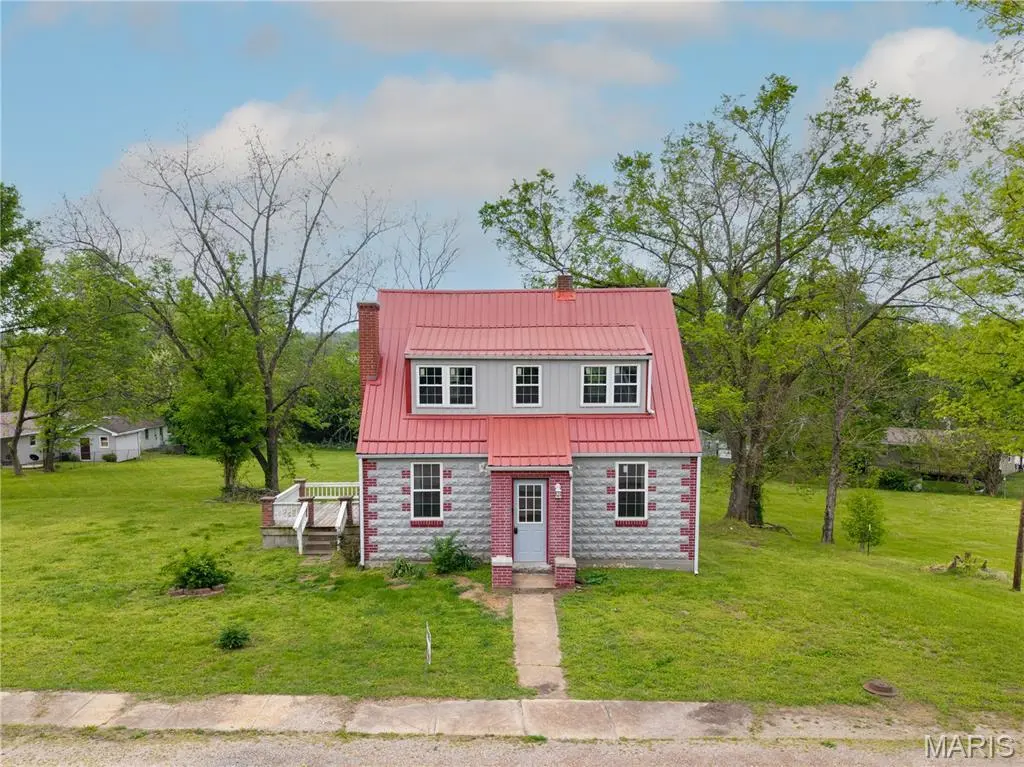
605 Third St · Marble Hill, MO
Flood risk 1/10 · Minimal
- FEMA flood zone
- —
- Chance of flooding over 30 yrs
- 0.0%
- Est. flood insurance / yr
- —
Fire risk 4/10 · Minor
- Est. fire insurance / yr
- $1,054 – $1,958
Heat risk 5/10 · Moderate
- Hot days now (above 106°F)
- 7 days/yr
- Hot days in 30 yrs
- 22 days/yr
Wind risk 2/10 · Minimal
- Chance of severe wind over 30 yrs
- 3.0%
Air-quality risk 1/10 · Minimal
- Unhealthy air days now
- 0 days/yr
- Unhealthy air days in 30 yrs
- 0 days/yr
Risk factors via First Street. Map © Google.
Why this score? — see what drove the D grade
The composite is a weighted blend of 9 inputs, each scored 0–100. Each bar is that input's sub-score; the figure is the points it added to the 100-point composite (weight × sub-score).
- Cash flow +14.6/30.0
- ARV discount +6.5/15.0
- Appreciation +5.0/10.0
- DSCR +4.4/10.0
- 1% rule +3.0/10.0
- Livability +3.0/5.0
- Schools +2.8/10.0
- Rent growth +2.5/5.0
- Condition / age +2.5/5.0
$124,900
🖨 Deal sheet (PDF) 📄 Offer letter ✓ Due diligence
Key facts
- 1.27 acre lot
- Parking
- Built 1950
Neighborhood map
What this means for you Summary
Snapshot
- This is a 2-bed/1.0-bath other listed at $125k.
Deal economics
- At list price, monthly cash flow is $29 ($351/yr) — positive.
- The deal already cash-flows at list — no discount required.
- To meet the 1% rule (rent ≥ 1% of price), the offer needs to be $100k (20.1% below list).
- Recommended offer: $100k (20.1% below list) — sets the bar for 1% rule.
- Cap rate 6.6% vs local median 5.1% in Marble Hill — meaningfully above typical; check what's discounted (condition, days-on-market, listing class) to confirm the premium yield is real.
Location & tenants
- Location reads 60/100 on livability (#508 in MO) — a middle-class / working-renter tenant base. Strengths: cost of living A+, crime A, housing A-; Watch: amenities F, commute F, employment F.
- Woodland R-IV (rural): math 27% / reading 42% proficiency, ranked #239 of 324 in MO (top 74%) — families likely to look elsewhere, expect single-tenant / working-renter base with shorter leases.
- Zoned schools: Woodland Elem. (math 32% / reading 32%, grade F, #761 of 1,115 statewide, top 72%, 347 students, 63% FRL); Woodland Middle (math 30% / reading 47%, grade F, #202 of 391 statewide, top 54%, 261 students, 56% FRL); Woodland High (math 12% / reading 37%, grade F, #445 of 521 statewide, top 87%, 248 students, 51% FRL) — zoned schools at 57% FRL track the district average.
- Market conditions: 44 active listings in the ZIP.
Forward outlook
- In year one you build about $5k of equity ($864 loan paydown + $4k appreciation (3.0% local appreciation)).
- Bollinger County population projected at -14% by 2050 — secular population decline; favor cash flow + early exit over multi-decade hold.
- At projected returns (3.0% appreciation + 3.0% rent growth), your $35k cash investment doubles in ~6 years — after that, you're playing with house money.
- By year 8, paydown + projected appreciation supports a ~$34k cash-out refi (75% LTV) — recoverable capital for the next deal without selling this one.
Negotiation context
- It's been on market 74 days — a 6% lower offer ($117k) is reasonable based on typical stale-listing flexibility.
- 3 sale attempts since 2y ago with the ask held roughly flat each time — persistent listings suggest the price (not the market) is what's stuck; bring a comps-based counter.
Risks & watch-outs
- Watch-outs: built in 1950 — expect roof / HVAC / electrical / plumbing capex.
- Climate carrying-cost: extreme-heat days projected 7→22/yr by 2055 (HVAC capex compounding) — expect insurance premiums to compound above CPI over the hold.
Questions for the listing agent
- It's been on market 74 days. Have you received any prior offers? Is the seller open to a 20% concession, seller financing, or rate buy-down credit?
- Built in 1950 — when were the roof, HVAC, electrical panel, plumbing, and water heater last replaced?
- Why hasn't it sold? Are there any deal-killer items the seller is aware of (foundation, flood, title, zoning, code violations)?
- Is there a deadline driving the sale (1031 exchange, divorce, estate, relocation)? That informs how much negotiation room exists.
- Schools are F-rated, which usually means shorter tenancies and higher turnover. Who's the typical renter profile here, and what's been the actual vacancy rate?
- The area grade is low — what's the realistic commute time and amenity access for the typical tenant pool here? Any planned neighborhood developments (good or bad) we should know about?
- What's the average days-on-market for RENTAL listings here right now (not sales)? A rising rental-DOM trend means longer vacancies and softer asking-rent achievability than the comps imply.
- What's the recent tenant-quality profile in this submarket — average credit score on applications, eviction rate, late-payment / NSF rate, and stable-employment percentage? A property-management company in the area should have these aggregated.
- How much new for-sale + rental construction is in the pipeline within 1–3 miles? Heavy new supply typically softens prices + rents 12–24 months out; constrained supply supports both.
Investment metrics
- 1% rule
- 0.80% ✗
- Cap rate
- 6.57%
- Cash-on-cash
- 1.00%
- DSCR
- 1.04
- GRM
- 10.4
CMA / ARV
- ARV (median comp)
- $122,289
- List price
- $124,900
- Delta
- 2.14%
- Verdict
- FAIR
- Comps
- 20 within 1.0 mi
Projected returns pro-forma
3.0% appreciation · 3.0% rent growth · sell at horizon
- IRR
- 8.4%
- Equity multiple
- 1.48×
- Total profit
- $16,860
- Equity at exit
- $56,160
- IRR
- 11.0%
- Equity multiple
- 2.64×
- Total profit
- $57,362
- Equity at exit
- $86,550
Cash invested: $34,972 (down + closing). Projections, not guarantees.
Landlord ↔ Tenant lean methodology
- Overall (STATE)
- 81 Strongly Landlord-Friendly
- State Missouri
- 81 Strongly Landlord-Friendly · R+10
- County
- — inherits STATE
- City
- — inherits STATE
ZIP-level market 63764
- Active inventory
- 44
- Price-to-rent
- 10.4×
Monthly cashflow live
- Estimated rent
- $999 medium interval (Pro) →
- Mortgage (P&I)
- −$655
- Tax from tax record
- −$53 /mo · $631/yr
- Insurance
- −$52
- HOA
- −$0
- Vacancy / Maint / Mgmt
- −$210
- Net cashflow
- $29
Break-even live
Sensitivity live
| Price | -10% $100 | -5% $65 | +0% $29 | +5% $-6 | +10% $-41 |
|---|---|---|---|---|---|
| Rent | -10% $-50 | -5% $-10 | +0% $29 | +5% $69 | +10% $108 |
| Rate | -1.0pp $92 | -0.5pp $61 | base $29 | +0.5pp $-3 | +1.0pp $-36 |
UW: 25.0% down · 7.5% · 30yr · 1.5% tax · 5.0% vac · 8.0% maint · 8.0% mgmt
Financing live
Cash to close
- Down payment
- $31,225
- Closing costs
- $3,747
- Reserves months
- —
- Total cash needed
- —
Loan-product check · same deal, 3 products live
Conventional
25% down · 7.5% · 30yr
- Down + closing
- —
- Monthly P&I
- —
- Monthly cashflow
- —
- DSCR
- —
- Eligible?
- —
Personal DTI + credit; lowest rate.
DSCR
20% down · 8.5% · 30yr
- Down + closing
- —
- Monthly P&I
- —
- Monthly cashflow
- —
- DSCR
- —
- Eligible?
- —
No personal income docs; deal must DSCR.
Hard money
10% down · 12.0% · 12mo
- Down + closing
- —
- Monthly P&I
- —
- Monthly cashflow
- —
- DSCR
- —
- Eligible?
- —
Short-term bridge; refi at stabilization.
Listing history 24 events
-
2026-06-22days on market $124,900 Active 74 DOM
-
2026-06-21days on market $124,900 Active 73 DOM
-
2026-06-21days on market $124,900 Active 72 DOM
-
2026-06-18days on market $124,900 Active 70 DOM
-
2026-06-17days on market $124,900 Active 69 DOM
-
2026-06-16days on market $124,900 Active 68 DOM
-
2026-06-15days on market $124,900 Active 67 DOM
-
2026-06-13days on market $124,900 Active 65 DOM
-
2026-06-12days on market $124,900 Active 64 DOM
-
2026-06-09days on market $124,900 Active 61 DOM
-
2026-06-08days on market $124,900 Active 60 DOM
-
2026-06-07days on market $124,900 Active 59 DOM
-
2026-06-07days on market $124,900 Active 58 DOM
-
2026-06-04days on market $124,900 Active 55 DOM
-
2026-06-02days on market $124,900 Active 54 DOM
-
2026-06-01days on market $124,900 Active 53 DOM
-
2026-05-31days on market $124,900 Active 52 DOM
-
2026-04-09$129,900 Active
-
2025-11-05price $129,900
-
2025-10-15$134,900 Active
-
2024-04-26soldstatus Closed
-
2024-03-18status Pending
-
2024-01-23$114,900 Active
-
1986-03-04soldstatus
ⓘ Source: listings_history table (triggers on properties + properties_extension) + one-shot
backfill from property_details.listing_events for pre-trigger history.
Tax reassessment forecast MO · Resets to sale price
- Current annual tax
- $631 · $53/mo
- Projected year-2 tax
- $1,212 · $101/mo
- Expected delta
- +$581/yr (+$48/mo · 92.1%)
ⓘ Screening estimate from a state-policy table — verify with the county assessor before closing.
Climate risk First Street
- Flood 1/10 Low 0% chance over 30 yrs
- Wildfire 4/10 Moderate
- Heat 5/10 Major 7 d/yr ≥106°F today · 22 d/yr by 30 yrs out
- Wind 2/10 Low 3% chance of damaging wind over 30 yrs
- Air quality 1/10 Low 0 unhealthy d/yr today · 0 by 30 yrs out
Nearby sold comps map
Loading sold comps map…
Walkable amenities ~0.75 mi
Loading nearby amenities…
Taxation est. · year 1
- Rental income
- $11,982
- − Mortgage interest
- −$6,996
- − Property taxes
- −$631
- − Insurance
- −$624
- − Repairs & maintenance
- −$959
- − Management
- −$959
- − Depreciation
- −$3,633
- Taxable loss
- −$1,820
- Est. tax savings @ 24.0%
- +$437
- After-tax cash flow
- $788/yr
For passive investors: Depreciation is non-cash, so a rental often shows a tax loss while cash-flowing — sheltering income. Rental losses are passive: they offset passive income freely, and up to $25,000/yr can offset ordinary (W-2) income if you actively participate and your MAGI is under $100k (phasing out to $0 by $150k); unused losses carry forward. On sale, claimed depreciation is recaptured at up to 25%, and gains may owe capital-gains tax (a 1031 exchange can defer both). Figures are a year-1 estimate at your 24.0% rate — not tax advice; consult a CPA.
Schools (NCES district)
- District
- Woodland R-IV
- NCES district ID
- 2919350
- Math proficiency
- 27% ▼ -10.00%
- Reading proficiency
- 42% ▼ -2.00%
- Median HH income
- $32,564
- Composite
- 28.21/100
- National rank
- #6804
- State rank
- #239 of 324 in MO
Livability — Marble Hill
- Score
- 60/100
- State rank
- #508
- US rank
- #19511
Category grades
Schools grade is shown separately in the Schools card above.
Census & demographics
- Census place
- Marble Hill, MO
- Population (ZIP)
- 4,568
Population outlook (Bollinger County) Hauer SSP2
- Today (2025)
- 11,825 people
- By 2030
- 11,546 · -2.4%
- By 2040
- 10,935 · -7.5%
- By 2050
- 10,222 · -13.6%
- By 2075
- 8,396 · -29.0%
- By 2100
- 6,530 · -44.8%
Race, ethnicity, and origin ACS 2023
- Neighborhood character
- Predominantly White (89%)
- Race & ethnicity
- White 89% Two or more races 6% Hispanic / Latino 3% Black 1%
- Common ancestry
- Iranian 5% Lithuanian 3% Serbian 2%
- Foreign-born
- 0%
Political lean MEDSL · Bollinger
- 2024 margin
- Solid R (+74.8) · D 12.3% · R 87.1%
- 2008→2024 swing
- -35.4pp toward R · 2008: -39.5pp · 2024: -74.8pp
- All cycles
- 2024: R+74.8 2020: R+73.8 2016: R+72.7 2012: R+52.8 2008: R+39.5
Not yet ingested
- Civics
- —
Market trends
- HPI YoY
- —
- Current HPI
- —
- Rent YoY
- —
- Metro
- —
- State GDP YoY
- ▲ 1.84%
- F500 in state
- 20
Industry mix (Fortune 500 HQ in MO)
| Industry | F500 HQs | Revenue |
|---|---|---|
| Healthcare | 1 | $163B |
|
||
| Insurance | 1 | $21B |
|
||
| Industrial Technology | 1 | $17B |
|
||
| Retail | 1 | $16B |
|
||
| Industrial Distribution | 1 | $10B |
|
||
| Utilities | 1 | $9B |
|
||
Price history
+13.1% since first listed7 events — show timeline
- 2026-04-09 Listed $129,900 MARIS as Distributed by MLS Grid
- 2025-11-05 Price Changed $129,900 MARIS as Distributed by MLS Grid
- 2025-10-15 Listed $134,900 MARIS as Distributed by MLS Grid
- 2024-04-26 Sold (MLS) — MARIS as Distributed by MLS Grid
- 2024-03-18 Pending — MARIS as Distributed by MLS Grid
- 2024-01-23 Listed $114,900 MARIS as Distributed by MLS Grid
- 1986-03-04 Sold (Public Records) — Public Records
Property tax history
+7.3%/yrLatest (2025): $631 · +11.6% YoY. Source: county tax records.
Cash-flow waterfall
monthlySold comps — $/sqft
last 12 mo · ≤1 miLoading sold comps…