644 Fm 2679 Rd · Brenham, TX
Flood risk 1/10 · Minimal
- FEMA flood zone
- X (unshaded)
- Chance of flooding over 30 yrs
- 0.0%
- Est. flood insurance / yr
- $507 – $1,088
Fire risk 6/10 · Moderate
- Est. fire insurance / yr
- $1,222 – $2,270
Heat risk 8/10 · Major
- Hot days now (above 111°F)
- 7 days/yr
- Hot days in 30 yrs
- 23 days/yr
Wind risk 8/10 · Major
- Chance of severe wind over 30 yrs
- 99.0%
Air-quality risk 1/10 · Minimal
- Unhealthy air days now
- 0 days/yr
- Unhealthy air days in 30 yrs
- 0 days/yr
Risk factors via First Street. Map © Google.
Why this score? — see what drove the D grade
The composite is a weighted blend of 9 inputs, each scored 0–100. Each bar is that input's sub-score; the figure is the points it added to the 100-point composite (weight × sub-score).
- ARV discount +15.0/15.0
- Cash flow +9.3/30.0
- Schools +3.9/10.0
- Livability +3.8/5.0
- DSCR +2.6/10.0
- Rent growth +2.5/5.0
- Condition / age +2.5/5.0
- 1% rule +1.5/10.0
- Appreciation +0.0/10.0
$245,000
🖨 Deal sheet (PDF) 📄 Offer letter ✓ Due diligence
Listing remarks
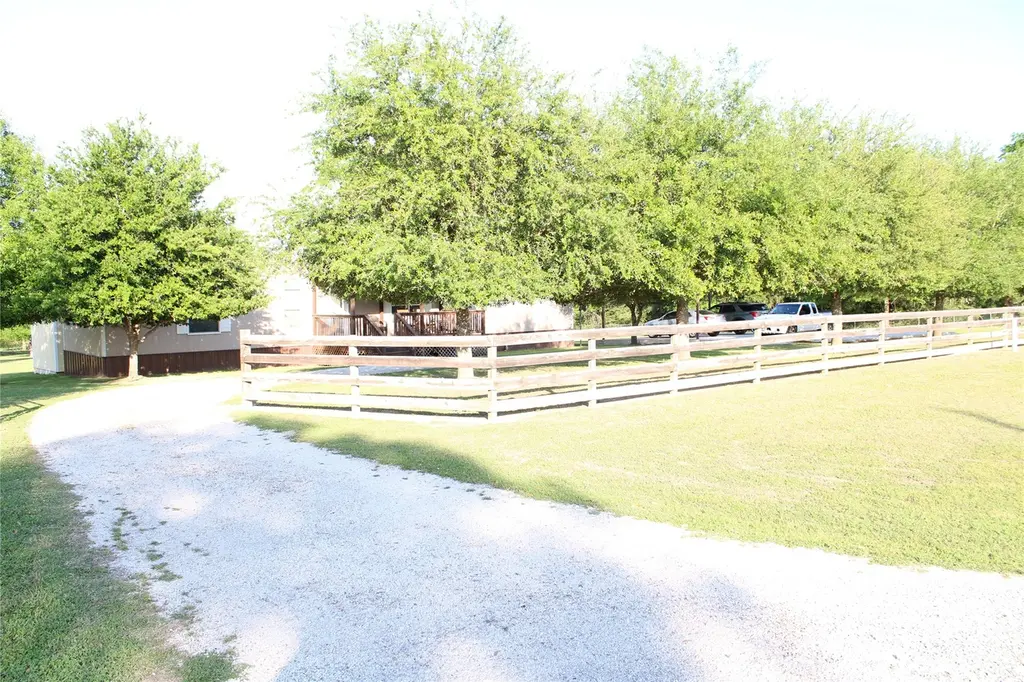
Peaceful 1.7- acre property located just ½ mile from Hwy 290 W, ideally situated between Brenham and Round Top. This 2015 manufactured home offers approximately 1,152 sq ft (per builder) with 3 bedrooms and 2 full bathrooms. The primary suite features an oversized walk-in shower and single vanity, while the guest bath includes a tub/shower combo. Full-size washer/dryer connections. Property includes a private well with community water also available. Conveniently located approximately 45 minutes from Texas A & M University in College Station. Ideal for full-time living or weekend retreat near area festivals and attractions.
Key facts
- 1.7 acre property
- Private well
- 1.74 acre lot
Tags
Property features AI
Finance
- Other: Horses allowed
Exterior
- Parking: Additional parking
- Security: Security gate; Smoke detectors
- Utilities: Public water and well; Public sewer and septic tank
- Home design: Farm property; Single-story (first level living areas)
- Construction: Vinyl siding; Block foundation; Built in 2015
- Exterior features: Fenced; Shed(s); Mobile home allowed; Cleared lot; Rolling terrain; Trees; Gravel road frontage; Publicly maintained road; Farm-to-market road access
Interior
- Kitchen: Electric cooktop; Free-standing range; Oven; Refrigerator
- Bedrooms: Primary bedroom (first level, approx. 15 x 11.7); Bedroom (first level, approx. 12.5 x 8); Bedroom (first level, approx. 9.7 x 8.6)
- Flooring: Carpet; Laminate
- Bathrooms: 2 full bathrooms
- Heating & cooling: Central heating (electric); Central air (electric)
- Interior features: Kitchen island; Kitchen/family room combo; Laminate counters; Tub with shower; Kitchen/dining combo; Living/dining room
- Laundry & utility: Washer hookup; Electric dryer hookup; Washer; Dryer
Neighborhood map
What this means for you Summary
Snapshot
- This is a 3-bed/2.0-bath manufactured listed at $245k.
Deal economics
- At list price, monthly cash flow is $-181 ($-2k/yr) — negative.
- To cash-flow at today's rent, offer at most $213k (13.1% below list).
- To meet the 1% rule (rent ≥ 1% of price), the offer needs to be $159k (35.2% below list).
- Recommended offer: $159k (35.2% below list) — sets the bar for 1% rule.
- Cap rate 5.4% vs local median 2.7% in Brenham — top-decile yield for the area; either an underpriced asset or a hidden risk that comps aren't pricing in. Stress-test before assuming the spread holds.
Location & tenants
- Location reads 75/100 on livability (#136 in TX, #3,978 nationally) — a middle-class / working-renter tenant base. Strengths: cost of living A+, housing A+, amenities A; Watch: employment C-, crime F, commute F.
- Brenham ISD (town): math 50% / reading 40% proficiency, ranked #263 of 826 in TX (top 32%) — families likely to look elsewhere, expect single-tenant / working-renter base with shorter leases.
- Zoned schools: Krause El (math 39% / reading 25%, grade F, #2,268 of 4,322 statewide, top 55%, 647 students, 70% FRL); Brenham J H (math 54% / reading 46%, grade C, #347 of 1,662 statewide, top 21%, 763 students, 54% FRL); Brenham H S (math 50% / reading 45%, grade D, #583 of 1,632 statewide, top 36%, 1,584 students, 50% FRL) — zoned schools at 58% FRL track the district average.
- Market conditions: 519 active listings in the ZIP; 111 units permitted in Washington County in 2024 (0 in 5+ unit buildings).
Forward outlook
- Local home prices are declining (-3.0%/yr); year-one equity from $2k of loan paydown is wiped out by about $7k of value loss. Plan a longer hold.
- Washington County population projected at +16% by 2050 — long-run rental-demand tailwind backs the buy-and-hold thesis.
Negotiation context
- It's been on market 63 days — a 6% lower offer ($230k) is reasonable based on typical stale-listing flexibility.
Risks & watch-outs
- Climate carrying-cost: severe wind risk, 99% chance of damaging wind over 30y; major wildfire risk; extreme-heat days projected 7→23/yr by 2055 (HVAC capex compounding) — expect insurance premiums to compound above CPI over the hold.
Questions for the listing agent
- What do current leases actually rent for vs. the listed asking? Can we see a recent rent roll and the last 12 months of T-12 income?
- It's been on market 63 days. Have you received any prior offers? Is the seller open to a 35% concession, seller financing, or rate buy-down credit?
- Why hasn't it sold? Are there any deal-killer items the seller is aware of (foundation, flood, title, zoning, code violations)?
- Is there a deadline driving the sale (1031 exchange, divorce, estate, relocation)? That informs how much negotiation room exists.
- Crime grade is F in this area — have there been break-ins, vandalism, or insurance claims at this property in the last 3 years? What carrier currently insures it and at what premium?
- The area grade is low — what's the realistic commute time and amenity access for the typical tenant pool here? Any planned neighborhood developments (good or bad) we should know about?
- What's the average days-on-market for RENTAL listings here right now (not sales)? A rising rental-DOM trend means longer vacancies and softer asking-rent achievability than the comps imply.
- What's the recent tenant-quality profile in this submarket — average credit score on applications, eviction rate, late-payment / NSF rate, and stable-employment percentage? A property-management company in the area should have these aggregated.
- How much new for-sale + rental construction is in the pipeline within 1–3 miles? Heavy new supply typically softens prices + rents 12–24 months out; constrained supply supports both.
Investment metrics
- 1% rule
- 0.65% ✗
- Cap rate
- 5.40%
- Cash-on-cash
- -3.17%
- DSCR
- 0.86
- GRM
- 12.9
CMA / ARV
- ARV (median comp)
- $365,950
- List price
- $245,000
- Delta
- -33.05%
- Verdict
- UNDERPRICED
- Comps
- 1 within 2.0 mi
Projected returns pro-forma
-3.0% appreciation · 3.0% rent growth · sell at horizon
- IRR
- -21.7%
- Equity multiple
- 0.25×
- Total profit
- $-51,389
- Equity at exit
- $36,530
- IRR
- -15.6%
- Equity multiple
- 0.12×
- Total profit
- $-60,174
- Equity at exit
- $21,183
Cash invested: $68,600 (down + closing). Projections, not guarantees.
Landlord ↔ Tenant lean methodology
- Overall (STATE)
- 87 Strongly Landlord-Friendly
- State Texas
- 87 Strongly Landlord-Friendly · R+5
- County
- — inherits STATE
- City
- — inherits STATE
ZIP-level market 77833
- Active inventory
- 519
- Price-to-rent
- 12.9×
Monthly cashflow live
- Estimated rent
- $1,587 medium interval (Pro) →
- Mortgage (P&I)
- −$1,285
- Tax from tax record
- −$48 /mo · $578/yr
- Insurance
- −$102
- HOA
- −$0
- Vacancy / Maint / Mgmt
- −$333
- Net cashflow
- $-181
Break-even live
Sensitivity live
| Price | -10% $-43 | -5% $-112 | +0% $-181 | +5% $-251 | +10% $-320 |
|---|---|---|---|---|---|
| Rent | -10% $-307 | -5% $-244 | +0% $-181 | +5% $-119 | +10% $-56 |
| Rate | -1.0pp $-58 | -0.5pp $-119 | base $-181 | +0.5pp $-245 | +1.0pp $-309 |
UW: 25.0% down · 7.5% · 30yr · 1.5% tax · 5.0% vac · 8.0% maint · 8.0% mgmt
Financing live
Cash to close
- Down payment
- $61,250
- Closing costs
- $7,350
- Reserves months
- —
- Total cash needed
- —
Loan-product check · same deal, 3 products live
Conventional
25% down · 7.5% · 30yr
- Down + closing
- —
- Monthly P&I
- —
- Monthly cashflow
- —
- DSCR
- —
- Eligible?
- —
Personal DTI + credit; lowest rate.
DSCR
20% down · 8.5% · 30yr
- Down + closing
- —
- Monthly P&I
- —
- Monthly cashflow
- —
- DSCR
- —
- Eligible?
- —
No personal income docs; deal must DSCR.
Hard money
10% down · 12.0% · 12mo
- Down + closing
- —
- Monthly P&I
- —
- Monthly cashflow
- —
- DSCR
- —
- Eligible?
- —
Short-term bridge; refi at stabilization.
Listing history 19 events
-
2026-06-22days on market $245,000 Active 63 DOM
-
2026-06-21days on market $245,000 Active 62 DOM
-
2026-06-19days on market $245,000 Active 60 DOM
-
2026-06-18days on market $245,000 Active 59 DOM
-
2026-06-17days on market $245,000 Active 58 DOM
-
2026-06-16days on market $245,000 Active 57 DOM
-
2026-06-15days on market $245,000 Active 56 DOM
-
2026-06-14days on market $245,000 Active 54 DOM
-
2026-06-12days on market $245,000 Active 53 DOM
-
2026-06-09days on market $245,000 Active 50 DOM
-
2026-06-08days on market $245,000 Active 49 DOM
-
2026-06-07days on market $245,000 Active 48 DOM
-
2026-06-03price $245,000 Active 43 DOM
-
2026-06-02days on market $259,500 Active 43 DOM
-
2026-06-01days on market $259,500 Active 42 DOM
-
2026-05-31days on market $259,500 Active 41 DOM
-
2026-05-30days on market $259,500 Active 40 DOM
-
2026-05-18price $259,500 640-char remark
-
2026-04-20$265,900 Active 640-char remark
ⓘ Source: listings_history table (triggers on properties + properties_extension) + one-shot
backfill from property_details.listing_events for pre-trigger history.
Tax reassessment forecast TX · Resets to sale price
- Current annual tax
- $578 · $48/mo
- Projected year-2 tax
- $4,484 · $374/mo
- Expected delta
- +$3,905/yr (+$325/mo · 675.2%)
ⓘ Screening estimate from a state-policy table — verify with the county assessor before closing.
Climate risk First Street
- Flood 1/10 Low FEMA zone X (unshaded) · 0% chance over 30 yrs
- Wildfire 6/10 Major
- Heat 8/10 Severe 7 d/yr ≥111°F today · 23 d/yr by 30 yrs out
- Wind 8/10 Severe 99% chance of damaging wind over 30 yrs
- Air quality 1/10 Low 0 unhealthy d/yr today · 0 by 30 yrs out
Nearby sold comps map
Loading sold comps map…
Walkable amenities ~0.75 mi
Loading nearby amenities…
Taxation est. · year 1
- Rental income
- $19,043
- − Mortgage interest
- −$13,724
- − Property taxes
- −$578
- − Insurance
- −$1,225
- − Repairs & maintenance
- −$1,523
- − Management
- −$1,523
- − Depreciation
- −$7,127
- Taxable loss
- −$6,658
- Est. tax savings @ 24.0%
- +$1,598
- After-tax cash flow
- $-579/yr
For passive investors: Depreciation is non-cash, so a rental often shows a tax loss while cash-flowing — sheltering income. Rental losses are passive: they offset passive income freely, and up to $25,000/yr can offset ordinary (W-2) income if you actively participate and your MAGI is under $100k (phasing out to $0 by $150k); unused losses carry forward. On sale, claimed depreciation is recaptured at up to 25%, and gains may owe capital-gains tax (a 1031 exchange can defer both). Figures are a year-1 estimate at your 24.0% rate — not tax advice; consult a CPA.
Schools (NCES district)
- District
- Brenham ISD
- NCES district ID
- 4811280
- Math proficiency
- 50% ▼ -4.00%
- Reading proficiency
- 40% ▼ -4.00%
- Median HH income
- $48,090
- Composite
- 38.51/100
- National rank
- #4177
- State rank
- #263 of 826 in TX
Livability — Brenham
- Score
- 75/100
- State rank
- #136
- US rank
- #3978
Category grades
Schools grade is shown separately in the Schools card above.
Census & demographics
- County
- Washington County · 29,498 people
- City population
- 29,498
- Metro
- Brenham, TX
- Population (ZIP)
- 29,498
- Household income
- $73,388
- Rent vs Own
- Severe rent burden
- 614.0
Population outlook (Washington County) Hauer SSP2
- Today (2025)
- 37,557 people
- By 2030
- 38,789 · +3.3%
- By 2040
- 41,305 · +10.0%
- By 2050
- 43,687 · +16.3%
- By 2075
- 50,242 · +33.8%
- By 2100
- 53,235 · +41.7%
Race, ethnicity, and origin ACS 2023
- Neighborhood character
- Diverse neighborhood (Simpson 0.59)
- Race & ethnicity
- White 59% Hispanic / Latino 20% Black 16% Two or more races 12% Asian 2%
- Hispanic origin (detail)
- Mexican 18%
- Common ancestry
- Romanian 2% Lithuanian 2% Slovak 1%
- Foreign-born
- 7% · Canada, South Korea
- Languages at home
- 85% English-only · Spanish 12% Tagalog/Filipino 1% Russian/Polish/Slavic 1%
Political lean MEDSL · Washington
- 2024 margin
- Solid R (+54.7) · D 22.3% · R 77.0%
- 2008→2024 swing
- -12.0pp toward R · 2008: -42.7pp · 2024: -54.7pp
- All cycles
- 2024: R+54.7 2020: R+49.9 2016: R+51.3 2012: R+52.0 2008: R+42.7
Not yet ingested
- Civics
- —
Market trends
- HPI YoY
- ▼ -107.24%
- Current HPI
- 192.9078
- Rent YoY
- —
- Metro
- Brenham, TX
- State GDP YoY
- ▲ 3.95%
- F500 in state
- 110
Industry mix (Fortune 500 HQ in TX)
| Industry | F500 HQs | Revenue |
|---|---|---|
| Energy | 16 | $1,198B |
|
||
| Technology | 5 | $198B |
|
||
| Engineering / Construction | 4 | $72B |
|
||
| Energy Services | 3 | $60B |
|
||
| Utilities | 3 | $41B |
|
||
| Healthcare | 2 | $330B |
|
||
Price history
-7.9% since first listed3 events — show timeline
- 2026-06-02 Price Changed $245,000 HARMLS
- 2026-05-18 Price Changed $259,500 HARMLS
- 2026-04-20 Listed $265,900 HARMLS
Property tax history
-3.6%/yrLatest (2025): $578 · +2.0% YoY. Source: county tax records.
Cash-flow waterfall
monthlySold comps — $/sqft
last 12 mo · ≤1 miLoading sold comps…