6160 E 116th St · Carmel, IN
Flood risk 9/10 · Severe
- FEMA flood zone
- AE
- Chance of flooding over 30 yrs
- 0.99%
- Est. flood insurance / yr
- $1,737 – $8,500
Fire risk 1/10 · Minimal
- Est. fire insurance / yr
- $717 – $1,331
Heat risk 3/10 · Minor
- Hot days now (above 101°F)
- 7 days/yr
- Hot days in 30 yrs
- 18 days/yr
Wind risk 2/10 · Minimal
- Chance of severe wind over 30 yrs
- 1.0%
Air-quality risk 4/10 · Minor
- Unhealthy air days now
- 3 days/yr
- Unhealthy air days in 30 yrs
- 5 days/yr
Risk factors via First Street. Map © Google.
Why this score? — see what drove the B+ grade
The composite is a weighted blend of 9 inputs, each scored 0–100. Each bar is that input's sub-score; the figure is the points it added to the 100-point composite (weight × sub-score).
- Cash flow +30.0/30.0
- ARV discount +15.0/15.0
- 1% rule +10.0/10.0
- DSCR +10.0/10.0
- Schools +5.3/10.0
- Livability +4.2/5.0
- Rent growth +2.8/5.0
- Condition / age +2.5/5.0
- Appreciation +0.0/10.0
$275,500
🖨 Deal sheet (PDF) 📄 Offer letter ✓ Due diligence
Listing remarks MLS
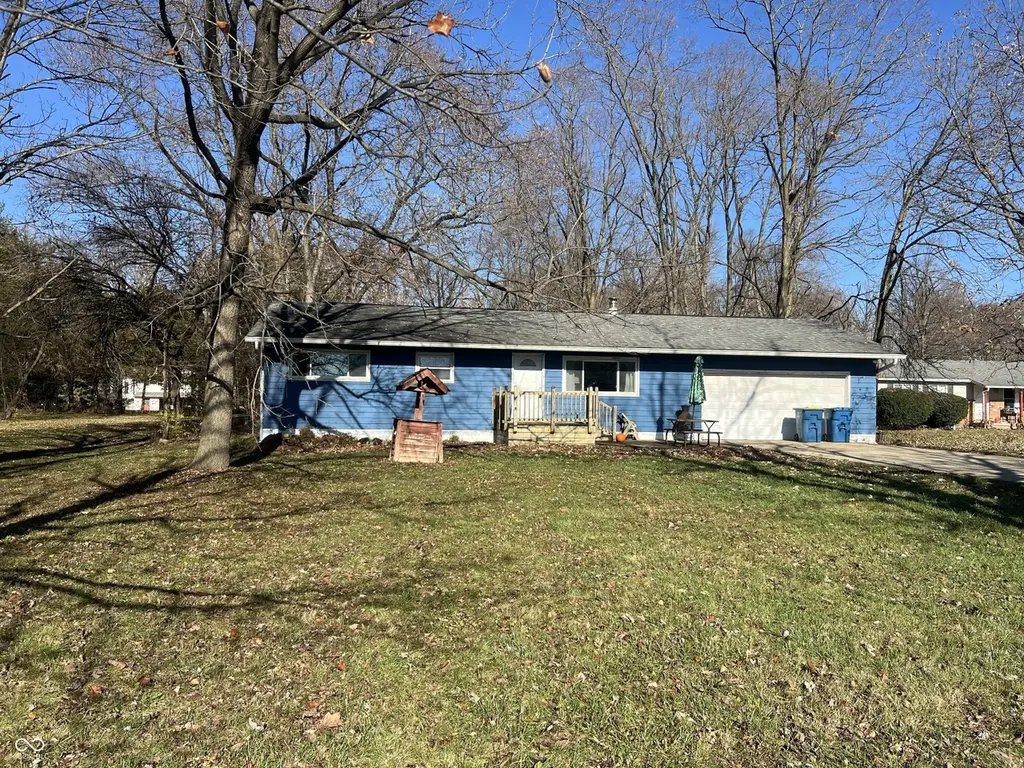
Here is your chance to live in the heart of Fishers with NO HOA!! So many possibilities with this 3 bedroom ranch that is situated on over a half acre lot! Brand new A/C and furnace! Big ticket items are done! Great opportunity to add your finishing touches and make it your own!
Key facts
- Large eat in kitchen
- Great location
- Inviting living room
Tags
Neighborhood map
What this means for you Summary
Snapshot
- This is a 3-bed/1.5-bath single-family listed at $276k.
Deal economics
- At list price, monthly cash flow is $2k ($21k/yr) — positive.
- The deal already cash-flows at list — no discount required.
- Meets the 1% rule at list price ($5k rent vs $276k).
- Recommended offer: $242k (12.0% below list) — sets the bar for market timing.
- Cap rate 15.8% vs local median 2.7% in Carmel — top-decile yield for the area; either an underpriced asset or a hidden risk that comps aren't pricing in. Stress-test before assuming the spread holds.
Location & tenants
- Location reads 84/100 on livability (#7 in IN, #726 nationally) — a professional / high-income tenant draw. Strengths: crime A+, amenities A+, employment A+; Watch: commute F.
- Hamilton Southeastern Schools (suburban): math 57% / reading 59% proficiency, ranked #14 of 301 in IN (top 5%) — acceptable for families but not a draw, mixed tenant base, ~2y average lease; only 10% free/reduced lunch — higher-income household profile.
- Zoned schools: New Britton Elementary School (math 70% / reading 59%, grade B, #78 of 994 statewide, top 9%, 624 students, 27% FRL); Riverside Junior High (math 42% / reading 56%, grade C-, #53 of 330 statewide, top 16%, 895 students, 25% FRL); Fishers High School (math 64% / reading 82%, grade B+, #8 of 369 statewide, top 2%, 3,674 students, 22% FRL).
- Market conditions: Rents rising (+1.3%/yr); 248 active listings in the ZIP; 3 comparable units currently listed for rent nearby; rentals at typical pace (median 17d on market — plan ~3-4 weeks tenant-placement turnaround); solid renter incomes; 4,661 units permitted in Hamilton County in 2024 (1,528 in 5+ unit buildings).
Forward outlook
- Local home prices are declining (-3.0%/yr); year-one equity from $2k of loan paydown is wiped out by about $8k of value loss. Plan a longer hold.
- Hamilton County population projected at +44% by 2050 — long-run rental-demand tailwind backs the buy-and-hold thesis.
- At projected returns (-3.0% appreciation + 1.3% rent growth), your $77k cash investment doubles in ~5 years — after that, you're playing with house money.
Negotiation context
- It's been on market 136 days — a 12% lower offer ($242k) is reasonable based on typical stale-listing flexibility.
- 9 sale attempts since 25y ago; this cycle's ask has dropped $24k (8%) from the opening price — seller is motivated, your offer sets the floor, not the list.
- Current owner paid $95k; list at $276k implies a 190% gain — meaningful room to come down on a strong offer.
Risks & watch-outs
- Watch-outs: flood insurance adds $427/mo.
- Climate carrying-cost: in FEMA flood zone AE (mandatory federal flood insurance) — expect insurance premiums to compound above CPI over the hold.
Questions for the listing agent
- It's been on market 136 days. Have you received any prior offers? Is the seller open to a 12% concession, seller financing, or rate buy-down credit?
- Built in 1960 — when were the roof, HVAC, electrical panel, plumbing, and water heater last replaced?
- What's the actual annual flood-insurance premium (NFIP or private), and is the property in a SFHA with mandatory coverage?
- Why hasn't it sold? Are there any deal-killer items the seller is aware of (foundation, flood, title, zoning, code violations)?
- Is there a deadline driving the sale (1031 exchange, divorce, estate, relocation)? That informs how much negotiation room exists.
- Schools are A-rated — typically a magnet for longer-tenancy family renters. What's the average tenant stay here, and is there a school-zone premium baked into asking?
- What's the average days-on-market for RENTAL listings here right now (not sales)? A rising rental-DOM trend means longer vacancies and softer asking-rent achievability than the comps imply.
- What's the recent tenant-quality profile in this submarket — average credit score on applications, eviction rate, late-payment / NSF rate, and stable-employment percentage? A property-management company in the area should have these aggregated.
- How much new for-sale + rental construction is in the pipeline within 1–3 miles? Heavy new supply typically softens prices + rents 12–24 months out; constrained supply supports both.
Investment metrics
- 1% rule
- 1.76% ✓
- Cap rate
- 15.80%
- Cash-on-cash
- 33.94%
- DSCR
- 2.51
- GRM
- 4.7
CMA / ARV
- ARV (median comp)
- $341,631
- List price
- $275,500
- Delta
- -19.36%
- Verdict
- UNDERPRICED
- Comps
- 20 within 1.0 mi
Show comp detail 8 sales within ~0.75 mi
| Address | Dist | Beds/Ba | Sqft | Sold | Price | $/sf | Match |
|---|---|---|---|---|---|---|---|
| 6811 Wild Cherry Dr | 0.67mi | 3/2.0 | 1,229 (+12%) | 3mo | $310,000 | $252 | 43 |
| 6751 Wild Cherry Dr | 0.60mi | 3/2.0 | 1,200 (+10%) | 14mo | $282,500 | $235 | 42 |
| 6838 Cherry Laurel Ln | 0.69mi | 3/2.0 | 1,200 (+10%) | 10mo | $316,000 | $263 | 41 |
| 11560 Cherry Blossom West Dr | 0.57mi | 3/2.0 | 1,200 (+10%) | 17mo | $298,500 | $249 | 41 |
| 11518 Cherry Blossom Dr W | 0.56mi | 3/2.0 | 1,253 (+15%) | 11mo | $320,000 | $255 | 38 |
| 11462 Cherry Blossom Dr W | 0.57mi | 3/2.0 | 1,214 (+11%) | 24mo | $325,000 | $268 | 33 |
| 6890 Wild Cherry Dr | 0.73mi | 3/2.0 | 1,200 (+10%) | 24mo | $289,900 | $242 | 28 |
| 6892 Cherry Blossom E Dr E | 0.73mi | 3/2.0 | 1,244 (+14%) | 20mo | $310,000 | $249 | 24 |
Match score weights: distance 35% · size 25% · config 20% · recency 20%. Top-matched comps best support the ARV.
Projected returns pro-forma
-3.0% appreciation · 1.27% rent growth · sell at horizon
- IRR
- 19.3%
- Equity multiple
- 1.77×
- Total profit
- $59,049
- Equity at exit
- $41,078
- IRR
- 26.3%
- Equity multiple
- 3.12×
- Total profit
- $163,232
- Equity at exit
- $23,820
Cash invested: $77,140 (down + closing). Projections, not guarantees.
Landlord ↔ Tenant lean methodology
- Overall (STATE)
- 90 Strongly Landlord-Friendly
- State Indiana
- 90 Strongly Landlord-Friendly · R+11
- County
- — inherits STATE
- City
- — inherits STATE
ZIP-level market 46038
- Home prices YoY
- -14.2%
- Rents YoY
- 1.3%
- Active inventory
- 248
- Price-to-rent
- 4.7×
Monthly cashflow live
- Estimated rent
- $4,849 medium interval (Pro) →
- Mortgage (P&I)
- −$1,445
- Tax from tax record
- −$89 /mo · $1,071/yr
- Insurance
- −$115
- Flood insurance flood zone
- −$427 /mo · $5,118/yr
- HOA
- −$0
- Vacancy / Maint / Mgmt
- −$1,018
- Net cashflow
- $1,756
Break-even live
Sensitivity live
| Price | -10% $1,911 | -5% $1,834 | +0% $1,756 | +5% $1,678 | +10% $1,600 |
|---|---|---|---|---|---|
| Rent | -10% $1,372 | -5% $1,564 | +0% $1,756 | +5% $1,947 | +10% $2,139 |
| Rate | -1.0pp $1,894 | -0.5pp $1,826 | base $1,756 | +0.5pp $1,684 | +1.0pp $1,612 |
UW: 25.0% down · 7.5% · 30yr · 1.5% tax · 5.0% vac · 8.0% maint · 8.0% mgmt
Financing live
Cash to close
- Down payment
- $68,875
- Closing costs
- $8,265
- Reserves months
- —
- Total cash needed
- —
Loan-product check · same deal, 3 products live
Conventional
25% down · 7.5% · 30yr
- Down + closing
- —
- Monthly P&I
- —
- Monthly cashflow
- —
- DSCR
- —
- Eligible?
- —
Personal DTI + credit; lowest rate.
DSCR
20% down · 8.5% · 30yr
- Down + closing
- —
- Monthly P&I
- —
- Monthly cashflow
- —
- DSCR
- —
- Eligible?
- —
No personal income docs; deal must DSCR.
Hard money
10% down · 12.0% · 12mo
- Down + closing
- —
- Monthly P&I
- —
- Monthly cashflow
- —
- DSCR
- —
- Eligible?
- —
Short-term bridge; refi at stabilization.
Rent comps 3 comps
| Address | Beds | Baths | Sqft | Rent | $/sqft | DOM | Units | Dist |
|---|---|---|---|---|---|---|---|---|
| 6220 Wahpihani Dr Unit 1536667P Fishers, IN | 2.0 | 2.0 | 1496 | $7,340 | $4.91 | 16d | 1 | 0.11mi |
| 11389 Songbird Ln Fishers, IN | 3.0 | 2.0 | 1212 | $2,200 | $1.82 | 45d | 1 | 0.57mi |
| 10190 Allisonville Rd Fishers, IN | 1.0–2.0 | 1.0–2.0 | 903 | $1,379 | $1.53 | 0d | 46 | 1.44mi |
Listing history 33 events
-
2026-06-21days on market $275,500 Active 136 DOM
-
2026-06-18days on market $275,500 Active 133 DOM
-
2026-06-17days on market $275,500 Active 132 DOM
-
2026-06-16days on market $275,500 Active 131 DOM
-
2026-06-15days on market $275,500 Active 130 DOM
-
2026-06-13days on market $275,500 Active 128 DOM
-
2026-06-09days on market $275,500 Active 124 DOM
-
2026-06-08pricedays on market $275,500 Active 123 DOM
-
2026-06-07days on market $299,900 Active 122 DOM
-
2026-06-03days on market $299,900 Active 118 DOM
-
2026-06-02days on market $299,900 Active 117 DOM
-
2026-06-01days on market $299,900 Active 116 DOM
-
2026-05-31days on market $299,900 Active 115 DOM
-
2026-04-25status Active 279-char remark
Show marketing remark (279 chars)
Here is your chance to live in the heart of Fishers with NO HOA!! So many possibilities with this 3 bedroom ranch that is situated on over a half acre lot! Brand new A/C and furnace! Big ticket items are done! Great opportunity to add your finishing touches and make it your own!
-
2026-04-24historical 279-char remark
Show marketing remark (279 chars)
Here is your chance to live in the heart of Fishers with NO HOA!! So many possibilities with this 3 bedroom ranch that is situated on over a half acre lot! Brand new A/C and furnace! Big ticket items are done! Great opportunity to add your finishing touches and make it your own!
-
2026-04-21status Active 279-char remark
Show marketing remark (279 chars)
Here is your chance to live in the heart of Fishers with NO HOA!! So many possibilities with this 3 bedroom ranch that is situated on over a half acre lot! Brand new A/C and furnace! Big ticket items are done! Great opportunity to add your finishing touches and make it your own!
-
2026-04-18historical 279-char remark
Show marketing remark (279 chars)
Here is your chance to live in the heart of Fishers with NO HOA!! So many possibilities with this 3 bedroom ranch that is situated on over a half acre lot! Brand new A/C and furnace! Big ticket items are done! Great opportunity to add your finishing touches and make it your own!
-
2026-04-17status Active 279-char remark
Show marketing remark (279 chars)
Here is your chance to live in the heart of Fishers with NO HOA!! So many possibilities with this 3 bedroom ranch that is situated on over a half acre lot! Brand new A/C and furnace! Big ticket items are done! Great opportunity to add your finishing touches and make it your own!
-
2026-02-06historical 279-char remark
Show marketing remark (279 chars)
Here is your chance to live in the heart of Fishers with NO HOA!! So many possibilities with this 3 bedroom ranch that is situated on over a half acre lot! Brand new A/C and furnace! Big ticket items are done! Great opportunity to add your finishing touches and make it your own!
-
2025-11-24$299,900 Active 279-char remark
Show marketing remark (279 chars)
Here is your chance to live in the heart of Fishers with NO HOA!! So many possibilities with this 3 bedroom ranch that is situated on over a half acre lot! Brand new A/C and furnace! Big ticket items are done! Great opportunity to add your finishing touches and make it your own!
-
2016-07-29soldstatus $95,000 Sold 206-char remark
Show marketing remark (206 chars)
Great opportunity for quick equity or return on your investment. All the tough stuff has been taken care of already. Newer roof, A/C, furnace & windows. Ready for your final touches to make it your own!
-
2016-04-05price $91,000 206-char remark
Show marketing remark (206 chars)
Great opportunity for quick equity or return on your investment. All the tough stuff has been taken care of already. Newer roof, A/C, furnace & windows. Ready for your final touches to make it your own!
-
2015-10-23status Pending 206-char remark
Show marketing remark (206 chars)
Great opportunity for quick equity or return on your investment. All the tough stuff has been taken care of already. Newer roof, A/C, furnace & windows. Ready for your final touches to make it your own!
-
2015-09-25price $99,500 206-char remark
Show marketing remark (206 chars)
Great opportunity for quick equity or return on your investment. All the tough stuff has been taken care of already. Newer roof, A/C, furnace & windows. Ready for your final touches to make it your own!
-
2015-06-12$105,000 Active 206-char remark
Show marketing remark (206 chars)
Great opportunity for quick equity or return on your investment. All the tough stuff has been taken care of already. Newer roof, A/C, furnace & windows. Ready for your final touches to make it your own!
-
2006-08-31soldstatus $104,000
-
2006-04-30$107,900
-
2004-06-15historical
-
2003-12-19$109,900
-
2002-01-04soldstatus $83,000
-
2001-09-12$86,900
-
2001-07-29historical
-
2001-01-31$94,900
ⓘ Source: listings_history table (triggers on properties + properties_extension) + one-shot
backfill from property_details.listing_events for pre-trigger history.
Tax reassessment forecast IN · Partial reset (capped growth)
- Current annual tax
- $1,071 · $89/mo
- Projected year-2 tax
- $1,706 · $142/mo
- Expected delta
- +$635/yr (+$53/mo · 59.3%)
ⓘ Screening estimate from a state-policy table — verify with the county assessor before closing.
Climate risk First Street
- Flood 9/10 Extreme FEMA zone AE · 99% chance over 30 yrs
- Wildfire 1/10 Low
- Heat 3/10 Moderate 7 d/yr ≥101°F today · 18 d/yr by 30 yrs out
- Wind 2/10 Low 100% chance of damaging wind over 30 yrs
- Air quality 4/10 Moderate 3 unhealthy d/yr today · 5 by 30 yrs out
Nearby sold comps map
Loading sold comps map…
Walkable amenities ~0.75 mi
Loading nearby amenities…
Taxation est. · year 1
- Rental income
- $58,190
- − Mortgage interest
- −$15,432
- − Property taxes
- −$1,071
- − Insurance
- −$6,496
- − Repairs & maintenance
- −$4,655
- − Management
- −$4,655
- − Depreciation
- −$8,015
- Taxable income
- $17,866
- Est. tax owed @ 24.0%
- −$4,288
- After-tax cash flow
- $16,779/yr
For passive investors: Depreciation is non-cash, so a rental often shows a tax loss while cash-flowing — sheltering income. Rental losses are passive: they offset passive income freely, and up to $25,000/yr can offset ordinary (W-2) income if you actively participate and your MAGI is under $100k (phasing out to $0 by $150k); unused losses carry forward. On sale, claimed depreciation is recaptured at up to 25%, and gains may owe capital-gains tax (a 1031 exchange can defer both). Figures are a year-1 estimate at your 24.0% rate — not tax advice; consult a CPA.
Schools (NCES district)
- District
- Hamilton Southeastern Schools
- NCES district ID
- 1810650
- Math proficiency
- 57% ▼ -11.00%
- Reading proficiency
- 59% ▼ -7.00%
- Median HH income
- $87,726
- Composite
- 53.02/100
- National rank
- #1520
- State rank
- #14 of 301 in IN
Livability — Carmel
- Score
- 84/100
- State rank
- #7
- US rank
- #726
Category grades
Schools grade is shown separately in the Schools card above.
Census & demographics
- County
- Hamilton County · 337,479 people
- City population
- 99,910
- Metro
- Indianapolis-Carmel-Anderson, IN
- Population (ZIP)
- 43,754
- Household income
- $106,886
- Rent vs Own
- Severe rent burden
- 925.0
Population outlook (Hamilton County) Hauer SSP2
- Today (2025)
- 381,938 people
- By 2030
- 417,496 · +9.3%
- By 2040
- 486,684 · +27.4%
- By 2050
- 549,805 · +44.0%
- By 2075
- 687,078 · +79.9%
- By 2100
- 754,495 · +97.5%
Race, ethnicity, and origin ACS 2023
- Neighborhood character
- Predominantly White (79%)
- Race & ethnicity
- White 79% Asian 6% Black 6% Two or more races 5% Hispanic / Latino 4%
- Common ancestry
- Romanian 3% Italian 2% Lithuanian 2%
- Foreign-born
- 10% · Canada, China, South Korea
- Languages at home
- 88% English-only · Other Indo-European 3% Spanish 3% Arabic 2%
Political lean MEDSL · Hamilton
- 2024 margin
- Lean R (+6.1) · D 46.0% · R 52.1% · Other 1.9%
- 2008→2024 swing
- +16.2pp toward D · 2008: -22.2pp · 2024: -6.1pp
- All cycles
- 2024: R+6.1 2020: R+6.8 2016: R+19.6 2012: R+34.3 2008: R+22.2
Not yet ingested
- Civics
- —
Market trends
- HPI YoY
- ▼ -39.52%
- Current HPI
- 238.7602
- Rent YoY
- ▲ 1.27%
- Metro
- Indianapolis-Carmel-Anderson, IN
- State GDP YoY
- ▲ 2.90%
- F500 in state
- 18
Industry mix (Fortune 500 HQ in IN)
| Industry | F500 HQs | Revenue |
|---|---|---|
| Industrial Machinery | 2 | $37B |
|
||
| Healthcare | 1 | $177B |
|
||
| Pharmaceuticals | 1 | $45B |
|
||
| Metals / Steel | 1 | $18B |
|
||
| Agriculture | 1 | $17B |
|
||
| Packaging | 1 | $12B |
|
||
Price history
+216.0% since first listed20 events — show timeline
- 2026-04-25 Relisted — MIBOR as Distributed by MLS Grid
- 2026-04-24 Listing Removed — MIBOR as Distributed by MLS Grid
- 2026-04-21 Relisted — MIBOR as Distributed by MLS Grid
- 2026-04-18 Listing Removed — MIBOR as Distributed by MLS Grid
- 2026-04-17 Relisted — MIBOR as Distributed by MLS Grid
- 2026-02-06 Listing Removed — MIBOR as Distributed by MLS Grid
- 2025-11-24 Listed $299,900 MIBOR as Distributed by MLS Grid
- 2016-07-29 Sold (MLS) $95,000 MIBOR as Distributed by MLS Grid
- 2016-04-05 Price Changed $91,000 MIBOR as Distributed by MLS Grid
- 2015-10-23 Pending — MIBOR as Distributed by MLS Grid
- 2015-09-25 Price Changed $99,500 MIBOR as Distributed by MLS Grid
- 2015-06-12 Listed $105,000 MIBOR as Distributed by MLS Grid
- 2006-08-31 Sold (MLS) $104,000 MIBOR as Distributed by MLS Grid
- 2006-04-30 Listed $107,900 MIBOR as Distributed by MLS Grid
- 2004-06-15 Listing Removed — MIBOR as Distributed by MLS Grid
- 2003-12-19 Listed $109,900 MIBOR as Distributed by MLS Grid
- 2002-01-04 Sold (MLS) $83,000 MIBOR as Distributed by MLS Grid
- 2001-09-12 Listed $86,900 MIBOR as Distributed by MLS Grid
- 2001-07-29 Listing Removed — MIBOR as Distributed by MLS Grid
- 2001-01-31 Listed $94,900 MIBOR as Distributed by MLS Grid
Property tax history
+4.7%/yrLatest (2025): $1,071 · -8.5% YoY. Source: county tax records.
Cash-flow waterfall
monthlySold comps — $/sqft
last 12 mo · ≤1 miLoading sold comps…