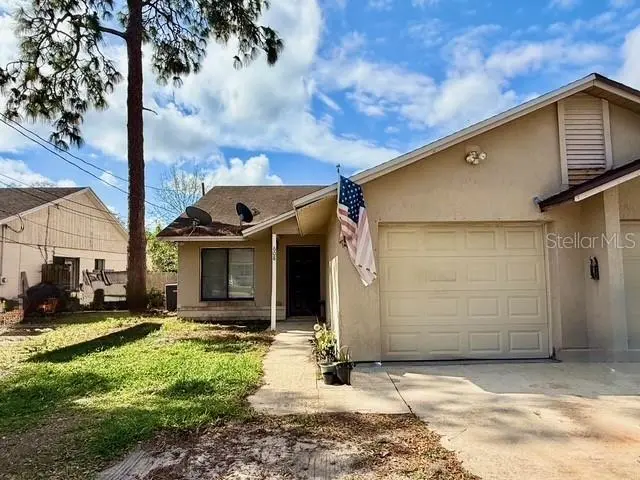
608 E Warren Ave · Longwood, FL
Flood risk 1/10 · Minimal
- FEMA flood zone
- X (unshaded)
- Chance of flooding over 30 yrs
- 0.0%
- Est. flood insurance / yr
- $507 – $1,088
Fire risk 3/10 · Minor
- Est. fire insurance / yr
- $947 – $1,759
Heat risk 8/10 · Major
- Hot days now (above 108°F)
- 7 days/yr
- Hot days in 30 yrs
- 22 days/yr
Wind risk 9/10 · Severe
- Chance of severe wind over 30 yrs
- 99.0%
Air-quality risk 2/10 · Minimal
- Unhealthy air days now
- 1 days/yr
- Unhealthy air days in 30 yrs
- 2 days/yr
Risk factors via First Street. Map © Google.
Why this score? — see what drove the D+ grade
The composite is a weighted blend of 9 inputs, each scored 0–100. Each bar is that input's sub-score; the figure is the points it added to the 100-point composite (weight × sub-score).
- ARV discount +15.0/15.0
- Cash flow +12.4/30.0
- Schools +5.1/10.0
- Livability +4.0/5.0
- DSCR +3.7/10.0
- Rent growth +3.5/5.0
- 1% rule +3.0/10.0
- Condition / age +2.5/5.0
- Appreciation +0.0/10.0
$240,000
🖨 Deal sheet (PDF) 📄 Offer letter ✓ Due diligence
Listing remarks MLS
Great location close to everything Seminole county has to offer. This 2 bedroom 2 bath duplex has a attached garage and it's own back yard!HUD PROPERTY SOLD "AS-IS". INFORMATION FROM SOURCES DEEMED TO BE RELIABLE, BUT NOT GUARANTEED. BUYER TO VERIFY ALL INFORMATION. HUD PROPERTY CASE- 094-329080
Key facts
- Private backyard
- No hoa
- Garage
Tags
Property features AI
Finance
- Other: Unfurnished; Unit 1 of multi-unit property
- Financial info: No lease restrictions
- HOA & community: No HOA; Pets allowed; Full-time on-site management
Exterior
- Parking: Driveway; Attached garage (1 car)
- Security: Smoke detector(s)
- Utilities: Public water; Public sewer; Electricity available; Phone available; Broadband/high-speed internet available
- Home design: Residential half duplex; One story; Faces north
- Construction: Block construction; Shingle roof; Slab foundation; Built on one level
- Exterior features: Patio; Exterior lighting; Sidewalk; Sliding doors
Interior
- Kitchen: Dishwasher; Range; Range hood; Refrigerator; Electric water heater
- Bedrooms: 2 bedrooms
- Flooring: Carpet; Tile
- Bathrooms: 2 full bathrooms
- Heating & cooling: Central heating (electric); Central air conditioning
- Interior features: Ceiling fans; Eat-in kitchen; Living room/dining room combo; Thermostat; Blinds; Smoke detector(s)
- Laundry & utility: Washer hookup; Electric dryer hookup; Laundry in garage
Neighborhood map
What this means for you Summary
Snapshot
- This is a 2-bed/2.0-bath single-family listed at $240k.
Deal economics
- At list price, monthly cash flow is $-41 ($-490/yr) — negative.
- To cash-flow at today's rent, offer at most $233k (3.0% below list).
- To meet the 1% rule (rent ≥ 1% of price), the offer needs to be $193k (19.7% below list).
- Recommended offer: $193k (19.7% below list) — sets the bar for 1% rule.
- Cap rate 6.1% vs local median 4.0% in Longwood — top-decile yield for the area; either an underpriced asset or a hidden risk that comps aren't pricing in. Stress-test before assuming the spread holds.
Location & tenants
- Location reads 81/100 on livability (#92 in FL, #1,438 nationally) — a professional / high-income tenant draw. Strengths: housing A+, health & safety A+, cost of living B+; Watch: amenities F.
- Seminole (suburban): math 57% / reading 61% proficiency, ranked #13 of 73 in FL (top 18%) — acceptable for families but not a draw, mixed tenant base, ~2y average lease.
- Zoned schools: Longwood Elementary School (math 55% / reading 63%, grade B-, #722 of 2,144 statewide, top 34%, 631 students, 62% FRL); Milwee Middle School (math 55% / reading 56%, grade B-, #178 of 571 statewide, top 31%, 1,426 students, 64% FRL); Winter Springs High School (math 43% / reading 55%, grade D, #193 of 667 statewide, top 29%, 2,038 students, 47% FRL) — zoned schools average 58% FRL vs 38% district-wide (19 pts higher); higher-poverty schools than district average — tighter screening recommended.
- Market conditions: Rents rising (+3.9%/yr); 154 active listings in the ZIP; 30 comparable units currently listed for rent nearby; rentals leasing fast (median 7d on market — plan ~1-2 weeks tenant-placement turnaround); solid renter incomes; 1,979 units permitted in Seminole County in 2024 (1,191 in 5+ unit buildings).
Forward outlook
- Local home prices are declining (-3.0%/yr); year-one equity from $2k of loan paydown is wiped out by about $7k of value loss. Plan a longer hold.
- Seminole County population projected at +24% by 2050 — long-run rental-demand tailwind backs the buy-and-hold thesis.
Negotiation context
- It's been on market 80 days — a 6% lower offer ($226k) is reasonable based on typical stale-listing flexibility.
- 2 sale attempts since 15y ago with the ask held roughly flat each time — persistent listings suggest the price (not the market) is what's stuck; bring a comps-based counter.
- Current owner paid $41k; list at $240k implies a 485% gain — meaningful room to come down on a strong offer.
Risks & watch-outs
- Climate carrying-cost: severe wind risk, 99% chance of damaging wind over 30y; extreme-heat days projected 7→22/yr by 2055 (HVAC capex compounding) — expect insurance premiums to compound above CPI over the hold.
Questions for the listing agent
- What do current leases actually rent for vs. the listed asking? Can we see a recent rent roll and the last 12 months of T-12 income?
- It's been on market 80 days. Have you received any prior offers? Is the seller open to a 20% concession, seller financing, or rate buy-down credit?
- Why hasn't it sold? Are there any deal-killer items the seller is aware of (foundation, flood, title, zoning, code violations)?
- Is there a deadline driving the sale (1031 exchange, divorce, estate, relocation)? That informs how much negotiation room exists.
- Schools are A-rated — typically a magnet for longer-tenancy family renters. What's the average tenant stay here, and is there a school-zone premium baked into asking?
- The area grade is low — what's the realistic commute time and amenity access for the typical tenant pool here? Any planned neighborhood developments (good or bad) we should know about?
- What's the average days-on-market for RENTAL listings here right now (not sales)? A rising rental-DOM trend means longer vacancies and softer asking-rent achievability than the comps imply.
- What's the recent tenant-quality profile in this submarket — average credit score on applications, eviction rate, late-payment / NSF rate, and stable-employment percentage? A property-management company in the area should have these aggregated.
- How much new for-sale + rental construction is in the pipeline within 1–3 miles? Heavy new supply typically softens prices + rents 12–24 months out; constrained supply supports both.
Investment metrics
- 1% rule
- 0.80% ✗
- Cap rate
- 6.09%
- Cash-on-cash
- -0.73%
- DSCR
- 0.97
- GRM
- 10.4
CMA / ARV
- ARV (on-the-fly)
- $291,600
- Comps found
- 12
Show comp detail 12 sales within ~0.75 mi
| Address | Dist | Beds/Ba | Sqft | Sold | Price | $/sf | Match |
|---|---|---|---|---|---|---|---|
| 825 E Church Ave | 0.31mi | 2/1.0 | 1,050 (-3%) | 3mo | $195,000 | $186 | 74 |
| 348 E Palmetto Ave | 0.38mi | 3/2.0 (+1) | 1,096 (+2%) | 4mo | $240,000 | $219 | 71 |
| 401 Longwood Cir | 0.48mi | 3/2.0 (+1) | 1,080 (0%) | 6mo | $270,000 | $250 | 67 |
| 376 Orange Ave | 0.38mi | 3/2.0 (+1) | 1,040 (-4%) | 11mo | $335,000 | $322 | 62 |
| 735 Land Ave | 0.55mi | 3/2.0 (+1) | 1,095 (+1%) | 6mo | $297,000 | $271 | 62 |
| 280 E Bay Ave | 0.40mi | 3/2.0 (+1) | 1,128 (+4%) | 11mo | $350,000 | $310 | 60 |
| 110 W Magnolia Ave | 0.69mi | 2/1.0 | 1,032 (-4%) | 7mo | $245,000 | $237 | 50 |
| 891 N Wayman St | 0.52mi | 3/2.0 (+1) | 1,158 (+7%) | 11mo | $279,000 | $241 | 50 |
| 528 Winding Oak Ln | 0.68mi | 3/2.0 (+1) | 1,142 (+6%) | 9mo | $319,000 | $279 | 46 |
| 918 Lormann Cir | 0.68mi | 3/1.5 (+1) | 969 (-10%) | 7mo | $275,000 | $284 | 39 |
| 757 Longdale Ave | 0.66mi | 3/2.0 (+1) | 1,238 (+15%) | 5mo | $320,000 | $258 | 36 |
| 1041 Hamilton Ave | 0.64mi | 3/1.5 (+1) | 920 (-15%) | 8mo | $248,000 | $270 | 32 |
Match score weights: distance 35% · size 25% · config 20% · recency 20%. Top-matched comps best support the ARV.
Projected returns pro-forma
-3.0% appreciation · 3.89% rent growth · sell at horizon
- IRR
- -16.6%
- Equity multiple
- 0.41×
- Total profit
- $-39,776
- Equity at exit
- $35,785
- IRR
- -6.9%
- Equity multiple
- 0.54×
- Total profit
- $-30,821
- Equity at exit
- $20,751
Cash invested: $67,200 (down + closing). Projections, not guarantees.
Landlord ↔ Tenant lean methodology
- Overall (STATE)
- 87 Strongly Landlord-Friendly
- State Florida
- 87 Strongly Landlord-Friendly · R+3
- County
- — inherits STATE
- City
- — inherits STATE
ZIP-level market 32750
- Rents YoY
- 3.9%
- Active inventory
- 154
- Price-to-rent
- 10.4×
Monthly cashflow live
- Estimated rent
- $1,928 high interval (Pro) →
- Mortgage (P&I)
- −$1,259
- Tax from tax record
- −$206 /mo · $2,466/yr
- Insurance
- −$100
- HOA
- −$0
- Lot rent
- −$0
- Vacancy / Maint / Mgmt
- −$405
- Net cashflow
- $-41
Break-even live
Sensitivity live
| Price | -10% $95 | -5% $27 | +0% $-41 | +5% $-109 | +10% $-177 |
|---|---|---|---|---|---|
| Rent | -10% $-193 | -5% $-117 | +0% $-41 | +5% $35 | +10% $112 |
| Rate | -1.0pp $80 | -0.5pp $20 | base $-41 | +0.5pp $-103 | +1.0pp $-166 |
UW: 25.0% down · 7.5% · 30yr · 1.5% tax · 5.0% vac · 8.0% maint · 8.0% mgmt
Financing live
Cash to close
- Down payment
- $60,000
- Closing costs
- $7,200
- Reserves months
- —
- Total cash needed
- —
Loan-product check · same deal, 3 products live
Conventional
25% down · 7.5% · 30yr
- Down + closing
- —
- Monthly P&I
- —
- Monthly cashflow
- —
- DSCR
- —
- Eligible?
- —
Personal DTI + credit; lowest rate.
DSCR
20% down · 8.5% · 30yr
- Down + closing
- —
- Monthly P&I
- —
- Monthly cashflow
- —
- DSCR
- —
- Eligible?
- —
No personal income docs; deal must DSCR.
Hard money
10% down · 12.0% · 12mo
- Down + closing
- —
- Monthly P&I
- —
- Monthly cashflow
- —
- DSCR
- —
- Eligible?
- —
Short-term bridge; refi at stabilization.
Rent comps 30 comps
| Address | Beds | Baths | Sqft | Rent | $/sqft | DOM | Units | Dist |
|---|---|---|---|---|---|---|---|---|
| 620 E Church Ave Longwood, FL | 3.0 | 1.0 | 836 | $1,795 | $2.15 | 26d | 1 | 0.06mi |
| 564 N Wayman St Unit 564 Longwood, FL | 2.0 | 1.0 | 800 | $1,600 | $2.00 | 7d | 1 | 0.32mi |
| 444 Georgia Ave Longwood, FL | 3.0 | 2.0 | 1072 | $1,900 | $1.77 | 26d | 1 | 0.42mi |
| 509 East St Longwood, FL | 3.0 | 2.0 | 1215 | $1,940 | $1.60 | 26d | 1 | 0.44mi |
| 300 Orange Ave Unit B Longwood, FL | 2.0 | 1.0 | 833 | $1,417 | $1.70 | 26d | 1 | 0.45mi |
| 912 Bryan Ct Longwood, FL | 2.0 | 1.0 | 900 | $1,675 | $1.86 | 7d | 1 | 0.51mi |
| 681 Addison Longwood Ter Longwood, FL | 1.0–2.0 | 1.0–2.0 | 893 | $2,323 | $2.60 | 1d | 17 | 0.51mi |
| 77 Myrtle St Longwood, FL | 3.0 | 2.5 | 1488 | $2,275 | $1.53 | 22d | 1 | 0.54mi |
| 553 John L Mica Way Longwood, FL | 3.0 | 3.0 | 1488 | $2,500 | $1.68 | 26d | 1 | 0.54mi |
| 100 Myrtle St Longwood, FL | 2.0–3.0 | 2.0 | 1087 | $1,824 | $1.68 | 1d | 12 | 0.54mi |
| 963 N Wayman St Longwood, FL | 3.0 | 2.0 | 1352 | $2,050 | $1.52 | 7d | 1 | 0.56mi |
| 945 Bryan Ct Longwood, FL | 2.0 | 2.0 | 834 | $1,650 | $1.98 | 22d | 1 | 0.57mi |
| 829 E Wildmere Ave Longwood, FL | 3.0 | 2.0 | 1342 | $2,000 | $1.49 | 18d | 1 | 0.59mi |
| 829 E Wildmere Ave Unit 845-103 Longwood, FL | 3.0 | 2.0 | 1342 | $2,000 | $1.49 | 26d | 1 | 0.59mi |
| 907 Tidewater Ln Longwood, FL | 1.0–3.0 | 1.0–3.0 | 1301 | $1,887 | $1.45 | 1d | 7 | 0.73mi |
| 1450 Sunshadow Dr Casselberry, FL | 1.0–2.0 | 1.0–2.0 | 865 | $1,744 | $2.02 | 1d | 10 | 0.80mi |
| 714 Eagle Ave Longwood, FL | 3.0 | 2.0 | 1266 | $2,285 | $1.80 | 26d | 1 | 0.84mi |
| 265 W Bay Ave Longwood, FL | 3.0 | 1.0 | 1160 | $3,250 | $2.80 | 26d | 1 | 0.85mi |
| 1 Laurel Oaks Dr Winter Springs, FL | 1.0–3.0 | 1.0–2.0 | 1030 | $1,523 | $1.48 | 1d | 37 | 0.87mi |
| 542 Colonnades Cv Casselberry, FL | 2.0 | 2.0 | 840 | $1,775 | $2.11 | 4d | 1 | 1.08mi |
| 375 Summer Cypress Cv Longwood, FL | 1.0–3.0 | 1.0–2.0 | 1012 | $2,100 | $2.08 | 1d | 19 | 1.09mi |
| 506 Parson Brown Way Longwood, FL | 3.0 | 2.0 | 1500 | $2,275 | $1.52 | 24d | 1 | 1.17mi |
| 1050 S Ronald Reagan Blvd Longwood, FL | 3.0 | 1.0–2.0 | 1014 | $2,714 | $2.67 | 1d | 43 | 1.20mi |
| 881 W Warren Ave Longwood, FL | 3.0 | 1.0–2.0 | 1071 | $2,415 | $2.25 | 1d | 25 | 1.31mi |
| 300 Sheoah Blvd Winter Springs, FL | 1.0–3.0 | 1.0–2.0 | 1133 | $1,658 | $1.46 | 1d | 12 | 1.34mi |
| 10 Sheoah Blvd #8 Winter Springs, FL | 2.0 | 1.0 | 972 | $1,650 | $1.70 | 14d | 1 | 1.36mi |
| 400 Morrill Ter Casselberry, FL | 2.0 | 1.0 | 1000 | $1,550 | $1.55 | 7d | 1 | 1.39mi |
| 105 Keith Ct Winter Springs, FL | 3.0 | 2.5 | 1457 | $2,150 | $1.48 | 5d | 1 | 1.40mi |
| 407 Sheoah Blvd #9 Winter Springs, FL | 3.0 | 2.5 | 1400 | $1,750 | $1.25 | 1d | 1 | 1.43mi |
| 429 Sheoah Blvd #9 Winter Springs, FL | 3.0 | 2.0 | 1187 | $1,900 | $1.60 | 26d | 1 | 1.48mi |
Listing history 19 events
-
2026-06-22days on market $240,000 Active 80 DOM
-
2026-06-21days on market $240,000 Active 79 DOM
-
2026-06-18days on market $240,000 Active 76 DOM
-
2026-06-17days on market $240,000 Active 75 DOM
-
2026-06-16days on market $240,000 Active 74 DOM
-
2026-06-15days on market $240,000 Active 73 DOM
-
2026-06-13days on market $240,000 Active 71 DOM
-
2026-06-09days on market $240,000 Active 67 DOM
-
2026-06-08days on market $240,000 Active 66 DOM
-
2026-06-07days on market $240,000 Active 65 DOM
-
2026-06-04days on market $240,000 Active 62 DOM
-
2026-06-03days on market $240,000 Active 61 DOM
-
2026-06-02days on market $240,000 Active 60 DOM
-
2026-06-01days on market $240,000 Active 59 DOM
-
2026-05-31days on market $240,000 Active 58 DOM
-
2026-05-05price $240,000
-
2026-04-03$245,000 Active
-
2011-07-29soldstatus $41,000 306-char remark
Show marketing remark (306 chars)
Great location close to everything Seminole county has to offer. This 2 bedroom 2 bath duplex has a attached garage and it's own back yard!HUD PROPERTY SOLD "AS-IS". INFORMATION FROM SOURCES DEEMED TO BE RELIABLE, BUT NOT GUARANTEED. BUYER TO VERIFY ALL INFORMATION. HUD PROPERTY CASE- 094-329080
-
2011-05-24$40,000 306-char remark
Show marketing remark (306 chars)
Great location close to everything Seminole county has to offer. This 2 bedroom 2 bath duplex has a attached garage and it's own back yard!HUD PROPERTY SOLD "AS-IS". INFORMATION FROM SOURCES DEEMED TO BE RELIABLE, BUT NOT GUARANTEED. BUYER TO VERIFY ALL INFORMATION. HUD PROPERTY CASE- 094-329080
ⓘ Source: listings_history table (triggers on properties + properties_extension) + one-shot
backfill from property_details.listing_events for pre-trigger history.
Tax reassessment forecast FL · Resets to sale price
- Current annual tax
- $2,466 · $206/mo
- Projected year-2 tax
- $2,466 · $206/mo
- Expected delta
- $0/yr ($0/mo · 0.0%)
ⓘ Screening estimate from a state-policy table — verify with the county assessor before closing.
Climate risk First Street
- Flood 1/10 Low FEMA zone X (unshaded) · 0% chance over 30 yrs
- Wildfire 3/10 Moderate
- Heat 8/10 Severe 7 d/yr ≥108°F today · 22 d/yr by 30 yrs out
- Wind 9/10 Extreme 99% chance of damaging wind over 30 yrs
- Air quality 2/10 Low 1 unhealthy d/yr today · 2 by 30 yrs out
Nearby sold comps map
Loading sold comps map…
Walkable amenities ~0.75 mi
Loading nearby amenities…
Taxation est. · year 1
- Rental income
- $23,139
- − Mortgage interest
- −$13,444
- − Property taxes
- −$2,466
- − Insurance
- −$1,200
- − Repairs & maintenance
- −$1,851
- − Management
- −$1,851
- − Depreciation
- −$6,982
- Taxable loss
- −$4,655
- Est. tax savings @ 24.0%
- +$1,117
- After-tax cash flow
- $628/yr
For passive investors: Depreciation is non-cash, so a rental often shows a tax loss while cash-flowing — sheltering income. Rental losses are passive: they offset passive income freely, and up to $25,000/yr can offset ordinary (W-2) income if you actively participate and your MAGI is under $100k (phasing out to $0 by $150k); unused losses carry forward. On sale, claimed depreciation is recaptured at up to 25%, and gains may owe capital-gains tax (a 1031 exchange can defer both). Figures are a year-1 estimate at your 24.0% rate — not tax advice; consult a CPA.
Schools (NCES district)
- District
- Seminole
- NCES district ID
- 1201710
- Math proficiency
- 57% ▼ -7.00%
- Reading proficiency
- 61% ▼ -1.00%
- Median HH income
- $58,478
- Composite
- 51.05/100
- National rank
- #1769
- State rank
- #13 of 73 in FL
Livability — Longwood
- Score
- 81/100
- State rank
- #92
- US rank
- #1438
Category grades
Schools grade is shown separately in the Schools card above.
Census & demographics
- Census place
- Longwood, FL
- County
- Seminole County · 436,154 people
- City population
- 55,088
- Metro
- Orlando-Kissimmee-Sanford, FL
- Population (ZIP)
- 26,164
- Household income
- $86,125
- Rent vs Own
- Severe rent burden
- 774.0
Population outlook (Seminole County) Hauer SSP2
- Today (2025)
- 515,494 people
- By 2030
- 545,713 · +5.9%
- By 2040
- 598,068 · +16.0%
- By 2050
- 640,663 · +24.3%
- By 2075
- 724,461 · +40.5%
- By 2100
- 755,530 · +46.6%
Race, ethnicity, and origin ACS 2023
- Neighborhood character
- Majority White (63%)
- Race & ethnicity
- White 63% Hispanic / Latino 22% Two or more races 17% Black 5% Asian 3%
- Hispanic origin (detail)
- Mexican 2% Puerto Rican 9% Cuban 3%
- Common ancestry
- Romanian 2% Slovak 2% Lithuanian 2%
- Foreign-born
- 12% · Canada, Jamaica, China
- Languages at home
- 81% English-only · Spanish 13% Russian/Polish/Slavic 1% Other Indo-European 1%
Political lean MEDSL · Seminole
- 2024 margin
- Toss-up / Even · D 47.6% · R 51.1% · Other 1.3%
- 2008→2024 swing
- -0.8pp no change · 2008: -2.8pp · 2024: -3.5pp
- All cycles
- 2024: R+3.5 2020: D+2.8 2016: R+1.6 2012: R+6.5 2008: R+2.8
Not yet ingested
- Civics
- —
Market trends
- HPI YoY
- ▼ -250.13%
- Current HPI
- 335.7221
- Rent YoY
- ▲ 3.89%
- Metro
- Orlando-Kissimmee-Sanford, FL
- State GDP YoY
- ▲ 3.28%
- F500 in state
- 36
Industry mix (Fortune 500 HQ in FL)
| Industry | F500 HQs | Revenue |
|---|---|---|
| Industrial Technology | 2 | $29B |
|
||
| Insurance | 2 | $17B |
|
||
| Retail | 1 | $60B |
|
||
| Technology Distribution | 1 | $58B |
|
||
| Homebuilding | 1 | $35B |
|
||
| Technology Manufacturing | 1 | $35B |
|
||
Price history
+500.0% since first listed4 events — show timeline
- 2026-05-05 Price Changed $240,000 Stellar MLS as Distributed by MLS Grid
- 2026-04-03 Listed $245,000 Stellar MLS as Distributed by MLS Grid
- 2011-07-29 Sold (MLS) $41,000 Stellar MLS as Distributed by MLS Grid
- 2011-05-24 Listed $40,000 Stellar MLS as Distributed by MLS Grid
Property tax history
+7.4%/yrLatest (2025): $2,466 · +11.4% YoY. Source: county tax records.
Cash-flow waterfall
monthlySold comps — $/sqft
last 12 mo · ≤1 miLoading sold comps…