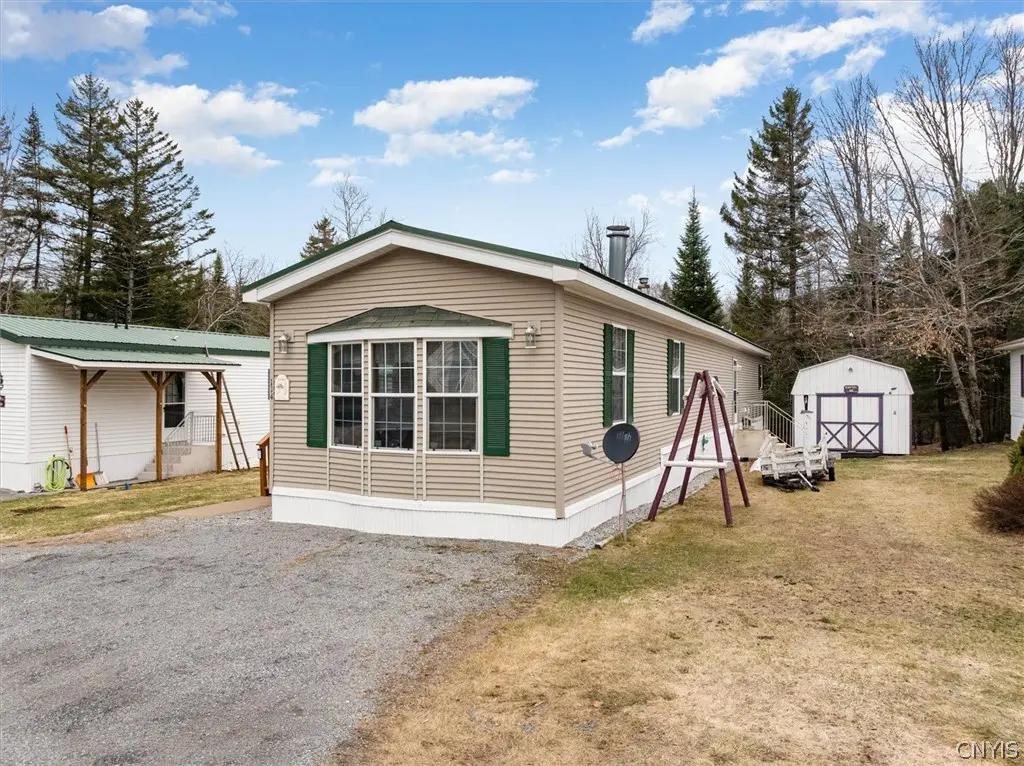
114 Lecours Dr · Old Forge, NY
Flood risk 1/10 · Minimal
- FEMA flood zone
- A
- Chance of flooding over 30 yrs
- 0.0%
- Est. flood insurance / yr
- $1,009 – $1,996
Fire risk 1/10 · Minimal
- Est. fire insurance / yr
- $691 – $1,283
Heat risk 1/10 · Minimal
- Hot days now (above 87°F)
- 7 days/yr
- Hot days in 30 yrs
- 17 days/yr
Wind risk 1/10 · Minimal
- Chance of severe wind over 30 yrs
- —
Air-quality risk 1/10 · Minimal
- Unhealthy air days now
- 0 days/yr
- Unhealthy air days in 30 yrs
- 0 days/yr
Risk factors via First Street. Map © Google.
Why this score? — see what drove the F grade
The composite is a weighted blend of 9 inputs, each scored 0–100. Each bar is that input's sub-score; the figure is the points it added to the 100-point composite (weight × sub-score).
- Appreciation +6.0/10.0
- Cash flow +5.6/30.0
- Schools +4.7/10.0
- Livability +3.2/5.0
- Rent growth +2.5/5.0
- Condition / age +2.5/5.0
- 1% rule +1.1/10.0
- DSCR +0.0/10.0
- ARV discount +0.0/15.0
$179,500
🖨 Deal sheet 📄 Offer letter ✓ Due diligence
Listing remarks MLS
RARE OPPORTUNITY IN OLD FORGE – 3 Bedroom, 2 bath home located in a popular park close to restaurants, lakes, beach, and snowmobile trails. Sunken living room features a wood burning fireplace. Great primary or vacation home. Shed fits two snowmobiles. Appliances, basic furniture, and generator included. Reasonable lot rent and no property or school taxes. $184,900.
Key facts
- Built 2005
- Listed 51 days
Neighborhood map
What this means for you Summary
Snapshot
- This is a 3-bed/2.0-bath manufactured listed at $180k.
Deal economics
- At list price, monthly cash flow is $-504 ($-6k/yr) — negative.
- To cash-flow at today's rent, offer at most $107k (40.6% below list).
- To meet the 1% rule (rent ≥ 1% of price), the offer needs to be $109k (39.2% below list).
- Recommended offer: $107k (40.6% below list) — sets the bar for cash-flow.
Location & tenants
- Location reads 63/100 on livability (#804 in NY) — a middle-class / working-renter tenant base. Strengths: housing A+; Watch: crime C-, health & safety C-, employment D+.
- Town Of Webb Union Free School District (rural): math 50% / reading 55% proficiency, ranked #404 of 755 in NY (top 54%) — acceptable for families but not a draw, mixed tenant base, ~2y average lease.
- Market conditions: 43 active listings in the ZIP; 54 units permitted in Herkimer County in 2024 (0 in 5+ unit buildings).
Forward outlook
- In year one you build about $5k of equity ($1k loan paydown + $4k appreciation (2.0% local appreciation)).
- Herkimer County population projected at -24% by 2050 — secular population decline; favor cash flow + early exit over multi-decade hold.
- By year 7, paydown + projected appreciation supports a ~$31k cash-out refi (75% LTV) — recoverable capital for the next deal without selling this one.
Negotiation context
- It's been on market 51 days — a 3% lower offer ($174k) is reasonable based on typical stale-listing flexibility.
Risks & watch-outs
- Watch-outs: flood insurance adds $125/mo.
- Climate carrying-cost: in FEMA flood zone A (mandatory federal flood insurance) — expect insurance premiums to compound above CPI over the hold.
Questions for the listing agent
- What do current leases actually rent for vs. the listed asking? Can we see a recent rent roll and the last 12 months of T-12 income?
- It's been on market 51 days. Have you received any prior offers? Is the seller open to a 41% concession, seller financing, or rate buy-down credit?
- What's the actual annual flood-insurance premium (NFIP or private), and is the property in a SFHA with mandatory coverage?
- Is there a deadline driving the sale (1031 exchange, divorce, estate, relocation)? That informs how much negotiation room exists.
- The area grade is low — what's the realistic commute time and amenity access for the typical tenant pool here? Any planned neighborhood developments (good or bad) we should know about?
- What's the average days-on-market for RENTAL listings here right now (not sales)? A rising rental-DOM trend means longer vacancies and softer asking-rent achievability than the comps imply.
- What's the recent tenant-quality profile in this submarket — average credit score on applications, eviction rate, late-payment / NSF rate, and stable-employment percentage? A property-management company in the area should have these aggregated.
- How much new for-sale + rental construction is in the pipeline within 1–3 miles? Heavy new supply typically softens prices + rents 12–24 months out; constrained supply supports both.
Investment metrics
- 1% rule
- 0.61% ✗
- Cap rate
- 3.76%
- Cash-on-cash
- -9.04%
- DSCR
- 0.60
- GRM
- 13.7
CMA / ARV
- ARV (median comp)
- $135,000
- List price
- $179,500
- Delta
- 32.96%
- Verdict
- OVERPRICED
- Comps
- 1 within 2.0 mi
Projected returns pro-forma
2.01% appreciation · 3.0% rent growth · sell at horizon
- IRR
- -7.2%
- Equity multiple
- 0.61×
- Total profit
- $-19,613
- Equity at exit
- $70,893
- IRR
- -1.8%
- Equity multiple
- 0.75×
- Total profit
- $-12,715
- Equity at exit
- $102,159
Cash invested: $50,260 (down + closing). Projections, not guarantees.
Landlord ↔ Tenant lean methodology
- Overall (STATE)
- 15 Strongly Tenant-Friendly
- State New York
- 15 Strongly Tenant-Friendly · D+10
- County
- — inherits STATE
- City
- — inherits STATE
ZIP-level market 13420
- Home prices YoY
- 0.5%
- Active inventory
- 43
- Price-to-rent
- 13.7×
Monthly cashflow live
- Estimated rent
- $1,091 medium interval (Pro) →
- Mortgage (P&I)
- −$941
- Tax est. 1.5%
- −$224 /mo · $2,692/yr
- Insurance
- −$75
- Flood insurance flood zone
- −$125 /mo · $1,502/yr
- HOA
- −$0
- Vacancy / Maint / Mgmt
- −$229
- Net cashflow
- $-504
Break-even live
UW: 25.0% down · 7.5% · 30yr · 1.5% tax · 5.0% vac · 8.0% maint · 8.0% mgmt
Financing live
Cash to close
- Down payment
- $44,875
- Closing costs
- $5,385
- Reserves months
- —
- Total cash needed
- —
Loan-product check · same deal, 3 products live
Conventional
25% down · 7.5% · 30yr
- Down + closing
- —
- Monthly P&I
- —
- Monthly cashflow
- —
- DSCR
- —
- Eligible?
- —
Personal DTI + credit; lowest rate.
DSCR
20% down · 8.5% · 30yr
- Down + closing
- —
- Monthly P&I
- —
- Monthly cashflow
- —
- DSCR
- —
- Eligible?
- —
No personal income docs; deal must DSCR.
Hard money
10% down · 12.0% · 12mo
- Down + closing
- —
- Monthly P&I
- —
- Monthly cashflow
- —
- DSCR
- —
- Eligible?
- —
Short-term bridge; refi at stabilization.
Listing history 8 events
-
2026-06-07statusdays on market $179,500 Pending 51 DOM
-
2026-06-04days on market $179,500 Active Under Contract 50 DOM
-
2026-06-02days on market $179,500 Active Under Contract 49 DOM
-
2026-06-01days on market $179,500 Active Under Contract 48 DOM
-
2026-05-31days on market $179,500 Active Under Contract 47 DOM
-
2026-05-11historical Active Under Contract 374-char remark
Show marketing remark (374 chars)
RARE OPPORTUNITY IN OLD FORGE – 3 Bedroom, 2 bath home located in a popular park close to restaurants, lakes, beach, and snowmobile trails. Sunken living room features a wood burning fireplace. Great primary or vacation home. Shed fits two snowmobiles. Appliances, basic furniture, and generator included. Reasonable lot rent and no property or school taxes. $184,900.
-
2026-04-29price $179,500 374-char remark
Show marketing remark (374 chars)
RARE OPPORTUNITY IN OLD FORGE – 3 Bedroom, 2 bath home located in a popular park close to restaurants, lakes, beach, and snowmobile trails. Sunken living room features a wood burning fireplace. Great primary or vacation home. Shed fits two snowmobiles. Appliances, basic furniture, and generator included. Reasonable lot rent and no property or school taxes. $184,900.
-
2026-04-13$184,900 Active 374-char remark
Show marketing remark (374 chars)
RARE OPPORTUNITY IN OLD FORGE – 3 Bedroom, 2 bath home located in a popular park close to restaurants, lakes, beach, and snowmobile trails. Sunken living room features a wood burning fireplace. Great primary or vacation home. Shed fits two snowmobiles. Appliances, basic furniture, and generator included. Reasonable lot rent and no property or school taxes. $184,900.
ⓘ Source: listings_history table (triggers on properties + properties_extension) + one-shot
backfill from property_details.listing_events for pre-trigger history.
Climate risk First Street
- Flood 1/10 Low FEMA zone A · 0% chance over 30 yrs
- Wildfire 1/10 Low
- Heat 1/10 Low 7 d/yr ≥87°F today · 17 d/yr by 30 yrs out
- Wind 1/10 Low
- Air quality 1/10 Low 0 unhealthy d/yr today · 0 by 30 yrs out
Nearby sold comps map
Loading sold comps map…
Walkable amenities ~0.75 mi
Loading nearby amenities…
Taxation est. · year 1
- Rental income
- $13,089
- − Mortgage interest
- −$10,055
- − Property taxes
- −$2,692
- − Insurance
- −$2,400
- − Repairs & maintenance
- −$1,047
- − Management
- −$1,047
- − Depreciation
- −$5,222
- Taxable loss
- −$9,375
- Est. tax savings @ 24.0%
- +$2,250
- After-tax cash flow
- $-3,798/yr
For passive investors: Depreciation is non-cash, so a rental often shows a tax loss while cash-flowing — sheltering income. Rental losses are passive: they offset passive income freely, and up to $25,000/yr can offset ordinary (W-2) income if you actively participate and your MAGI is under $100k (phasing out to $0 by $150k); unused losses carry forward. On sale, claimed depreciation is recaptured at up to 25%, and gains may owe capital-gains tax (a 1031 exchange can defer both). Figures are a year-1 estimate at your 24.0% rate — not tax advice; consult a CPA.
Schools (NCES district)
- District
- Town Of Webb Union Free School District
- NCES district ID
- 3628800
- Math proficiency
- 50% ▬ 0.00%
- Reading proficiency
- 55% ▬ 0.00%
- Median HH income
- $52,522
- Composite
- 47.01/100
- National rank
- #5138
- State rank
- #404 of 755 in NY
Livability — Old Forge
- Score
- 63/100
- State rank
- #804
- US rank
- #15562
Category grades
Schools grade is shown separately in the Schools card above.
Census & demographics
- Census place
- Old Forge, NY
- Population (ZIP)
- 890
Population outlook (Herkimer County) Hauer SSP2
- Today (2025)
- 59,340 people
- By 2030
- 56,838 · -4.2%
- By 2040
- 51,098 · -13.9%
- By 2050
- 45,080 · -24.0%
- By 2075
- 32,648 · -45.0%
- By 2100
- 22,266 · -62.5%
Race, ethnicity, and origin ACS 2023
- Neighborhood character
- Predominantly White (97%)
- Race & ethnicity
- White 97% Black 3%
- Common ancestry
- Scottish 5% Scotch-Irish 4% Slovak 3%
- Languages at home
- 87% English-only · Spanish 12%
Political lean MEDSL · Herkimer
- 2024 margin
- Solid R (+36.4) · D 31.8% · R 68.2%
- 2008→2024 swing
- -27.1pp toward R · 2008: -9.3pp · 2024: -36.4pp
- All cycles
- 2024: R+36.4 2020: R+30.5 2016: R+34.5 2012: R+8.4 2008: R+9.3
Not yet ingested
- Civics
- —
Market trends
- HPI YoY
- ▲ 2.01%
- Current HPI
- 412.483
- Rent YoY
- —
- Metro
- —
- State GDP YoY
- ▲ 2.60%
- F500 in state
- 92
Industry mix (Fortune 500 HQ in NY)
| Industry | F500 HQs | Revenue |
|---|---|---|
| Financial Services | 10 | $950B |
|
||
| Consumer Goods | 9 | $162B |
|
||
| Insurance | 4 | $225B |
|
||
| Telecommunications | 2 | $144B |
|
||
| Pharmaceuticals | 2 | $112B |
|
||
| Media / Entertainment | 2 | $69B |
|
||
Price history
-2.9% since first listed3 events — show timeline
- 2026-05-11 Contingent — CNYIS
- 2026-04-29 Price Changed $179,500 CNYIS
- 2026-04-13 Listed $184,900 CNYIS
Cash-flow waterfall
monthlySold comps — $/sqft
last 12 mo · ≤1 miLoading sold comps…