6865 Old Henderson Spottsville Rd · Spottsville, KY
Flood risk 1/10 · Minimal
- FEMA flood zone
- X (unshaded)
- Chance of flooding over 30 yrs
- 0.0%
- Est. flood insurance / yr
- $473 – $860
Fire risk 3/10 · Minor
- Est. fire insurance / yr
- $839 – $1,559
Heat risk 5/10 · Moderate
- Hot days now (above 107°F)
- 7 days/yr
- Hot days in 30 yrs
- 19 days/yr
Wind risk 2/10 · Minimal
- Chance of severe wind over 30 yrs
- 3.0%
Air-quality risk 3/10 · Minor
- Unhealthy air days now
- 3 days/yr
- Unhealthy air days in 30 yrs
- 4 days/yr
Risk factors via First Street. Map © Google.
Why this score? — see what drove the B grade
The composite is a weighted blend of 9 inputs, each scored 0–100. Each bar is that input's sub-score; the figure is the points it added to the 100-point composite (weight × sub-score).
- Cash flow +30.0/30.0
- DSCR +10.0/10.0
- 1% rule +9.1/10.0
- ARV discount +7.5/15.0
- Appreciation +4.5/10.0
- Schools +3.4/10.0
- Livability +3.2/5.0
- Rent growth +2.5/5.0
- Condition / age +2.5/5.0
$69,900
🖨 Deal sheet 📄 Offer letter ✓ Due diligence
Listing remarks
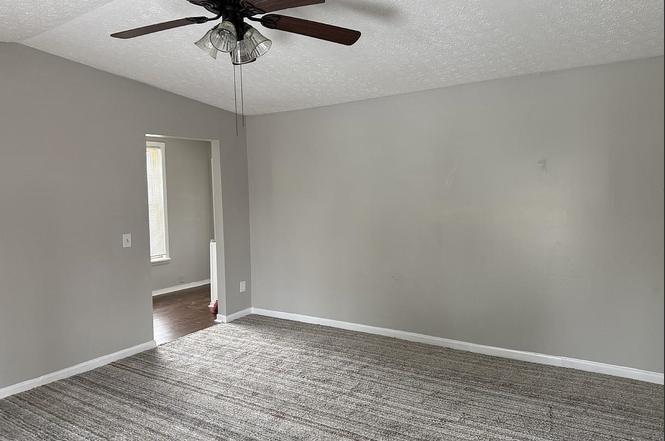
You won't believe the transformation!!! New paint, flooring, lighting fixtures and more!! Schedule your private tour today, at this price, it won't last long!!!
Key facts
- Built 1950
- Listed 59 days
Neighborhood map
What this means for you Summary
Snapshot
- This is a 1-bed/1.0-bath single-family listed at $70k.
Deal economics
- At list price, monthly cash flow is $326 ($4k/yr) — positive.
- The deal already cash-flows at list — no discount required.
- Meets the 1% rule at list price ($982 rent vs $70k).
- Recommended offer: $68k (3.0% below list) — sets the bar for market timing.
Location & tenants
- Location reads 64/100 on livability (#280 in KY) — a middle-class / working-renter tenant base. Strengths: employment A+, cost of living A+, crime B+; Watch: amenities F, commute F, health & safety F.
- Henderson County (suburban): math 40% / reading 41% proficiency, ranked #29 of 165 in KY (top 18%) — families likely to look elsewhere, expect single-tenant / working-renter base with shorter leases.
- Zoned schools: Spottsville Elementary School (math 56% / reading 57%, grade C+, #57 of 676 statewide, top 9%, 547 students, 40% FRL).
- Zoned-school proficiency averages 56% at this address vs 40% district-wide (+16 pts) — the actual schools serving this property are materially stronger than the Henderson County average implies; a family-tenant draw the district grade alone would hide.
- Market conditions: 4 active listings in the ZIP; 92 units permitted in Henderson County in 2024 (0 in 5+ unit buildings).
Forward outlook
- Local home prices are declining (-1.0%/yr); year-one equity from $483 of loan paydown is wiped out by about $701 of value loss. Plan a longer hold.
- Henderson County population projected to shrink 5% by 2050 — rents likely to lag national; underwrite the cash flow, not the appreciation.
- At projected returns (-1.0% appreciation + 3.0% rent growth), your $20k cash investment doubles in ~5 years — after that, you're playing with house money.
Negotiation context
- It's been on market 59 days — a 3% lower offer ($68k) is reasonable based on typical stale-listing flexibility.
- 4 sale attempts since 4y ago with the ask held roughly flat each time — persistent listings suggest the price (not the market) is what's stuck; bring a comps-based counter.
- Current owner paid $53k; 31% above their basis — modest negotiation headroom, anchor on the comps not their cost.
Risks & watch-outs
- Watch-outs: built in 1950 — expect roof / HVAC / electrical / plumbing capex.
- Climate carrying-cost: extreme-heat days projected 7→19/yr by 2055 (HVAC capex compounding) — expect insurance premiums to compound above CPI over the hold.
Questions for the listing agent
- It's been on market 59 days. Have you received any prior offers? Is the seller open to a 3% concession, seller financing, or rate buy-down credit?
- Built in 1950 — when were the roof, HVAC, electrical panel, plumbing, and water heater last replaced?
- Is there a deadline driving the sale (1031 exchange, divorce, estate, relocation)? That informs how much negotiation room exists.
- What's the average days-on-market for RENTAL listings here right now (not sales)? A rising rental-DOM trend means longer vacancies and softer asking-rent achievability than the comps imply.
- What's the recent tenant-quality profile in this submarket — average credit score on applications, eviction rate, late-payment / NSF rate, and stable-employment percentage? A property-management company in the area should have these aggregated.
- How much new for-sale + rental construction is in the pipeline within 1–3 miles? Heavy new supply typically softens prices + rents 12–24 months out; constrained supply supports both.
Investment metrics
- 1% rule
- 1.41% ✓
- Cap rate
- 11.89%
- Cash-on-cash
- 20.00%
- DSCR
- 1.89
- GRM
- 5.9
CMA / ARV
No comps found within radius.
Projected returns pro-forma
-1.0% appreciation · 3.0% rent growth · sell at horizon
- IRR
- 17.4%
- Equity multiple
- 1.79×
- Total profit
- $15,500
- Equity at exit
- $16,863
- IRR
- 23.1%
- Equity multiple
- 3.35×
- Total profit
- $45,913
- Equity at exit
- $17,699
Cash invested: $19,572 (down + closing). Projections, not guarantees.
Landlord ↔ Tenant lean methodology
- Overall (STATE)
- 83 Strongly Landlord-Friendly
- State Kentucky
- 83 Strongly Landlord-Friendly · R+16
- County
- — inherits STATE
- City
- — inherits STATE
ZIP-level market 42458
- Home prices YoY
- -0.6%
- Active inventory
- 4
- Price-to-rent
- 5.9×
Monthly cashflow live
- Estimated rent
- $982 medium interval (Pro) →
- Mortgage (P&I)
- −$367
- Tax from tax record
- −$54 /mo · $647/yr
- Insurance
- −$29
- HOA
- −$0
- Vacancy / Maint / Mgmt
- −$206
- Net cashflow
- $326
Break-even live
UW: 25.0% down · 7.5% · 30yr · 1.5% tax · 5.0% vac · 8.0% maint · 8.0% mgmt
Financing live
Cash to close
- Down payment
- $17,475
- Closing costs
- $2,097
- Reserves months
- —
- Total cash needed
- —
Loan-product check · same deal, 3 products live
Conventional
25% down · 7.5% · 30yr
- Down + closing
- —
- Monthly P&I
- —
- Monthly cashflow
- —
- DSCR
- —
- Eligible?
- —
Personal DTI + credit; lowest rate.
DSCR
20% down · 8.5% · 30yr
- Down + closing
- —
- Monthly P&I
- —
- Monthly cashflow
- —
- DSCR
- —
- Eligible?
- —
No personal income docs; deal must DSCR.
Hard money
10% down · 12.0% · 12mo
- Down + closing
- —
- Monthly P&I
- —
- Monthly cashflow
- —
- DSCR
- —
- Eligible?
- —
Short-term bridge; refi at stabilization.
Listing history 17 events
-
2026-03-24status Pending
-
2026-01-23$69,900 Active
-
2025-08-15price $39,000
-
2025-07-31price $49,000
-
2025-07-30price $52,000
-
2025-07-14price $53,000
-
2025-07-01price $55,000
-
2025-05-23price $60,000
-
2025-05-14price $65,000
-
2025-05-09price $75,000
-
2025-04-25$80,000 Active
-
2023-05-11price $59,900
-
2023-03-28status Active
-
2022-10-13price $75,000
-
2022-09-27price $85,000
-
2022-08-31$96,000 Active
-
2022-08-11soldstatus $53,400
ⓘ Source: listings_history table (triggers on properties + properties_extension) + one-shot
backfill from property_details.listing_events for pre-trigger history.
Tax reassessment forecast KY · Resets to sale price
- Current annual tax
- $647 · $54/mo
- Projected year-2 tax
- $647 · $54/mo
- Expected delta
- $0/yr ($0/mo · 0.0%)
ⓘ Screening estimate from a state-policy table — verify with the county assessor before closing.
Climate risk First Street
- Flood 1/10 Low FEMA zone X (unshaded) · 0% chance over 30 yrs
- Wildfire 3/10 Moderate
- Heat 5/10 Major 7 d/yr ≥107°F today · 19 d/yr by 30 yrs out
- Wind 2/10 Low 3% chance of damaging wind over 30 yrs
- Air quality 3/10 Moderate 3 unhealthy d/yr today · 4 by 30 yrs out
Nearby sold comps map
Loading sold comps map…
Walkable amenities ~0.75 mi
Loading nearby amenities…
Taxation est. · year 1
- Rental income
- $11,785
- − Mortgage interest
- −$3,915
- − Property taxes
- −$647
- − Insurance
- −$350
- − Repairs & maintenance
- −$943
- − Management
- −$943
- − Depreciation
- −$2,033
- Taxable income
- $2,954
- Est. tax owed @ 24.0%
- −$709
- After-tax cash flow
- $3,206/yr
For passive investors: Depreciation is non-cash, so a rental often shows a tax loss while cash-flowing — sheltering income. Rental losses are passive: they offset passive income freely, and up to $25,000/yr can offset ordinary (W-2) income if you actively participate and your MAGI is under $100k (phasing out to $0 by $150k); unused losses carry forward. On sale, claimed depreciation is recaptured at up to 25%, and gains may owe capital-gains tax (a 1031 exchange can defer both). Figures are a year-1 estimate at your 24.0% rate — not tax advice; consult a CPA.
Schools (NCES district)
- District
- Henderson County
- NCES district ID
- 2102710
- Math proficiency
- 40% ▼ -19.00%
- Reading proficiency
- 41% ▼ -16.00%
- Median HH income
- $41,772
- Composite
- 34.13/100
- National rank
- #5285
- State rank
- #29 of 165 in KY
Livability — Spottsville
- Score
- 64/100
- State rank
- #280
- US rank
- #13623
Category grades
Schools grade is shown separately in the Schools card above.
Census & demographics
- Census place
- Spottsville, KY
- Population (ZIP)
- 906
Population outlook (Henderson County) Hauer SSP2
- Today (2025)
- 46,910 people
- By 2030
- 46,841 · -0.1%
- By 2040
- 46,018 · -1.9%
- By 2050
- 44,390 · -5.4%
- By 2075
- 40,442 · -13.8%
- By 2100
- 33,538 · -28.5%
Race, ethnicity, and origin ACS 2023
- Neighborhood character
- Predominantly White (100%)
- Race & ethnicity
- White 100%
- Common ancestry
- Lithuanian 9% Serbian 2%
- Languages at home
- 99% English-only · Other Indo-European 1%
Political lean MEDSL · Henderson
- 2024 margin
- Strong R (+29.2) · D 34.7% · R 64.0% · Other 1.3%
- 2008→2024 swing
- -31.9pp toward R · 2008: 2.6pp · 2024: -29.2pp
- All cycles
- 2024: R+29.2 2020: R+24.6 2016: R+27.7 2012: R+11.8 2008: D+2.6
Not yet ingested
- Civics
- —
Market trends
- HPI YoY
- ▼ -1.00%
- Current HPI
- 178.8349
- Rent YoY
- —
- Metro
- —
- State GDP YoY
- ▲ 1.81%
- F500 in state
- 4
Industry mix (Fortune 500 HQ in KY)
| Industry | F500 HQs | Revenue |
|---|---|---|
| Healthcare | 1 | $118B |
|
||
| Food / Beverage | 1 | $7B |
|
||
Price history
+30.9% since first listed17 events — show timeline
- 2026-03-24 Pending — HABOR
- 2026-01-23 Listed $69,900 HABOR
- 2025-08-15 Price Changed $39,000 HABOR
- 2025-07-31 Price Changed $49,000 HABOR
- 2025-07-30 Price Changed $52,000 HABOR
- 2025-07-14 Price Changed $53,000 HABOR
- 2025-07-01 Price Changed $55,000 HABOR
- 2025-05-23 Price Changed $60,000 HABOR
- 2025-05-14 Price Changed $65,000 HABOR
- 2025-05-09 Price Changed $75,000 HABOR
- 2025-04-25 Listed $80,000 HABOR
- 2023-05-11 Price Changed $59,900 GORAMLS
- 2023-03-28 Relisted — GORAMLS
- 2022-10-13 Price Changed $75,000 GORAMLS
- 2022-09-27 Price Changed $85,000 GORAMLS
- 2022-08-31 Listed $96,000 GORAMLS
- 2022-08-11 Sold (Public Records) $53,400 Public Records
Property tax history
+1.6%/yrLatest (2025): $647 · +0.2% YoY. Source: county tax records.
Cash-flow waterfall
monthlySold comps — $/sqft
last 12 mo · ≤1 miLoading sold comps…