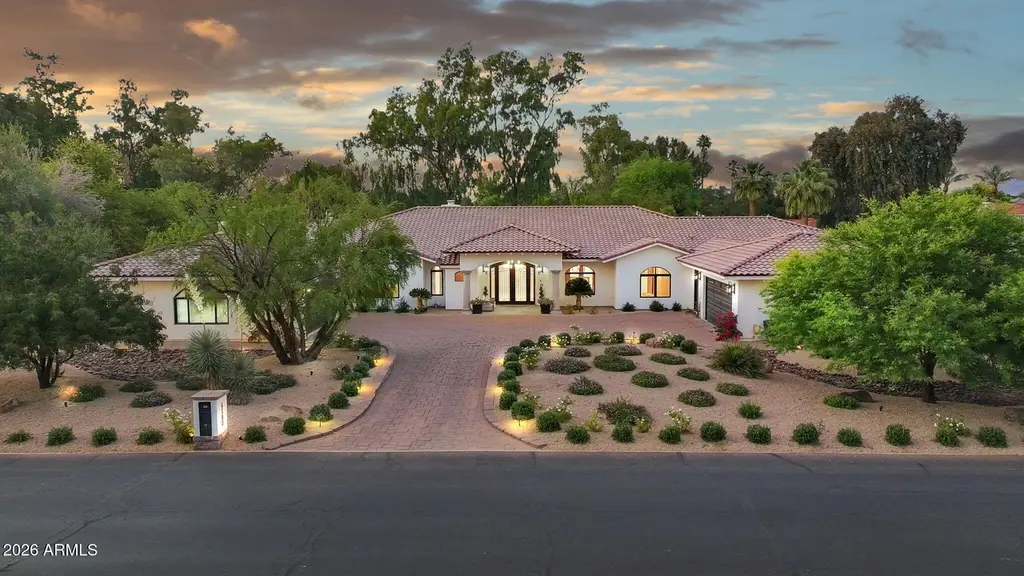
6500 E Fanfol Dr · Paradise Valley, AZ
Flood risk 1/10 · Minimal
- FEMA flood zone
- X (unshaded)
- Chance of flooding over 30 yrs
- 0.0%
- Est. flood insurance / yr
- $507 – $1,088
Fire risk 3/10 · Minor
- Est. fire insurance / yr
- $610 – $1,132
Heat risk 8/10 · Major
- Hot days now (above 111°F)
- 7 days/yr
- Hot days in 30 yrs
- 19 days/yr
Wind risk 1/10 · Minimal
- Chance of severe wind over 30 yrs
- —
Air-quality risk 3/10 · Minor
- Unhealthy air days now
- 3 days/yr
- Unhealthy air days in 30 yrs
- 4 days/yr
Risk factors via First Street. Map © Google.
Why this score? — see what drove the D- grade
The composite is a weighted blend of 9 inputs, each scored 0–100. Each bar is that input's sub-score; the figure is the points it added to the 100-point composite (weight × sub-score).
- ARV discount +14.6/15.0
- Appreciation +10.0/10.0
- Schools +4.8/10.0
- Rent growth +4.7/5.0
- Livability +3.2/5.0
- Condition / age +2.5/5.0
- Cash flow +0.0/30.0
- 1% rule +0.0/10.0
- DSCR +0.0/10.0
$4,299,000
🖨 Deal sheet (PDF) 📄 Offer letter ✓ Due diligence
Listing remarks
Step inside this timeless Paradise Valley estate and let the details speak for themselves. Soaring ceilings greet you in the entry. Cove lighting warms the formal dining area at dusk. Black granite wraps the fireplace and entry details, grounding the spaces in something quietly architectural. A study in thoughtful renovation, this remodeled residence is defined by quality materials and craftsmanship. Expansive living areas are designed as a series of distinct spaces, each one purpose-built for living well and entertaining beautifully. The kitchen is the centerpiece of the home, featuring custom cabinetry, Wolf, Subzero, and Viking Appliances surrounded by double islands topped with marble a
Key facts
- 0.97 acre lot
- 6 garage spots
- Pool
Property features AI
Finance
- Other: Private pool with diving area
- HOA & community: No association fees
Exterior
- Parking: 6 covered parking spaces; 4 open parking spaces; Detached parking; Garage door opener; Attached garage cabinets; RV access/parking with RV gate
- Security: Owned security system
- Utilities: City water; Septic tank (septic connected)
- Home design: Single-family residence; Fee simple ownership; Asphalt road access
- Construction: Stucco and painted wood-frame construction; Tile roof; Building area per appraiser
- Exterior features: Private yard; Misting system; Block fencing; Sprinklers front and rear with automatic timer; Desert landscaping front and back; Grass in rear
Interior
- Kitchen: Refrigerator; Dishwasher; Disposal; Built-in microwave; Multiple ovens; Kitchen island; Walk-in pantry
- Bedrooms: Up to 7 bedrooms possible
- Flooring: Stone flooring; Wood flooring
- Bathrooms: 5 full bathrooms; 1 half bathroom (6 total bathrooms)
- Heating & cooling: Electric heating; Central air conditioning; Ceiling fans; Multi-zone HVAC
- Interior features: High-speed internet; Double vanity sinks; Eat-in kitchen; Breakfast bar; 9+ foot flat ceilings; Central vacuum; No interior steps; Vaulted ceilings; Wet bar; Kitchen island; Pantry (walk-in); Primary suite with full bath; Separate shower and tub; Tub with jets; Skylights; Dual-pane windows; Living room gas fireplace; Stone and wood flooring; Multi-zone energy controls
- Laundry & utility: Laundry room located inside
Neighborhood map
What this means for you Summary
Snapshot
- This is a 5-bed/5.0-bath single-family listed at $4.30M.
Deal economics
- At list price, monthly cash flow is $-21k ($-257k/yr) — negative.
- To cash-flow at today's rent, offer at most $516k (88.0% below list).
- To meet the 1% rule (rent ≥ 1% of price), the offer needs to be $484k (88.7% below list).
- Recommended offer: $484k (88.7% below list) — sets the bar for 1% rule.
Location & tenants
- Location reads 63/100 on livability (#123 in AZ) — a middle-class / working-renter tenant base. Strengths: crime A+, employment A+; Watch: commute D, amenities F, cost of living F.
- Scottsdale Unified District (4240) (urban): math 53% / reading 55% proficiency, ranked #30 of 249 in AZ (top 12%) — acceptable for families but not a draw, mixed tenant base, ~2y average lease.
- Zoned schools: Cherokee Elementary School (math 86% / reading 87%, grade A+, #5 of 1,109 statewide, top 0%, 659 students, 6% FRL); Cocopah Middle School (math 63% / reading 63%, grade B+, #3 of 218 statewide, top 1%, 886 students, 9% FRL); Chaparral High School (math 40% / reading 35%, grade F, #82 of 381 statewide, top 22%, 2,038 students, 6% FRL).
- Market conditions: Rents rising fast (+8.6%/yr); 356 active listings in the ZIP; 8 comparable units currently listed for rent nearby; rentals at typical pace (median 26d on market — plan ~3-4 weeks tenant-placement turnaround); high-income renter base; 36,011 units permitted in Maricopa County in 2024 (12,801 in 5+ unit buildings).
- This rent runs 31% of the median local income ($185k/yr) — at the standard rent-burdened threshold; future hikes will face affordability resistance.
Forward outlook
- In year one you build about $460k of equity ($30k loan paydown + $430k appreciation (10.0% local appreciation)).
- Maricopa County population projected at +38% by 2050 — long-run rental-demand tailwind backs the buy-and-hold thesis.
- By year 2, paydown + projected appreciation supports a ~$739k cash-out refi (75% LTV) — recoverable capital for the next deal without selling this one.
Negotiation context
- It's been on market 51 days — a 3% lower offer ($4.17M) is reasonable based on typical stale-listing flexibility.
- 10 sale attempts since 18y ago with the ask held roughly flat each time — persistent listings suggest the price (not the market) is what's stuck; bring a comps-based counter.
- Current owner paid $1.52M; list at $4.30M implies a 182% gain — meaningful room to come down on a strong offer.
Risks & watch-outs
- Climate carrying-cost: extreme-heat days projected 7→19/yr by 2055 (HVAC capex compounding) — expect insurance premiums to compound above CPI over the hold.
Questions for the listing agent
- What do current leases actually rent for vs. the listed asking? Can we see a recent rent roll and the last 12 months of T-12 income?
- It's been on market 51 days. Have you received any prior offers? Is the seller open to a 89% concession, seller financing, or rate buy-down credit?
- Is there a deadline driving the sale (1031 exchange, divorce, estate, relocation)? That informs how much negotiation room exists.
- Schools are A-rated — typically a magnet for longer-tenancy family renters. What's the average tenant stay here, and is there a school-zone premium baked into asking?
- The area grade is low — what's the realistic commute time and amenity access for the typical tenant pool here? Any planned neighborhood developments (good or bad) we should know about?
- What's the average days-on-market for RENTAL listings here right now (not sales)? A rising rental-DOM trend means longer vacancies and softer asking-rent achievability than the comps imply.
- What's the recent tenant-quality profile in this submarket — average credit score on applications, eviction rate, late-payment / NSF rate, and stable-employment percentage? A property-management company in the area should have these aggregated.
- How much new for-sale + rental construction is in the pipeline within 1–3 miles? Heavy new supply typically softens prices + rents 12–24 months out; constrained supply supports both.
Investment metrics
- 1% rule
- 0.11% ✗
- Cap rate
- 0.32%
- Cash-on-cash
- -21.35%
- DSCR
- 0.05
- GRM
- 74.1
CMA / ARV
- ARV (median comp)
- $5,108,729
- List price
- $4,299,000
- Delta
- -15.85%
- Verdict
- UNDERPRICED
- Comps
- 20 within 1.0 mi
Show comp detail 12 sales within ~0.75 mi
| Address | Dist | Beds/Ba | Sqft | Sold | Price | $/sf | Match |
|---|---|---|---|---|---|---|---|
| 8915 N Invergordon Rd | 0.45mi | 5/4.5 | 6,269 (-1%) | 1mo | $2,150,000 | $343 | 74 |
| 9148 N 66th Pl | 0.22mi | 5/6.5 | 6,872 (+8%) | 2mo | $5,900,000 | $859 | 68 |
| 6426 E Turquoise Ave | 0.27mi | 6/6.5 (+1) | 6,521 (+3%) | 7mo | $6,600,000 | $1,012 | 66 |
| 6614 E North Ln | 0.56mi | 5/5.5 | 6,207 (-2%) | 10mo | $4,600,000 | $741 | 60 |
| 6802 E Sunnyvale Rd | 0.68mi | 5/5.5 | 6,388 (+1%) | 9mo | $6,550,000 | $1,025 | 58 |
| 6229 E Gold Dust Ave | 0.47mi | 6/6.5 (+1) | 6,256 (-2%) | 10mo | $5,560,000 | $889 | 56 |
| 10220 N 66th St | 0.40mi | 6/6.5 (+1) | 6,843 (+8%) | 4mo | $6,350,000 | $928 | 54 |
| 6584 E Gold Dust Ave | 0.37mi | 6/5.5 (+1) | 6,872 (+8%) | 12mo | $6,240,000 | $908 | 52 |
| 9151 N Kober Rd | 0.31mi | 6/8.0 (+1) | 7,041 (+11%) | 6mo | $6,300,000 | $895 | 46 |
| 6840 E Sunnyvale Rd | 0.73mi | 6/7.5 (+1) | 6,472 (+2%) | 3mo | $6,515,000 | $1,007 | 46 |
| 10002 N 61st Pl | 0.54mi | 4/4.5 (-1) | 5,504 (-13%) | 8mo | $4,550,000 | $827 | 38 |
| 6701 E Sunnyvale Rd | 0.68mi | 5/7.0 | 7,018 (+10%) | 8mo | $5,300,000 | $755 | 36 |
Match score weights: distance 35% · size 25% · config 20% · recency 20%. Top-matched comps best support the ARV.
Projected returns pro-forma
10.0% appreciation · 8.0% rent growth · sell at horizon
- IRR
- 9.9%
- Equity multiple
- 1.83×
- Total profit
- $1,000,248
- Equity at exit
- $3,872,880
- IRR
- 11.4%
- Equity multiple
- 4.39×
- Total profit
- $4,076,197
- Equity at exit
- $8,352,011
Cash invested: $1,203,720 (down + closing). Projections, not guarantees.
Landlord ↔ Tenant lean methodology
- Overall (STATE)
- 87 Strongly Landlord-Friendly
- State Arizona
- 87 Strongly Landlord-Friendly · R+3
- County
- — inherits STATE
- City
- — inherits STATE
ZIP-level market 85253
- Home prices YoY
- 4.2%
- Rents YoY
- 8.6%
- Active inventory
- 356
- Price-to-rent
- 74.1×
Monthly cashflow live
- Estimated rent
- $4,837 medium interval (Pro) →
- Mortgage (P&I)
- −$22,544
- Tax from tax record
- −$901 /mo · $10,814/yr
- Insurance
- −$1,791
- HOA
- −$0
- Vacancy / Maint / Mgmt
- −$1,016
- Net cashflow
- $-21,416
Break-even live
Sensitivity live
| Price | -10% $-18,982 | -5% $-20,199 | +0% $-21,416 | +5% $-22,633 | +10% $-23,849 |
|---|---|---|---|---|---|
| Rent | -10% $-21,798 | -5% $-21,607 | +0% $-21,416 | +5% $-21,225 | +10% $-21,034 |
| Rate | -1.0pp $-19,251 | -0.5pp $-20,322 | base $-21,416 | +0.5pp $-22,530 | +1.0pp $-23,663 |
UW: 25.0% down · 7.5% · 30yr · 1.5% tax · 5.0% vac · 8.0% maint · 8.0% mgmt
Financing live
Cash to close
- Down payment
- $1,074,750
- Closing costs
- $128,970
- Reserves months
- —
- Total cash needed
- —
Loan-product check · same deal, 3 products live
Conventional
25% down · 7.5% · 30yr
- Down + closing
- —
- Monthly P&I
- —
- Monthly cashflow
- —
- DSCR
- —
- Eligible?
- —
Personal DTI + credit; lowest rate.
DSCR
20% down · 8.5% · 30yr
- Down + closing
- —
- Monthly P&I
- —
- Monthly cashflow
- —
- DSCR
- —
- Eligible?
- —
No personal income docs; deal must DSCR.
Hard money
10% down · 12.0% · 12mo
- Down + closing
- —
- Monthly P&I
- —
- Monthly cashflow
- —
- DSCR
- —
- Eligible?
- —
Short-term bridge; refi at stabilization.
Rent comps 8 comps
| Address | Beds | Baths | Sqft | Rent | $/sqft | DOM | Units | Dist |
|---|---|---|---|---|---|---|---|---|
| 6119 E Gold Dust Ave Paradise Valley, AZ | 5.0 | 5.5 | 5500 | $20,000 | $3.64 | 20d | 1 | 0.64mi |
| 5927 E North Ln Paradise Valley, AZ | 5.0 | 5.0 | 5400 | $13,495 | $2.50 | 26d | 1 | 0.92mi |
| 5927 E North Ln Paradise Valley, AZ | 5.0 | 5.0 | 5400 | $13,495 | $2.50 | 20d | 1 | 0.92mi |
| 10019 N 57th St Paradise Valley, AZ | 6.0 | 9.0 | 6623 | $60,000 | $9.06 | 26d | 1 | 1.03mi |
| 9128 N 55th St Paradise Valley, AZ | 4.0 | 4.5 | 5525 | $45,000 | $8.14 | 26d | 1 | 1.24mi |
| 5353 E Sanna St Paradise Valley, AZ | 5.0 | 5.5 | 6661 | $22,495 | $3.38 | 45d | 1 | 1.39mi |
| 9071 N 53rd Pl Paradise Valley, AZ | 5.0 | 5.5 | 6576 | $21,900 | $3.33 | 20d | 1 | 1.43mi |
| 10620 N Miller Rd Scottsdale, AZ | 5.0 | 6.5 | 8000 | $25,000 | $3.12 | 45d | 1 | 1.49mi |
Listing history 42 events
-
2026-06-21days on market $4,299,000 Active 51 DOM
-
2026-06-18days on market $4,299,000 Active 48 DOM
-
2026-06-17days on market $4,299,000 Active 47 DOM
-
2026-06-16days on market $4,299,000 Active 46 DOM
-
2026-06-15days on market $4,299,000 Active 45 DOM
-
2026-06-13days on market $4,299,000 Active 43 DOM
-
2026-06-13days on market $4,299,000 Active 42 DOM
-
2026-06-09days on market $4,299,000 Active 39 DOM
-
2026-06-08days on market $4,299,000 Active 38 DOM
-
2026-06-07days on market $4,299,000 Active 37 DOM
-
2026-06-04pricedays on market $4,299,000 Active 34 DOM
-
2026-06-03days on market $4,350,000 Active 33 DOM
-
2026-06-02days on market $4,350,000 Active 32 DOM
-
2026-06-01days on market $4,350,000 Active 31 DOM
-
2026-05-31days on market $4,350,000 Active 30 DOM
-
2026-05-01$4,350,000 Active 2094-char remark
-
2026-04-06historical
-
2025-12-01status Active
-
2025-12-01historical
-
2025-11-06price $4,875,000
-
2025-08-28$4,975,000 Active
-
2019-06-15historical
-
2019-01-22price $2,170,000
-
2018-09-30$2,195,000 Active
-
2018-06-30historical
-
2018-05-04price $2,150,000
-
2018-02-21price $2,185,000
-
2018-01-15$2,222,850 Active
-
2016-11-29historical
-
2016-09-22price $2,150,000
-
2016-05-07$2,199,000 Active
-
2011-12-16soldstatus $1,525,000 Closed
-
2011-12-16soldstatus $1,525,000
-
2011-11-08status Pending
-
2011-11-01$1,575,000 Active
-
2011-05-20historical
-
2011-04-26price $1,550,000
-
2011-01-21$1,650,000 Active
-
2009-08-12historical
-
2009-05-12$1,650,000
-
2009-03-12historical
-
2008-12-13$2,290,000
ⓘ Source: listings_history table (triggers on properties + properties_extension) + one-shot
backfill from property_details.listing_events for pre-trigger history.
Tax reassessment forecast AZ · Resets to sale price
- Current annual tax
- $10,814 · $901/mo
- Projected year-2 tax
- $28,373 · $2,364/mo
- Expected delta
- +$17,560/yr (+$1,463/mo · 162.4%)
ⓘ Screening estimate from a state-policy table — verify with the county assessor before closing.
Climate risk First Street
- Flood 1/10 Low FEMA zone X (unshaded) · 0% chance over 30 yrs
- Wildfire 3/10 Moderate
- Heat 8/10 Severe 7 d/yr ≥111°F today · 19 d/yr by 30 yrs out
- Wind 1/10 Low
- Air quality 3/10 Moderate 3 unhealthy d/yr today · 4 by 30 yrs out
Nearby sold comps map
Loading sold comps map…
Walkable amenities ~0.75 mi
Loading nearby amenities…
Taxation est. · year 1
- Rental income
- $58,040
- − Mortgage interest
- −$240,811
- − Property taxes
- −$10,814
- − Insurance
- −$21,495
- − Repairs & maintenance
- −$4,643
- − Management
- −$4,643
- − Depreciation
- −$125,062
- Taxable loss
- −$349,428
- Est. tax savings @ 24.0%
- +$83,863
- After-tax cash flow
- $-173,127/yr
For passive investors: Depreciation is non-cash, so a rental often shows a tax loss while cash-flowing — sheltering income. Rental losses are passive: they offset passive income freely, and up to $25,000/yr can offset ordinary (W-2) income if you actively participate and your MAGI is under $100k (phasing out to $0 by $150k); unused losses carry forward. On sale, claimed depreciation is recaptured at up to 25%, and gains may owe capital-gains tax (a 1031 exchange can defer both). Figures are a year-1 estimate at your 24.0% rate — not tax advice; consult a CPA.
Schools (NCES district)
- District
- Scottsdale Unified District (4240)
- NCES district ID
- 0407570
- Math proficiency
- 53% ▼ -10.00%
- Reading proficiency
- 55% ▼ -8.00%
- Median HH income
- $70,139
- Composite
- 48.02/100
- National rank
- #2196
- State rank
- #30 of 249 in AZ
Livability — Paradise Valley
- Score
- 63/100
- State rank
- #123
- US rank
- #15675
Category grades
Schools grade is shown separately in the Schools card above.
Census & demographics
- Census place
- Paradise Valley, AZ
- County
- Maricopa County · 4,537,380 people
- City population
- 17,904
- Metro
- Phoenix-Mesa-Chandler, AZ
- Population (ZIP)
- 17,904
- Household income
- $184,979
- Rent vs Own
- Severe rent burden
- 298.0
Population outlook (Maricopa County) Hauer SSP2
- Today (2025)
- 4,979,203 people
- By 2030
- 5,378,229 · +8.0%
- By 2040
- 6,156,598 · +23.6%
- By 2050
- 6,872,376 · +38.0%
- By 2075
- 8,401,270 · +68.7%
- By 2100
- 9,247,439 · +85.7%
Race, ethnicity, and origin ACS 2023
- Neighborhood character
- Predominantly White (78%)
- Race & ethnicity
- White 78% Hispanic / Latino 11% Two or more races 9% Asian 5% Pacific Islander 2%
- Hispanic origin (detail)
- Mexican 8%
- Common ancestry
- Scotch-Irish 4% Romanian 3% Slovak 3%
- Foreign-born
- 15% · Canada, China
- Languages at home
- 85% English-only · Spanish 5% Other Indo-European 4% Other Asian/Pacific 2%
Political lean MEDSL · Maricopa
- 2024 margin
- Toss-up / Even · D 47.7% · R 51.2% · Other 1.1%
- 2008→2024 swing
- +7.1pp toward D · 2008: -10.6pp · 2024: -3.5pp
- All cycles
- 2024: R+3.5 2020: D+2.2 2016: R+3.5 2012: R+12.0 2008: R+10.6
Not yet ingested
- Civics
- —
Market trends
- HPI YoY
- ▲ 16.95%
- Current HPI
- 416.0855
- Rent YoY
- ▲ 8.63%
- Metro
- Phoenix-Mesa-Chandler, AZ
- State GDP YoY
- ▲ 4.54%
- F500 in state
- 20
Industry mix (Fortune 500 HQ in AZ)
| Industry | F500 HQs | Revenue |
|---|---|---|
| Technology | 2 | $13B |
|
||
| Mining / Metals | 1 | $23B |
|
||
| Environmental Services | 1 | $16B |
|
||
| Metals / Steel | 1 | $14B |
|
||
| Technology Distribution | 1 | $9B |
|
||
| Homebuilding | 1 | $8B |
|
||
Price history
+87.7% since first listed28 events — show timeline
- 2026-06-04 Price Changed $4,299,000 ARMLS
- 2026-05-01 Listed $4,350,000 ARMLS
- 2026-04-06 Listing Removed — ARMLS
- 2025-12-01 Relisted — ARMLS
- 2025-12-01 Listing Removed — ARMLS
- 2025-11-06 Price Changed $4,875,000 ARMLS
- 2025-08-28 Listed $4,975,000 ARMLS
- 2019-06-15 Listing Removed — ARMLS
- 2019-01-22 Price Changed $2,170,000 ARMLS
- 2018-09-30 Listed $2,195,000 ARMLS
- 2018-06-30 Listing Removed — ARMLS
- 2018-05-04 Price Changed $2,150,000 ARMLS
- 2018-02-21 Price Changed $2,185,000 ARMLS
- 2018-01-15 Listed $2,222,850 ARMLS
- 2016-11-29 Listing Removed — ARMLS
- 2016-09-22 Price Changed $2,150,000 ARMLS
- 2016-05-07 Listed $2,199,000 ARMLS
- 2011-12-16 Sold (Public Records) $1,525,000 Public Records
- 2011-12-16 Sold (MLS) $1,525,000 ARMLS
- 2011-11-08 Pending — ARMLS
- 2011-11-01 Listed $1,575,000 ARMLS
- 2011-05-20 Listing Removed — ARMLS
- 2011-04-26 Price Changed $1,550,000 ARMLS
- 2011-01-21 Listed $1,650,000 ARMLS
- 2009-08-12 Listing Removed — ARMLS
- 2009-05-12 Listed $1,650,000 ARMLS
- 2009-03-12 Listing Removed — ARMLS
- 2008-12-13 Listed $2,290,000 ARMLS
Property tax history
+0.3%/yrLatest (2025): $10,814 · +4.9% YoY. Source: county tax records.
Cash-flow waterfall
monthlySold comps — $/sqft
last 12 mo · ≤1 miLoading sold comps…