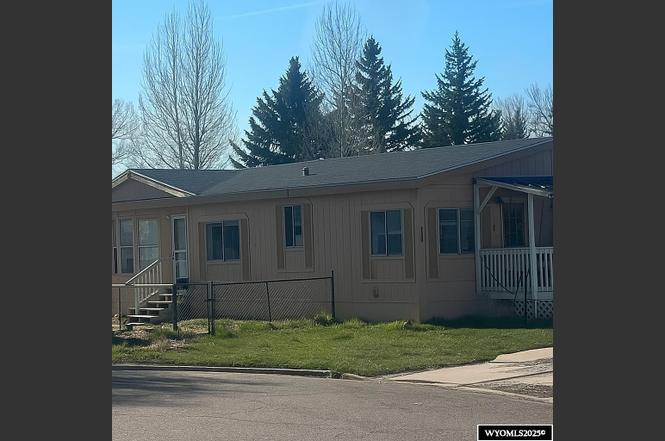
222 Roosevelt Ave · Evanston, WY
Flood risk 3/10 · Minor
- FEMA flood zone
- X (unshaded)
- Chance of flooding over 30 yrs
- 0.09%
- Est. flood insurance / yr
- $507 – $1,088
Fire risk 5/10 · Moderate
- Est. fire insurance / yr
- $564 – $1,046
Heat risk 1/10 · Minimal
- Hot days now (above 86°F)
- 6 days/yr
- Hot days in 30 yrs
- 16 days/yr
Wind risk 1/10 · Minimal
- Chance of severe wind over 30 yrs
- —
Air-quality risk 1/10 · Minimal
- Unhealthy air days now
- 0 days/yr
- Unhealthy air days in 30 yrs
- 0 days/yr
Risk factors via First Street. Map © Google.
Why this score? — see what drove the C- grade
The composite is a weighted blend of 9 inputs, each scored 0–100. Each bar is that input's sub-score; the figure is the points it added to the 100-point composite (weight × sub-score).
- ARV discount +15.0/15.0
- Appreciation +10.0/10.0
- Cash flow +8.8/30.0
- Schools +4.8/10.0
- Livability +3.1/5.0
- Rent growth +2.5/5.0
- Condition / age +2.5/5.0
- DSCR +2.4/10.0
- 1% rule +1.5/10.0
$220,000
🖨 Deal sheet (PDF) 📄 Offer letter ✓ Due diligence
Listing remarks MLS
Charming Home on Large Lot! New paint and extremely clean. Large master bedroom and bath. Great kitchen with island. Lot's of natural sunlight. Oversized yard with mature trees. Home backs up to the park so there are not back neighbors.
Key facts
- 0.33 acre lot
- Built 1991
- Listed 403 days
Property features AI
Exterior
- Parking: No garage
- Utilities: Public water; Public sewer
- Home design: Manufactured home (attached); Residential property
- Construction: Asphalt roof
- Exterior features: Chain link fencing; Shed(s)
Interior
- Kitchen: Dishwasher; Refrigerator; Range; Oven
- Flooring: Carpet
- Heating & cooling: Forced air heating
- Interior features: Dishwasher; Refrigerator; Range; Oven
Neighborhood map
What this means for you Summary
Snapshot
- This is a 3-bed/2.0-bath manufactured listed at $220k.
Deal economics
- At list price, monthly cash flow is $-182 ($-2k/yr) — negative.
- To cash-flow at today's rent, offer at most $188k (14.6% below list).
- To meet the 1% rule (rent ≥ 1% of price), the offer needs to be $144k (34.7% below list).
- Recommended offer: $144k (34.7% below list) — sets the bar for 1% rule.
- Cap rate 5.3% vs local median 2.9% in Evanston — top-decile yield for the area; either an underpriced asset or a hidden risk that comps aren't pricing in. Stress-test before assuming the spread holds.
Location & tenants
- Location reads 61/100 on livability (#112 in WY) — a middle-class / working-renter tenant base. Strengths: cost of living A+, housing A+; Watch: crime C-, amenities F, commute F.
- Uinta County School District #1 (town): math 54% / reading 57% proficiency, ranked #17 of 41 in WY (top 42%) — acceptable for families but not a draw, mixed tenant base, ~2y average lease.
- Zoned schools: North Evanston Elementary (math 57% / reading 52%, grade C, #62 of 151 statewide, top 49%, 308 students, 63% FRL); Evanston Middle School (math 49% / reading 58%, grade C+, #31 of 55 statewide, top 57%, 304 students, 52% FRL); Evanston High School (math 49% / reading 59%, grade C-, #24 of 75 statewide, top 35%, 747 students, 48% FRL) — zoned schools average 54% FRL vs 32% district-wide (22 pts higher); higher-poverty schools than district average — tighter screening recommended.
- Market conditions: 115 active listings in the ZIP; 50 units permitted in Uinta County in 2024 (0 in 5+ unit buildings).
Forward outlook
- In year one you build about $24k of equity ($2k loan paydown + $22k appreciation (10.0% local appreciation)).
- Uinta County population projected at -21% by 2050 — secular population decline; favor cash flow + early exit over multi-decade hold.
- By year 2, paydown + projected appreciation supports a ~$38k cash-out refi (75% LTV) — recoverable capital for the next deal without selling this one.
Negotiation context
- It's been on market 403 days — a 12% lower offer ($194k) is reasonable based on typical stale-listing flexibility.
- 3 sale attempts since 6y ago; this cycle's ask has dropped $80k (27%) from the opening price — seller is motivated, your offer sets the floor, not the list.
Risks & watch-outs
- Climate carrying-cost: moderate wildfire risk — expect insurance premiums to compound above CPI over the hold.
Questions for the listing agent
- What do current leases actually rent for vs. the listed asking? Can we see a recent rent roll and the last 12 months of T-12 income?
- It's been on market 403 days. Have you received any prior offers? Is the seller open to a 35% concession, seller financing, or rate buy-down credit?
- Why hasn't it sold? Are there any deal-killer items the seller is aware of (foundation, flood, title, zoning, code violations)?
- Is there a deadline driving the sale (1031 exchange, divorce, estate, relocation)? That informs how much negotiation room exists.
- What's the average days-on-market for RENTAL listings here right now (not sales)? A rising rental-DOM trend means longer vacancies and softer asking-rent achievability than the comps imply.
- What's the recent tenant-quality profile in this submarket — average credit score on applications, eviction rate, late-payment / NSF rate, and stable-employment percentage? A property-management company in the area should have these aggregated.
- How much new for-sale + rental construction is in the pipeline within 1–3 miles? Heavy new supply typically softens prices + rents 12–24 months out; constrained supply supports both.
Investment metrics
- 1% rule
- 0.65% ✗
- Cap rate
- 5.30%
- Cash-on-cash
- -3.54%
- DSCR
- 0.84
- GRM
- 12.8
CMA / ARV
- ARV (on-the-fly)
- $310,440
- Comps found
- 2
Show comp detail 2 sales within ~0.75 mi
| Address | Dist | Beds/Ba | Sqft | Sold | Price | $/sf | Match |
|---|---|---|---|---|---|---|---|
| 87 1st Ave | 0.49mi | 4/2.0 (+1) | 1,680 (+8%) | 2mo | $210,000 | $125 | 58 |
| 63 & 61 2nd Ave | 0.39mi | 3/2.0 | 1,379 (-12%) | 18mo | $275,000 | $199 | 48 |
Match score weights: distance 35% · size 25% · config 20% · recency 20%. Top-matched comps best support the ARV.
Projected returns pro-forma
10.0% appreciation · 3.0% rent growth · sell at horizon
- IRR
- 21.7%
- Equity multiple
- 2.76×
- Total profit
- $108,146
- Equity at exit
- $198,193
- IRR
- 19.6%
- Equity multiple
- 6.31×
- Total profit
- $327,363
- Equity at exit
- $427,412
Cash invested: $61,600 (down + closing). Projections, not guarantees.
Landlord ↔ Tenant lean methodology
- Overall (STATE)
- 90 Strongly Landlord-Friendly
- State Wyoming
- 90 Strongly Landlord-Friendly · R+25
- County
- — inherits STATE
- City
- — inherits STATE
ZIP-level market 82930
- Home prices YoY
- 4.4%
- Active inventory
- 115
- Price-to-rent
- 12.8×
Monthly cashflow live
- Estimated rent
- $1,437 medium interval (Pro) →
- Mortgage (P&I)
- −$1,154
- Tax from tax record
- −$71 /mo · $856/yr
- Insurance
- −$92
- HOA
- −$0
- Vacancy / Maint / Mgmt
- −$302
- Net cashflow
- $-182
Break-even live
Sensitivity live
| Price | -10% $-57 | -5% $-119 | +0% $-182 | +5% $-244 | +10% $-306 |
|---|---|---|---|---|---|
| Rent | -10% $-295 | -5% $-238 | +0% $-182 | +5% $-125 | +10% $-68 |
| Rate | -1.0pp $-71 | -0.5pp $-126 | base $-182 | +0.5pp $-239 | +1.0pp $-297 |
UW: 25.0% down · 7.5% · 30yr · 1.5% tax · 5.0% vac · 8.0% maint · 8.0% mgmt
Financing live
Cash to close
- Down payment
- $55,000
- Closing costs
- $6,600
- Reserves months
- —
- Total cash needed
- —
Loan-product check · same deal, 3 products live
Conventional
25% down · 7.5% · 30yr
- Down + closing
- —
- Monthly P&I
- —
- Monthly cashflow
- —
- DSCR
- —
- Eligible?
- —
Personal DTI + credit; lowest rate.
DSCR
20% down · 8.5% · 30yr
- Down + closing
- —
- Monthly P&I
- —
- Monthly cashflow
- —
- DSCR
- —
- Eligible?
- —
No personal income docs; deal must DSCR.
Hard money
10% down · 12.0% · 12mo
- Down + closing
- —
- Monthly P&I
- —
- Monthly cashflow
- —
- DSCR
- —
- Eligible?
- —
Short-term bridge; refi at stabilization.
Listing history 32 events
-
2026-06-21days on market $220,000 Active 403 DOM
-
2026-06-21days on market $220,000 Active 402 DOM
-
2026-06-18days on market $220,000 Active 400 DOM
-
2026-06-17days on market $220,000 Active 399 DOM
-
2026-06-16days on market $220,000 Active 398 DOM
-
2026-06-15days on market $220,000 Active 397 DOM
-
2026-06-15days on market $220,000 Active 396 DOM
-
2026-06-13days on market $220,000 Active 395 DOM
-
2026-06-12days on market $220,000 Active 394 DOM
-
2026-06-09days on market $220,000 Active 391 DOM
-
2026-06-08days on market $220,000 Active 390 DOM
-
2026-06-08days on market $220,000 Active 389 DOM
-
2026-06-05days on market $220,000 Active 387 DOM
-
2026-06-04days on market $220,000 Active 386 DOM
-
2026-06-03days on market $220,000 Active 385 DOM
-
2026-06-02days on market $220,000 Active 384 DOM
-
2026-06-01days on market $220,000 Active 383 DOM
-
2026-05-31days on market $220,000 Active 382 DOM
-
2026-05-13status Active
-
2026-02-11price $220,000
-
2025-12-16price $240,000
-
2025-10-28price $250,000
-
2025-08-29price $275,000
-
2025-06-30price $295,000
-
2025-05-02$300,000 Active
-
2021-01-25soldstatus
-
2021-01-20soldstatus 237-char remark
Show marketing remark (237 chars)
Charming Home on Large Lot! New paint and extremely clean. Large master bedroom and bath. Great kitchen with island. Lot's of natural sunlight. Oversized yard with mature trees. Home backs up to the park so there are not back neighbors.
-
2020-12-03$149,000 237-char remark
Show marketing remark (237 chars)
Charming Home on Large Lot! New paint and extremely clean. Large master bedroom and bath. Great kitchen with island. Lot's of natural sunlight. Oversized yard with mature trees. Home backs up to the park so there are not back neighbors.
-
2005-09-09soldstatus
-
2003-05-30soldstatus
-
1997-05-19soldstatus
-
1991-12-16soldstatus
ⓘ Source: listings_history table (triggers on properties + properties_extension) + one-shot
backfill from property_details.listing_events for pre-trigger history.
Tax reassessment forecast WY · Resets to sale price
- Current annual tax
- $856 · $71/mo
- Projected year-2 tax
- $1,342 · $112/mo
- Expected delta
- +$486/yr (+$41/mo · 56.8%)
ⓘ Screening estimate from a state-policy table — verify with the county assessor before closing.
Climate risk First Street
- Flood 3/10 Moderate FEMA zone X (unshaded) · 9% chance over 30 yrs
- Wildfire 5/10 Major
- Heat 1/10 Low 6 d/yr ≥86°F today · 16 d/yr by 30 yrs out
- Wind 1/10 Low
- Air quality 1/10 Low 0 unhealthy d/yr today · 0 by 30 yrs out
Nearby sold comps map
Loading sold comps map…
Walkable amenities ~0.75 mi
Loading nearby amenities…
Taxation est. · year 1
- Rental income
- $17,241
- − Mortgage interest
- −$12,323
- − Property taxes
- −$856
- − Insurance
- −$1,100
- − Repairs & maintenance
- −$1,379
- − Management
- −$1,379
- − Depreciation
- −$6,400
- Taxable loss
- −$6,197
- Est. tax savings @ 24.0%
- +$1,487
- After-tax cash flow
- $-692/yr
For passive investors: Depreciation is non-cash, so a rental often shows a tax loss while cash-flowing — sheltering income. Rental losses are passive: they offset passive income freely, and up to $25,000/yr can offset ordinary (W-2) income if you actively participate and your MAGI is under $100k (phasing out to $0 by $150k); unused losses carry forward. On sale, claimed depreciation is recaptured at up to 25%, and gains may owe capital-gains tax (a 1031 exchange can defer both). Figures are a year-1 estimate at your 24.0% rate — not tax advice; consult a CPA.
Schools (NCES district)
- District
- Uinta County School District #1
- NCES district ID
- 5602760
- Math proficiency
- 54% ▼ -1.00%
- Reading proficiency
- 57% ▲ 2.00%
- Median HH income
- $53,206
- Composite
- 47.65/100
- National rank
- #2247
- State rank
- #17 of 41 in WY
Livability — Evanston
- Score
- 61/100
- State rank
- #112
- US rank
- #17873
Category grades
Schools grade is shown separately in the Schools card above.
Census & demographics
- Census place
- Evanston, WY
- Population (ZIP)
- 14,836
Population outlook (Uinta County) Hauer SSP2
- Today (2025)
- 19,871 people
- By 2030
- 19,106 · -3.8%
- By 2040
- 17,394 · -12.5%
- By 2050
- 15,715 · -20.9%
- By 2075
- 12,193 · -38.6%
- By 2100
- 9,429 · -52.5%
Race, ethnicity, and origin ACS 2023
- Neighborhood character
- Predominantly White (86%)
- Race & ethnicity
- White 86% Hispanic / Latino 11% Two or more races 6%
- Hispanic origin (detail)
- Mexican 7%
- Common ancestry
- Slovak 8% Italian 4% Scottish 3%
- Foreign-born
- 2% · Canada
- Languages at home
- 95% English-only · Spanish 5%
Political lean MEDSL · Uinta
- 2024 margin
- Solid R (+63.7) · D 17.4% · R 81.1% · Other 1.6%
- 2008→2024 swing
- -22.6pp toward R · 2008: -41.1pp · 2024: -63.7pp
- All cycles
- 2024: R+63.7 2020: R+62.8 2016: R+61.5 2012: R+59.0 2008: R+41.1
Not yet ingested
- Civics
- —
Market trends
- HPI YoY
- ▲ 16.96%
- Current HPI
- 401.04
- Rent YoY
- —
- Metro
- —
- State GDP YoY
- —
- F500 in state
- 0
Price history
+47.7% since first listed14 events — show timeline
- 2026-05-13 Relisted — WMLS
- 2026-02-11 Price Changed $220,000 WMLS
- 2025-12-16 Price Changed $240,000 WMLS
- 2025-10-28 Price Changed $250,000 WMLS
- 2025-08-29 Price Changed $275,000 WMLS
- 2025-06-30 Price Changed $295,000 WMLS
- 2025-05-02 Listed $300,000 WMLS
- 2021-01-25 Sold (Public Records) — Public Records
- 2021-01-20 Sold (MLS) — WMLS
- 2020-12-03 Listed $149,000 WMLS
- 2005-09-09 Sold (Public Records) — Public Records
- 2003-05-30 Sold (Public Records) — Public Records
- 1997-05-19 Sold (Public Records) — Public Records
- 1991-12-16 Sold (Public Records) — Public Records
Property tax history
+1.9%/yrLatest (2025): $856 · -21.9% YoY. Source: county tax records.
Cash-flow waterfall
monthlySold comps — $/sqft
last 12 mo · ≤1 miLoading sold comps…