10036 63rd Ave N · Bay Pines, FL
Flood risk 8/10 · Major
- FEMA flood zone
- AE
- Chance of flooding over 30 yrs
- 0.96%
- Est. flood insurance / yr
- $1,737 – $8,500
Fire risk 1/10 · Minimal
- Est. fire insurance / yr
- $947 – $1,759
Heat risk 10/10 · Severe
- Hot days now (above 107°F)
- 7 days/yr
- Hot days in 30 yrs
- 25 days/yr
Wind risk 10/10 · Severe
- Chance of severe wind over 30 yrs
- 99.0%
Air-quality risk 3/10 · Minor
- Unhealthy air days now
- 2 days/yr
- Unhealthy air days in 30 yrs
- 2 days/yr
Risk factors via First Street. Map © Google.
Why this score? — see what drove the B- grade
The composite is a weighted blend of 9 inputs, each scored 0–100. Each bar is that input's sub-score; the figure is the points it added to the 100-point composite (weight × sub-score).
- Cash flow +30.0/30.0
- DSCR +10.0/10.0
- 1% rule +9.4/10.0
- ARV discount +7.5/15.0
- Schools +4.3/10.0
- Livability +4.0/5.0
- Rent growth +2.1/5.0
- Condition / age +1.0/5.0
- Appreciation +0.0/10.0
$114,900
🖨 Deal sheet 📄 Offer letter ✓ Due diligence
Listing remarks MLS
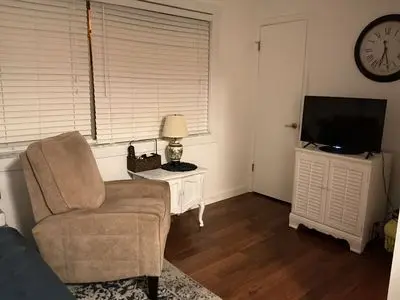
Great unit with updated kitchen! Cabinets and appliances white. Recently painted and ready. Bathroom also updated with white pedstal sink. Air handler also replaced. Corian counter and sink in kitchen. Furnishings available too.
Key facts
- New air conditioning
- New floors
- New kitchen
Tags
Property features AI
Exterior
- Home design: Built in 1983
- Construction: Originally constructed in 1983
- Exterior features: Located in the South Pinellas Community Council subdivision
Neighborhood map
What this means for you Summary
Snapshot
- This is a 1-bed/1.0-bath single-family listed at $115k. Condition is rated poor.
Deal economics
- At list price, monthly cash flow is $87 ($1k/yr) — positive.
- The deal already cash-flows at list — no discount required.
- Meets the 1% rule at list price ($2k rent vs $115k).
- Recommended offer: $111k (3.0% below list) — sets the bar for market timing.
- Cap rate 11.7% vs local median 2.7% in Bay Pines — top-decile yield for the area; either an underpriced asset or a hidden risk that comps aren't pricing in. Stress-test before assuming the spread holds.
Location & tenants
- Location reads 81/100 on livability (#102 in FL, #1,559 nationally) — a professional / high-income tenant draw. Strengths: crime A+, housing A+, health & safety A+; Watch: amenities F.
- Pinellas (suburban): math 51% / reading 51% proficiency, ranked #31 of 73 in FL (top 42%) — acceptable for families but not a draw, mixed tenant base, ~2y average lease.
- Market conditions: Rents soft (-1.8%/yr); 565 active listings in the ZIP; 26 comparable units currently listed for rent nearby; rentals at typical pace (median 18d on market — plan ~3-4 weeks tenant-placement turnaround); solid renter incomes; 2,676 units permitted in Pinellas County in 2024 (1,422 in 5+ unit buildings).
Forward outlook
- Local home prices are declining (-3.0%/yr); year-one equity from $794 of loan paydown is wiped out by about $3k of value loss. Plan a longer hold.
- Pinellas County population projected at +14% by 2050 — modest demand growth; plan on rents tracking national, not racing it.
Negotiation context
- It's been on market 37 days — a 3% lower offer ($111k) is reasonable based on typical stale-listing flexibility.
- 2 sale attempts since 20y ago with the ask held roughly flat each time — persistent listings suggest the price (not the market) is what's stuck; bring a comps-based counter.
Risks & watch-outs
- Watch-outs: flood insurance adds $427/mo.
- Climate carrying-cost: in FEMA flood zone AE (mandatory federal flood insurance); severe wind risk, 99% chance of damaging wind over 30y; extreme-heat days projected 7→25/yr by 2055 (HVAC capex compounding) — expect insurance premiums to compound above CPI over the hold.
Questions for the listing agent
- It's been on market 37 days. Have you received any prior offers? Is the seller open to a 3% concession, seller financing, or rate buy-down credit?
- Have any recent inspections been done? Can we get a copy of the seller's disclosures and any deferred-maintenance estimates?
- What's the actual annual flood-insurance premium (NFIP or private), and is the property in a SFHA with mandatory coverage?
- Is there a deadline driving the sale (1031 exchange, divorce, estate, relocation)? That informs how much negotiation room exists.
- What's the average days-on-market for RENTAL listings here right now (not sales)? A rising rental-DOM trend means longer vacancies and softer asking-rent achievability than the comps imply.
- What's the recent tenant-quality profile in this submarket — average credit score on applications, eviction rate, late-payment / NSF rate, and stable-employment percentage? A property-management company in the area should have these aggregated.
- How much new for-sale + rental construction is in the pipeline within 1–3 miles? Heavy new supply typically softens prices + rents 12–24 months out; constrained supply supports both.
Investment metrics
- 1% rule
- 1.44% ✓
- Cap rate
- 11.65%
- Cash-on-cash
- 19.14%
- DSCR
- 1.85
- GRM
- 5.8
CMA / ARV
- ARV (on-the-fly)
- $236,210
- Comps found
- 6
Show comp detail 6 sales within ~0.75 mi
| Address | Dist | Beds/Ba | Sqft | Sold | Price | $/sf | Match |
|---|---|---|---|---|---|---|---|
| 6301 Gem Ln | 0.15mi | 2/2.0 (+1) | 792 (+0%) | 6mo | $278,000 | $351 | 79 |
| 6542 Gem Ln | 0.21mi | 2/1.0 (+1) | 672 (-15%) | 4mo | $175,500 | $261 | 57 |
| 9717 54th Ave N | 0.62mi | 2/1.0 (+1) | 879 (+11%) | 4mo | $340,000 | $387 | 44 |
| 10460 54th Ave N | 0.68mi | 2/2.0 (+1) | 870 (+10%) | 13mo | $260,000 | $299 | 31 |
| 6580 Seminole Blvd #514 | 0.73mi | 2/1.5 (+1) | 732 (-7%) | 23mo | $135,000 | $184 | 27 |
| 6580 Seminole Blvd #605 | 0.73mi | 2/1.0 (+1) | 684 (-13%) | 22mo | $57,500 | $84 | 20 |
Match score weights: distance 35% · size 25% · config 20% · recency 20%. Top-matched comps best support the ARV.
Projected returns pro-forma
-3.0% appreciation · 0.0% rent growth · sell at horizon
- IRR
- -16.1%
- Equity multiple
- 0.45×
- Total profit
- $-17,660
- Equity at exit
- $17,132
- IRR
- -18.8%
- Equity multiple
- 0.20×
- Total profit
- $-25,844
- Equity at exit
- $9,934
Cash invested: $32,172 (down + closing). Projections, not guarantees.
Landlord ↔ Tenant lean methodology
- Overall (STATE)
- 87 Strongly Landlord-Friendly
- State Florida
- 87 Strongly Landlord-Friendly · R+3
- County
- — inherits STATE
- City
- — inherits STATE
ZIP-level market 33708
- Rents YoY
- -1.8%
- Active inventory
- 565
- Price-to-rent
- 5.8×
Monthly cashflow live
- Estimated rent
- $1,655 high interval (Pro) →
- Mortgage (P&I)
- −$603
- Tax est. 1.5%
- −$144 /mo · $1,724/yr
- Insurance
- −$48
- Flood insurance flood zone
- −$427 /mo · $5,118/yr
- HOA
- −$0
- Vacancy / Maint / Mgmt
- −$348
- Net cashflow
- $87
Break-even live
UW: 25.0% down · 7.5% · 30yr · 1.5% tax · 5.0% vac · 8.0% maint · 8.0% mgmt
Financing live
Cash to close
- Down payment
- $28,725
- Closing costs
- $3,447
- Reserves months
- —
- Total cash needed
- —
Loan-product check · same deal, 3 products live
Conventional
25% down · 7.5% · 30yr
- Down + closing
- —
- Monthly P&I
- —
- Monthly cashflow
- —
- DSCR
- —
- Eligible?
- —
Personal DTI + credit; lowest rate.
DSCR
20% down · 8.5% · 30yr
- Down + closing
- —
- Monthly P&I
- —
- Monthly cashflow
- —
- DSCR
- —
- Eligible?
- —
No personal income docs; deal must DSCR.
Hard money
10% down · 12.0% · 12mo
- Down + closing
- —
- Monthly P&I
- —
- Monthly cashflow
- —
- DSCR
- —
- Eligible?
- —
Short-term bridge; refi at stabilization.
Rent comps 26 comps
| Address | Beds | Baths | Sqft | Rent | $/sqft | DOM | Units | Dist |
|---|---|---|---|---|---|---|---|---|
| 10037 62nd Ter N #15 Saint Petersburg, FL | 2.0 | 1.0 | 790 | $1,400 | $1.77 | 17d | 1 | 0.02mi |
| 10036 63rd Ave N #23 Saint Petersburg, FL | 2.0 | 1.0 | 1010 | $1,550 | $1.53 | 16d | 1 | 0.02mi |
| 10037 62nd Ter St. Petersburg, FL | 1.0 | 1.0 | 790 | $1,500 | $1.90 | 24d | 1 | 0.02mi |
| 10035 63rd Ave N #18 Saint Petersburg, FL | 2.0 | 1.0 | 1010 | $2,125 | $2.10 | 24d | 1 | 0.04mi |
| 10038 62nd Ter N #17 Saint Petersburg, FL | 2.0 | 1.0 | 1010 | $1,400 | $1.39 | 2d | 1 | 0.06mi |
| 10032 65th Ave N #24 Saint Petersburg, FL | 2.0 | 2.0 | 1010 | $1,650 | $1.63 | 24d | 1 | 0.09mi |
| 9950 62nd Ter N #305 Saint Petersburg, FL | 2.0 | 2.0 | 1120 | $1,450 | $1.29 | 24d | 1 | 0.11mi |
| 9860 62nd Ter N #1048 Saint Petersburg, FL | 2.0 | 2.0 | 1020 | $1,750 | $1.72 | 24d | 1 | 0.16mi |
| 10405 Addison Way Seminole, FL | 1.0–3.0 | 1.0–2.0 | 1133 | $1,807 | $1.59 | 1d | 18 | 0.39mi |
| 10530 68th Ave Seminole, FL | 2.0 | 1.0 | 1000 | $1,690 | $1.69 | 4d | 1 | 0.48mi |
| 5224 100th Way N Saint Petersburg, FL | 2.0 | 1.0 | 930 | $2,400 | $2.58 | 4d | 1 | 0.72mi |
| 9950 52nd Ter N Saint Petersburg, FL | 2.0 | 1.0 | 1090 | $2,200 | $2.02 | 24d | 1 | 0.72mi |
| 10764 70th Ave Seminole, FL | 1.0–2.0 | 1.0–2.0 | 828 | $1,500 | $1.81 | 4d | 2 | 0.75mi |
| 10532 51st Ter N Saint Petersburg, FL | 2.0 | 1.0 | 1093 | $1,800 | $1.65 | 17d | 1 | 0.88mi |
| 4652 Miramar Dr Madeira Beach, FL | 1.0–2.0 | 1.0–2.0 | 958 | $1,660 | $1.73 | 1d | 33 | 1.00mi |
| 11234 68th Ave Seminole, FL | 2.0 | 1.5 | 960 | $2,400 | $2.50 | 7d | 1 | 1.02mi |
| 4771 100th Way N Unit 101 St. Petersburg, FL | 2.0 | 1.0 | 800 | $1,749 | $2.19 | 17d | 1 | 1.03mi |
| 4771 100th Way N Unit 204 St. Petersburg, FL | 1.0 | 1.0 | 550 | $1,549 | $2.82 | 24d | 1 | 1.03mi |
| 9940 47th Ave N #320 Saint Petersburg, FL | 2.0 | 1.0 | 900 | $1,575 | $1.75 | 24d | 1 | 1.07mi |
| 7770 Starkey Rd Seminole, FL | 2.0 | 1.0 | 1035 | $1,538 | $1.49 | 1d | 4 | 1.20mi |
| 9071 47th Ave N St. Petersburg, FL | 2.0 | 2.0 | 1100 | $2,000 | $1.82 | 24d | 1 | 1.27mi |
| 7701 Starkey Rd Largo, FL | 1.0 | 1.0 | 615 | $1,600 | $2.60 | 14d | 5 | 1.33mi |
| 1 Boca Ciega Point Blvd #115 Saint Petersburg, FL | 2.0 | 2.0 | 920 | $1,900 | $2.07 | 1d | 1 | 1.35mi |
| 8080 112th St #108 Seminole, FL | 1.0 | 1.0 | 874 | $1,700 | $1.95 | 24d | 1 | 1.43mi |
| 11201 80th Ave #303 Seminole, FL | 2.0 | 2.0 | 1000 | $1,800 | $1.80 | 24d | 1 | 1.45mi |
| 4565 Duhme Rd #110 Saint Petersburg, FL | 2.0 | 1.0 | 780 | $1,700 | $2.18 | 24d | 1 | 1.48mi |
Listing history 15 events
-
2026-06-18days on market $114,900 Active 37 DOM
-
2026-06-17days on market $114,900 Active 36 DOM
-
2026-06-16days on market $114,900 Active 35 DOM
-
2026-06-15days on market $114,900 Active 34 DOM
-
2026-06-13days on market $114,900 Active 32 DOM
-
2026-06-09days on market $114,900 Active 28 DOM
-
2026-06-08days on market $114,900 Active 27 DOM
-
2026-06-07days on market $114,900 Active 26 DOM
-
2026-06-04days on market $114,900 Active 23 DOM
-
2026-06-03days on market $114,900 Active 22 DOM
-
2026-06-01days on market $114,900 Active 20 DOM
-
2026-05-31days on market $114,900 Active 19 DOM
-
2026-05-12$114,900 Active
-
2007-01-31soldstatus $116,000 229-char remark
Show marketing remark (229 chars)
Great unit with updated kitchen! Cabinets and appliances white. Recently painted and ready. Bathroom also updated with white pedstal sink. Air handler also replaced. Corian counter and sink in kitchen. Furnishings available too.
-
2006-05-30$119,000 229-char remark
Show marketing remark (229 chars)
Great unit with updated kitchen! Cabinets and appliances white. Recently painted and ready. Bathroom also updated with white pedstal sink. Air handler also replaced. Corian counter and sink in kitchen. Furnishings available too.
ⓘ Source: listings_history table (triggers on properties + properties_extension) + one-shot
backfill from property_details.listing_events for pre-trigger history.
Climate risk First Street
- Flood 8/10 Severe FEMA zone AE · 96% chance over 30 yrs
- Wildfire 1/10 Low
- Heat 10/10 Extreme 7 d/yr ≥107°F today · 25 d/yr by 30 yrs out
- Wind 10/10 Extreme 99% chance of damaging wind over 30 yrs
- Air quality 3/10 Moderate 2 unhealthy d/yr today · 2 by 30 yrs out
Nearby sold comps map
Loading sold comps map…
Walkable amenities ~0.75 mi
Loading nearby amenities…
Taxation est. · year 1
- Rental income
- $19,857
- − Mortgage interest
- −$6,436
- − Property taxes
- −$1,724
- − Insurance
- −$5,693
- − Repairs & maintenance
- −$1,589
- − Management
- −$1,589
- − Depreciation
- −$3,343
- Taxable loss
- −$515
- Est. tax savings @ 24.0%
- +$124
- After-tax cash flow
- $1,164/yr
For passive investors: Depreciation is non-cash, so a rental often shows a tax loss while cash-flowing — sheltering income. Rental losses are passive: they offset passive income freely, and up to $25,000/yr can offset ordinary (W-2) income if you actively participate and your MAGI is under $100k (phasing out to $0 by $150k); unused losses carry forward. On sale, claimed depreciation is recaptured at up to 25%, and gains may owe capital-gains tax (a 1031 exchange can defer both). Figures are a year-1 estimate at your 24.0% rate — not tax advice; consult a CPA.
Condition & rehab AI · 0 photos
This home requires extensive repairs and updates to bring it up to a livable condition. Significant structural and cosmetic issues need addressing to increase its resale and rental value.
Repairs flagged
- Major Kitchen cabinets — The cabinets are visibly damaged and need to be replaced.
- Major Kitchen countertops — The countertops are damaged and need to be replaced.
- Major Bathroom — The bathroom requires significant repairs and updates.
- Major Roof — The roof is in poor condition and needs to be replaced.
- Major Exterior siding — The siding is peeling and damaged, requiring replacement.
- Major Flooring — The flooring is damaged and needs to be replaced.
- Major Interior walls — The walls show significant damage and need to be repaired and repainted.
- Major HVAC system — The HVAC system is in poor condition and needs to be replaced or repaired.
Value-add opportunities
- Resale New kitchen cabinets and countertops — A new kitchen will attract more buyers and increase the home's resale value.
- Resale New bathroom fixtures and tiling — A new bathroom will significantly improve the home's appeal and increase its resale value.
- Resale New roof and siding — A new roof and siding will address major structural issues and improve the home's curb appeal.
- Resale New flooring — New flooring will improve the home's appearance and increase its resale value.
- Resale Repainting interior walls — Repainting interior walls will improve the home's appearance and increase its resale value.
- Resale New HVAC system — A new HVAC system will improve the home's comfort and energy efficiency, increasing its resale value.
- Both Landscaping and curb appeal — Landscaping and curb appeal will improve the home's exterior and increase its resale and rental value.
Renovation cost estimate screening
| Repair item | Severity | Est. cost |
|---|---|---|
| Kitchen cabinets · The cabinets are visibly damaged and need to be replaced. | Major | $15,000–50,000 |
| Kitchen countertops · The countertops are damaged and need to be replaced. | Major | $15,000–50,000 |
| Bathroom · The bathroom requires significant repairs and updates. | Major | $15,000–50,000 |
| Roof · The roof is in poor condition and needs to be replaced. | Major | $15,000–50,000 |
| Exterior siding · The siding is peeling and damaged, requiring replacement. | Major | $15,000–50,000 |
| Flooring · The flooring is damaged and needs to be replaced. | Major | $15,000–50,000 |
| Interior walls · The walls show significant damage and need to be repaired and repainted. | Major | $15,000–50,000 |
| HVAC system · The HVAC system is in poor condition and needs to be replaced or repaired. | Major | $15,000–50,000 |
| Total estimated repair cost · 8 items | $120,000–400,000 |
Value-add ROI direction
- Resale New kitchen cabinets and countertops — A new kitchen will attract more buyers and increase the home's resale value. ↑
- Resale New bathroom fixtures and tiling — A new bathroom will significantly improve the home's appeal and increase its resale value. ↑
- Resale New roof and siding — A new roof and siding will address major structural issues and improve the home's curb appeal. ↑
- Resale New flooring — New flooring will improve the home's appearance and increase its resale value. ↑
- Resale Repainting interior walls — Repainting interior walls will improve the home's appearance and increase its resale value. ↑
- Resale New HVAC system — A new HVAC system will improve the home's comfort and energy efficiency, increasing its resale value. ↑
- Both Landscaping and curb appeal — Landscaping and curb appeal will improve the home's exterior and increase its resale and rental value. ↑
ⓘ Cost ranges are severity-bucket heuristics (US national rule-of-thumb). Get contractor quotes + a written scope before underwriting a rehab budget.
Schools (NCES district)
- District
- Pinellas
- NCES district ID
- 1201560
- Math proficiency
- 51% ▼ -5.00%
- Reading proficiency
- 51% ▼ -3.00%
- Median HH income
- $46,270
- Composite
- 43.27/100
- National rank
- #3046
- State rank
- #31 of 73 in FL
Livability — Bay Pines
- Score
- 81/100
- State rank
- #102
- US rank
- #1559
Category grades
Schools grade is shown separately in the Schools card above.
Census & demographics
- Census place
- Bay Pines, FL
- County
- Pinellas County · 939,478 people
- City population
- 68
- Metro
- Tampa-St. Petersburg-Clearwater, FL
- Population (ZIP)
- 15,060
- Household income
- $82,500
- Rent vs Own
- Severe rent burden
- 734.0
Population outlook (Pinellas County) Hauer SSP2
- Today (2025)
- 1,027,532 people
- By 2030
- 1,063,586 · +3.5%
- By 2040
- 1,125,020 · +9.5%
- By 2050
- 1,168,637 · +13.7%
- By 2075
- 1,265,188 · +23.1%
- By 2100
- 1,260,357 · +22.7%
Race, ethnicity, and origin ACS 2023
- Neighborhood character
- Predominantly White (87%)
- Race & ethnicity
- White 87% Hispanic / Latino 5% Asian 4% Two or more races 4% Black 1%
- Common ancestry
- Romanian 4% Lithuanian 3% Italian 3%
- Foreign-born
- 10% · Canada, Vietnam, Jamaica
- Languages at home
- 89% English-only · Spanish 3% Vietnamese 2% Russian/Polish/Slavic 2%
Political lean MEDSL · Pinellas
- 2024 margin
- Lean R (+5.2) · D 46.9% · R 52.1%
- 2008→2024 swing
- -13.5pp toward R · 2008: 8.3pp · 2024: -5.2pp
- All cycles
- 2024: R+5.2 2020: D+0.2 2016: R+1.1 2012: D+5.6 2008: D+8.3
Not yet ingested
- Civics
- —
Market trends
- HPI YoY
- ▼ -663.41%
- Current HPI
- 317.0675
- Rent YoY
- ▼ -1.77%
- Metro
- Tampa-St. Petersburg-Clearwater, FL
- State GDP YoY
- ▲ 3.28%
- F500 in state
- 36
Industry mix (Fortune 500 HQ in FL)
| Industry | F500 HQs | Revenue |
|---|---|---|
| Industrial Technology | 2 | $29B |
|
||
| Insurance | 2 | $17B |
|
||
| Retail | 1 | $60B |
|
||
| Technology Distribution | 1 | $58B |
|
||
| Homebuilding | 1 | $35B |
|
||
| Technology Manufacturing | 1 | $35B |
|
||
Price history
-3.4% since first listed3 events — show timeline
- 2026-05-12 Listed $114,900 FSBO.com
- 2007-01-31 Sold (MLS) $116,000 Stellar MLS as Distributed by MLS Grid
- 2006-05-30 Listed $119,000 Stellar MLS as Distributed by MLS Grid
Cash-flow waterfall
monthlySold comps — $/sqft
last 12 mo · ≤1 miLoading sold comps…