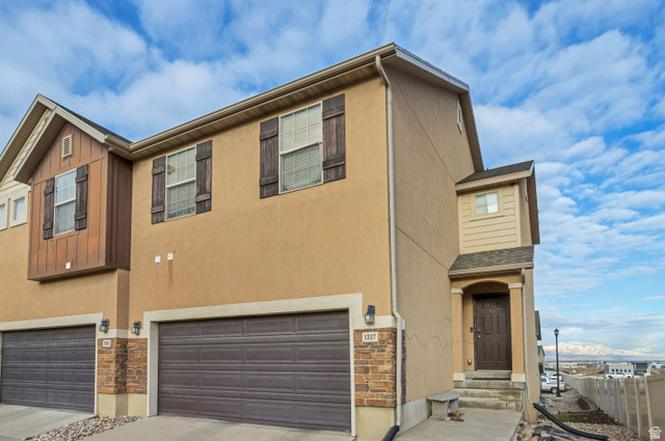
1327 Lily Pad Dr · Spanish Fork, UT
Flood risk 1/10 · Minimal
- FEMA flood zone
- X (unshaded)
- Chance of flooding over 30 yrs
- 0.0%
- Est. flood insurance / yr
- $473 – $860
Fire risk 3/10 · Minor
- Est. fire insurance / yr
- $453 – $841
Heat risk 5/10 · Moderate
- Hot days now (above 95°F)
- 7 days/yr
- Hot days in 30 yrs
- 20 days/yr
Wind risk 1/10 · Minimal
- Chance of severe wind over 30 yrs
- —
Air-quality risk 5/10 · Moderate
- Unhealthy air days now
- 8 days/yr
- Unhealthy air days in 30 yrs
- 8 days/yr
Risk factors via First Street. Map © Google.
Why this score? — see what drove the F grade
The composite is a weighted blend of 9 inputs, each scored 0–100. Each bar is that input's sub-score; the figure is the points it added to the 100-point composite (weight × sub-score).
- ARV discount +7.5/15.0
- Cash flow +4.8/30.0
- Livability +4.2/5.0
- Schools +3.5/10.0
- Rent growth +3.4/5.0
- Condition / age +2.5/5.0
- 1% rule +0.0/10.0
- DSCR +0.0/10.0
- Appreciation +0.0/10.0
$399,900
🖨 Deal sheet 📄 Offer letter ✓ Due diligence
Listing remarks
Welcome to 1327 N Lily Pad Dr! This end unit townhome has 5 bedrooms, 2 bathrooms, and a big master bedroom with ample closet space. Stainless steel appliances in the kitchen. Shopping areas within walking distance and conveniently located near the freeway and hospital, this residence also features 2 additional basement bedrooms for flexible use with a dedicated storage area. With its low HOA fee and perfect blend of mountain proximity and everyday convenience, it is an opportunity not to be missed. Schedule your showing today.
Key facts
- End unit townhome
- Mountain proximity
- Low hoa fee
Tags
Property features AI
Finance
- HOA & community: Homeowners association present; Monthly HOA fee of $110; HOA covers grounds maintenance; Community amenities include maintenance, playground, and snow removal
Exterior
- Parking: 2 total parking spaces; 2 covered parking spaces; 2-car garage
- Utilities: Natural gas connected; Electricity connected; Water connected; Sewer connected
- Home design: Townhouse, row-end; Property is built and standing; Has a view
- Construction: Stucco construction; Asphalt roof; Full basement
- Exterior features: Double-pane windows; Open porch; Sliding glass doors; Mountain view; Full landscaping; Automatic full sprinkler system; Sidewalks and paved road access; Corner lot
Interior
- Kitchen: Microwave; Refrigerator
- Bedrooms: Total rooms: 11 (includes bedrooms and other rooms); Basement is finished (approximately 90% finished)
- Flooring: Carpet; Laminate; Linoleum
- Bathrooms: 2 full bathrooms; 1 partial/half bathroom
- Heating & cooling: Gas central heating; Central air conditioning
- Interior features: Primary bathroom; Garbage disposal; Blinds on full windows
- Laundry & utility: Electric dryer hookup
Neighborhood map
What this means for you Summary
Snapshot
- This is a 3-bed/3.5-bath townhouse listed at $400k.
Deal economics
- At list price, monthly cash flow is $-974 ($-12k/yr) — negative.
- To cash-flow at today's rent, offer at most $228k (43.0% below list).
- To meet the 1% rule (rent ≥ 1% of price), the offer needs to be $197k (50.6% below list).
- Recommended offer: $197k (50.6% below list) — sets the bar for 1% rule.
Location & tenants
- Location reads 83/100 on livability (#26 in UT, #1,012 nationally) — a professional / high-income tenant draw. Strengths: crime A+, commute A+, employment A+; Watch: cost of living C-, amenities F.
- Nebo District (suburban): math 38% / reading 40% proficiency, ranked #45 of 80 in UT (top 56%) — families likely to look elsewhere, expect single-tenant / working-renter base with shorter leases.
- Zoned schools: Rees School (math 43% / reading 33%, grade F, #349 of 585 statewide, top 60%, 641 students, 31% FRL); Diamond Fork Middle (1,039 students, 25% FRL); Maple Mountain High (math 35% / reading 55%, grade D-, #43 of 171 statewide, top 25%, 1,740 students, 10% FRL).
- Market conditions: Rents rising (+3.6%/yr); 561 active listings in the ZIP; 7 comparable units currently listed for rent nearby; rentals at typical pace (median 15d on market — plan ~3-4 weeks tenant-placement turnaround); solid renter incomes; 6,326 units permitted in Utah County in 2024 (1,053 in 5+ unit buildings).
Forward outlook
- Local home prices are declining (-3.0%/yr); year-one equity from $3k of loan paydown is wiped out by about $12k of value loss. Plan a longer hold.
- Utah County population projected at +49% by 2050 — long-run rental-demand tailwind backs the buy-and-hold thesis.
Negotiation context
- It's been on market 148 days — a 12% lower offer ($352k) is reasonable based on typical stale-listing flexibility.
- 8 sale attempts since 16y ago with the ask held roughly flat each time — persistent listings suggest the price (not the market) is what's stuck; bring a comps-based counter.
Risks & watch-outs
- Climate carrying-cost: extreme-heat days projected 7→20/yr by 2055 (HVAC capex compounding) — expect insurance premiums to compound above CPI over the hold.
Questions for the listing agent
- What do current leases actually rent for vs. the listed asking? Can we see a recent rent roll and the last 12 months of T-12 income?
- It's been on market 148 days. Have you received any prior offers? Is the seller open to a 51% concession, seller financing, or rate buy-down credit?
- What does the HOA fee cover, when was the last increase, and are there any pending special assessments or reserve-fund shortfalls?
- Why hasn't it sold? Are there any deal-killer items the seller is aware of (foundation, flood, title, zoning, code violations)?
- Is there a deadline driving the sale (1031 exchange, divorce, estate, relocation)? That informs how much negotiation room exists.
- Schools are B-rated — typically a magnet for longer-tenancy family renters. What's the average tenant stay here, and is there a school-zone premium baked into asking?
- The area grade is low — what's the realistic commute time and amenity access for the typical tenant pool here? Any planned neighborhood developments (good or bad) we should know about?
- What's the average days-on-market for RENTAL listings here right now (not sales)? A rising rental-DOM trend means longer vacancies and softer asking-rent achievability than the comps imply.
- What's the recent tenant-quality profile in this submarket — average credit score on applications, eviction rate, late-payment / NSF rate, and stable-employment percentage? A property-management company in the area should have these aggregated.
- How much new for-sale + rental construction is in the pipeline within 1–3 miles? Heavy new supply typically softens prices + rents 12–24 months out; constrained supply supports both.
Investment metrics
- 1% rule
- 0.49% ✗
- Cap rate
- 3.37%
- Cash-on-cash
- -10.44%
- DSCR
- 0.54
- GRM
- 16.9
CMA / ARV
No comps found within radius.
Projected returns pro-forma
-3.0% appreciation · 3.59% rent growth · sell at horizon
- IRR
- -34.7%
- Equity multiple
- -0.12×
- Total profit
- $-125,780
- Equity at exit
- $59,626
- IRR
- -42.1%
- Equity multiple
- -0.65×
- Total profit
- $-184,979
- Equity at exit
- $34,576
Cash invested: $111,972 (down + closing). Projections, not guarantees.
Landlord ↔ Tenant lean methodology
- Overall (STATE)
- 86 Strongly Landlord-Friendly
- State Utah
- 86 Strongly Landlord-Friendly · R+15
- County
- — inherits STATE
- City
- — inherits STATE
ZIP-level market 84660
- Home prices YoY
- -34.6%
- Rents YoY
- 3.6%
- Active inventory
- 561
- Price-to-rent
- 16.9×
Monthly cashflow live
- Estimated rent
- $1,974 high interval (Pro) →
- Mortgage (P&I)
- −$2,097
- Tax from tax record
- −$160 /mo · $1,918/yr
- Insurance
- −$167
- HOA
- −$110
- Vacancy / Maint / Mgmt
- −$415
- Net cashflow
- $-974
Break-even live
UW: 25.0% down · 7.5% · 30yr · 1.5% tax · 5.0% vac · 8.0% maint · 8.0% mgmt
Financing live
Cash to close
- Down payment
- $99,975
- Closing costs
- $11,997
- Reserves months
- —
- Total cash needed
- —
Loan-product check · same deal, 3 products live
Conventional
25% down · 7.5% · 30yr
- Down + closing
- —
- Monthly P&I
- —
- Monthly cashflow
- —
- DSCR
- —
- Eligible?
- —
Personal DTI + credit; lowest rate.
DSCR
20% down · 8.5% · 30yr
- Down + closing
- —
- Monthly P&I
- —
- Monthly cashflow
- —
- DSCR
- —
- Eligible?
- —
No personal income docs; deal must DSCR.
Hard money
10% down · 12.0% · 12mo
- Down + closing
- —
- Monthly P&I
- —
- Monthly cashflow
- —
- DSCR
- —
- Eligible?
- —
Short-term bridge; refi at stabilization.
Rent comps 7 comps
| Address | Beds | Baths | Sqft | Rent | $/sqft | DOM | Units | Dist |
|---|---|---|---|---|---|---|---|---|
| 1721 Willow Way Spanish Fork, UT | 3.0 | 2.0 | 1620 | $2,000 | $1.23 | 23d | 1 | 0.08mi |
| 1295 Spanish Fork, UT | 3.0 | 1.0–2.0 | 944 | $1,859 | $1.97 | 11d | 1 | 0.14mi |
| 2008 E Chariot Ln Spanish Fork, UT | 2.0 | 1.0 | 1200 | $1,295 | $1.08 | 14d | 1 | 0.29mi |
| 567 N 880 E #5 Spanish Fork, UT | 3.0 | 1.0 | 1040 | $1,199 | $1.15 | 23d | 1 | 1.09mi |
| 567 N 880 East St Unit 6 Spanish Fork, UT | 3.0 | 1.0 | 1040 | $1,149 | $1.10 | 21d | 1 | 1.09mi |
| 934 E 500 N Spanish Fork, UT | 2.0 | 1.0 | 950 | $1,450 | $1.53 | 14d | 1 | 1.09mi |
| 61 Southgate Loop Spanish Fork, UT | 3.0 | 2.0 | 1287 | $1,700 | $1.32 | 14d | 1 | 1.23mi |
HOA detail
- Monthly dues
- $110 · $1,320/yr
Listing history 37 events
-
2026-06-18days on market $399,900 Active 148 DOM
-
2026-06-17days on market $399,900 Active 147 DOM
-
2026-06-16days on market $399,900 Active 146 DOM
-
2026-06-15days on market $399,900 Active 145 DOM
-
2026-06-14days on market $399,900 Active 143 DOM
-
2026-06-10days on market $399,900 Active 140 DOM
-
2026-06-09days on market $399,900 Active 139 DOM
-
2026-06-08days on market $399,900 Active 138 DOM
-
2026-06-07days on market $399,900 Active 137 DOM
-
2026-06-03days on market $399,900 Active 133 DOM
-
2026-06-02days on market $399,900 Active 132 DOM
-
2026-06-01days on market $399,900 Active 131 DOM
-
2026-05-31days on market $399,900 Active 130 DOM
-
2026-05-31days on market $399,900 Active 129 DOM
-
2026-03-07price $399,900
-
2026-01-21$410,000 Active
-
2024-10-14historical
-
2024-08-21$439,900 Active
-
2024-08-16historical
-
2024-03-22$439,900 Active
-
2021-10-04soldstatus
-
2021-09-02historical Backup
-
2021-08-29$355,000 Active
-
2016-12-02soldstatus Sold
-
2016-12-02soldstatus
-
2016-11-06status Under Contract
-
2016-10-31status Active
-
2016-10-21status Under Contract
-
2016-10-05$195,000 Active
-
2015-07-31soldstatus Sold
-
2015-07-31soldstatus
-
2015-07-04historical
-
2015-06-25price $178,500
-
2015-05-23$179,900 Active
-
2011-03-22soldstatus
-
2011-03-21soldstatus
-
2010-10-07$124,900
ⓘ Source: listings_history table (triggers on properties + properties_extension) + one-shot
backfill from property_details.listing_events for pre-trigger history.
Tax reassessment forecast UT · Resets to sale price
- Current annual tax
- $1,918 · $160/mo
- Projected year-2 tax
- $2,639 · $220/mo
- Expected delta
- +$722/yr (+$60/mo · 37.6%)
ⓘ Screening estimate from a state-policy table — verify with the county assessor before closing.
Climate risk First Street
- Flood 1/10 Low FEMA zone X (unshaded) · 0% chance over 30 yrs
- Wildfire 3/10 Moderate
- Heat 5/10 Major 7 d/yr ≥95°F today · 20 d/yr by 30 yrs out
- Wind 1/10 Low
- Air quality 5/10 Major 8 unhealthy d/yr today · 8 by 30 yrs out
Nearby sold comps map
Loading sold comps map…
Walkable amenities ~0.75 mi
Loading nearby amenities…
Taxation est. · year 1
- Rental income
- $23,687
- − Mortgage interest
- −$22,401
- − Property taxes
- −$1,918
- − Insurance
- −$2,000
- − Repairs & maintenance
- −$1,895
- − Management
- −$1,895
- − HOA
- −$1,320
- − Depreciation
- −$11,633
- Taxable loss
- −$19,374
- Est. tax savings @ 24.0%
- +$4,650
- After-tax cash flow
- $-7,040/yr
For passive investors: Depreciation is non-cash, so a rental often shows a tax loss while cash-flowing — sheltering income. Rental losses are passive: they offset passive income freely, and up to $25,000/yr can offset ordinary (W-2) income if you actively participate and your MAGI is under $100k (phasing out to $0 by $150k); unused losses carry forward. On sale, claimed depreciation is recaptured at up to 25%, and gains may owe capital-gains tax (a 1031 exchange can defer both). Figures are a year-1 estimate at your 24.0% rate — not tax advice; consult a CPA.
Schools (NCES district)
- District
- Nebo District
- NCES district ID
- 4900630
- Math proficiency
- 38% ▼ -5.00%
- Reading proficiency
- 40% ▼ -4.00%
- Median HH income
- $64,067
- Composite
- 35.01/100
- National rank
- #5047
- State rank
- #45 of 80 in UT
Livability — Spanish Fork
- Score
- 83/100
- State rank
- #26
- US rank
- #1012
Category grades
Schools grade is shown separately in the Schools card above.
Census & demographics
- Census place
- Spanish Fork, UT
- County
- Utah County · 661,754 people
- City population
- 48,583
- Metro
- Provo-Orem, UT
- Population (ZIP)
- 48,583
- Household income
- $104,355
- Rent vs Own
- Severe rent burden
- 525.0
Population outlook (Utah County) Hauer SSP2
- Today (2025)
- 693,420 people
- By 2030
- 757,324 · +9.2%
- By 2040
- 893,178 · +28.8%
- By 2050
- 1,035,842 · +49.4%
- By 2075
- 1,376,733 · +98.5%
- By 2100
- 1,609,388 · +132.1%
Race, ethnicity, and origin ACS 2023
- Neighborhood character
- Predominantly White (81%)
- Race & ethnicity
- White 81% Hispanic / Latino 14% Two or more races 8%
- Hispanic origin (detail)
- Mexican 9%
- Common ancestry
- Slovak 4% Italian 4% Iranian 2%
- Foreign-born
- 5% · Canada
- Languages at home
- 88% English-only · Spanish 10% Other Asian/Pacific 1%
Political lean MEDSL · Utah
- 2024 margin
- Solid R (+39.8) · D 28.5% · R 68.3% · Other 3.2%
- 2008→2024 swing
- +19.1pp toward D · 2008: -58.9pp · 2024: -39.8pp
- All cycles
- 2024: R+39.8 2020: R+41.0 2016: R+37.3 2012: R+78.5 2008: R+58.9
Not yet ingested
- Civics
- —
Market trends
- HPI YoY
- ▼ -161.19%
- Current HPI
- 304.4917
- Rent YoY
- ▲ 3.59%
- Metro
- Provo-Orem, UT
- State GDP YoY
- ▲ 3.54%
- F500 in state
- 2
Industry mix (Fortune 500 HQ in UT)
| Industry | F500 HQs | Revenue |
|---|---|---|
| Financial Services | 1 | $3B |
|
||
Price history
+220.2% since first listed23 events — show timeline
- 2026-03-07 Price Changed $399,900 WFRMLS
- 2026-01-21 Listed $410,000 WFRMLS
- 2024-10-14 Listing Removed — WFRMLS
- 2024-08-21 Listed $439,900 WFRMLS
- 2024-08-16 Listing Removed — WFRMLS
- 2024-03-22 Listed $439,900 WFRMLS
- 2021-10-04 Sold (Public Records) — Public Records
- 2021-09-02 Contingent — WFRMLS
- 2021-08-29 Listed $355,000 WFRMLS
- 2016-12-02 Sold (Public Records) — Public Records
- 2016-12-02 Sold (MLS) — WFRMLS
- 2016-11-06 Pending — WFRMLS
- 2016-10-31 Relisted — WFRMLS
- 2016-10-21 Pending — WFRMLS
- 2016-10-05 Listed $195,000 WFRMLS
- 2015-07-31 Sold (Public Records) — Public Records
- 2015-07-31 Sold (MLS) — WFRMLS
- 2015-07-04 Listing Removed — WFRMLS
- 2015-06-25 Price Changed $178,500 WFRMLS
- 2015-05-23 Listed $179,900 WFRMLS
- 2011-03-22 Sold (Public Records) — Public Records
- 2011-03-21 Sold (MLS) — WFRMLS
- 2010-10-07 Listed $124,900 WFRMLS
Property tax history
+7.3%/yrLatest (2025): $1,918 · -1.4% YoY. Source: county tax records.
Cash-flow waterfall
monthlySold comps — $/sqft
last 12 mo · ≤1 miLoading sold comps…