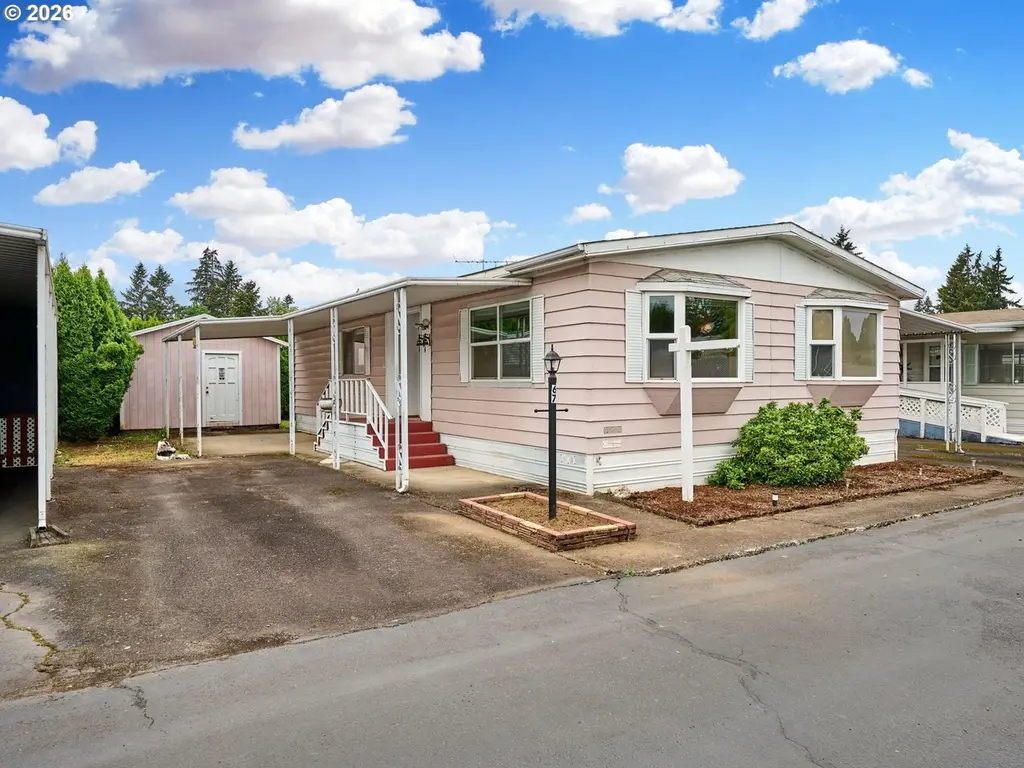
620 SE 2nd Ave #67 · Canby, OR
Flood risk 3/10 · Minor
- FEMA flood zone
- X (unshaded)
- Chance of flooding over 30 yrs
- 0.2%
- Est. flood insurance / yr
- $507 – $1,088
Fire risk 4/10 · Minor
- Est. fire insurance / yr
- $498 – $926
Heat risk 3/10 · Minor
- Hot days now (above 92°F)
- 7 days/yr
- Hot days in 30 yrs
- 14 days/yr
Wind risk 1/10 · Minimal
- Chance of severe wind over 30 yrs
- —
Air-quality risk 10/10 · Severe
- Unhealthy air days now
- 16 days/yr
- Unhealthy air days in 30 yrs
- 18 days/yr
Risk factors via First Street. Map © Google.
Why this score? — see what drove the B+ grade
The composite is a weighted blend of 9 inputs, each scored 0–100. Each bar is that input's sub-score; the figure is the points it added to the 100-point composite (weight × sub-score).
- Cash flow +30.0/30.0
- ARV discount +13.2/15.0
- 1% rule +10.0/10.0
- DSCR +10.0/10.0
- Livability +4.1/5.0
- Schools +3.6/10.0
- Rent growth +3.0/5.0
- Condition / age +2.5/5.0
- Appreciation +0.0/10.0
$59,000
🖨 Deal sheet (PDF) 📄 Offer letter ✓ Due diligence
Listing remarks MLS
NEW 14X20 SHOP, TWO DECKS, NEW ROOF, SOME NEW WINDOWS NEW COUNTERTOPS
Key facts
- Covered cement patio
- Private backyard
- Wooden deck
Tags
Property features AI
Finance
- Other: Property is resale, not new construction; Unit dimensions approximately 48 x 12 (two sections)
- HOA & community: Located in Redwood Estates park; Park allows up to 2 indoor pets; Land lease in effect (monthly lot rent: $975; lease expires October 1, 2026)
Exterior
- Parking: Driveway parking; Off-street parking
- Utilities: Public water; Public sewer; Electric-powered hot water (tank); Electric fuel; Satellite internet
- Home design: Manufactured home in a park (Statler); Single-story / one level; No notable view
- Construction: Built in 1978; Composition roof; Aluminum and lap siding; Block foundation with skirting
- Exterior features: Covered deck; Yard; Outbuilding and workshop; Level lot; Paved road access
Interior
- Kitchen: Pantry; Free-standing range; Free-standing refrigerator
- Bedrooms: Primary bedroom on main level; Second bedroom on main level
- Flooring: Vinyl flooring; Wall-to-wall carpet
- Bathrooms: Two full bathrooms (both on main level)
- Heating & cooling: Forced air heating; No central cooling
- Interior features: Main-floor living with accessible design; Laundry area on main level; Vinyl flooring and wall-to-wall carpet; Double-pane windows with aluminum and vinyl frames; Crawl space basement
- Laundry & utility: Dedicated laundry room on main level (approx. 9 x 5)
Neighborhood map
What this means for you Summary
Snapshot
- This is a 2-bed/2.0-bath other listed at $59k.
Deal economics
- At list price, monthly cash flow is $963 ($12k/yr) — positive.
- The deal already cash-flows at list — no discount required.
- Meets the 1% rule at list price ($2k rent vs $59k).
- Recommended offer: $57k (3.0% below list) — sets the bar for market timing.
- Cap rate 25.9% vs local median 2.1% in Canby — top-decile yield for the area; either an underpriced asset or a hidden risk that comps aren't pricing in. Stress-test before assuming the spread holds.
Location & tenants
- Location reads 82/100 on livability (#43 in OR, #1,056 nationally) — a professional / high-income tenant draw. Strengths: commute A+, employment A+, housing A+; Watch: cost of living D-.
- Canby SD 86 (town): math 36% / reading 45% proficiency, ranked #14 of 58 in OR (top 24%) — families likely to look elsewhere, expect single-tenant / working-renter base with shorter leases.
- Zoned schools: Carus School (math 24% / reading 42%, grade F, #239 of 412 statewide, top 58%, 362 students, 40% FRL); Baker Prairie Middle School (math 42% / reading 54%, grade C-, #30 of 128 statewide, top 23%, 557 students, 33% FRL); Canby High School (math 75% / reading 75%, grade A-, #2 of 143 statewide, top 6%, 1,393 students, 27% FRL).
- Market conditions: Rents rising (+1.9%/yr); 166 active listings in the ZIP; 22 comparable units currently listed for rent nearby; rentals leasing fast (median 5d on market — plan ~1-2 weeks tenant-placement turnaround); solid renter incomes; 946 units permitted in Clackamas County in 2024 (188 in 5+ unit buildings).
Forward outlook
- Local home prices are declining (-3.0%/yr); year-one equity from $408 of loan paydown is wiped out by about $2k of value loss. Plan a longer hold.
- Clackamas County population projected at +25% by 2050 — long-run rental-demand tailwind backs the buy-and-hold thesis.
- At projected returns (-3.0% appreciation + 1.9% rent growth), your $17k cash investment doubles in ~2 years — after that, you're playing with house money.
Negotiation context
- It's been on market 42 days — a 3% lower offer ($57k) is reasonable based on typical stale-listing flexibility.
- 3 sale attempts since 27y ago; this cycle's ask has dropped $20k (25%) from the opening price — seller is motivated, your offer sets the floor, not the list.
- Current owner paid $31k; list at $59k implies a 90% gain — meaningful room to come down on a strong offer.
Questions for the listing agent
- It's been on market 42 days. Have you received any prior offers? Is the seller open to a 3% concession, seller financing, or rate buy-down credit?
- Built in 1978 — when were the roof, HVAC, electrical panel, plumbing, and water heater last replaced?
- Is there a deadline driving the sale (1031 exchange, divorce, estate, relocation)? That informs how much negotiation room exists.
- What's the average days-on-market for RENTAL listings here right now (not sales)? A rising rental-DOM trend means longer vacancies and softer asking-rent achievability than the comps imply.
- What's the recent tenant-quality profile in this submarket — average credit score on applications, eviction rate, late-payment / NSF rate, and stable-employment percentage? A property-management company in the area should have these aggregated.
- How much new for-sale + rental construction is in the pipeline within 1–3 miles? Heavy new supply typically softens prices + rents 12–24 months out; constrained supply supports both.
Investment metrics
- 1% rule
- 2.85% ✓
- Cap rate
- 25.88%
- Cash-on-cash
- 69.95%
- DSCR
- 4.11
- GRM
- 2.9
CMA / ARV
- ARV (median comp)
- $67,500
- List price
- $59,000
- Delta
- -12.59%
- Verdict
- UNDERPRICED
- Comps
- 10 within 1.0 mi
Projected returns pro-forma
-3.0% appreciation · 1.89% rent growth · sell at horizon
- IRR
- 68.2%
- Equity multiple
- 4.02×
- Total profit
- $49,908
- Equity at exit
- $8,797
- IRR
- 72.0%
- Equity multiple
- 7.96×
- Total profit
- $114,968
- Equity at exit
- $5,101
Cash invested: $16,520 (down + closing). Projections, not guarantees.
Landlord ↔ Tenant lean methodology
- Overall (STATE)
- 28 Tenant-Leaning
- State Oregon
- 28 Tenant-Leaning · D+6
- County
- — inherits STATE
- City
- — inherits STATE
ZIP-level market 97013
- Rents YoY
- 1.9%
- Active inventory
- 166
- Price-to-rent
- 2.9×
Monthly cashflow live
- Estimated rent
- $1,684 high interval (Pro) →
- Mortgage (P&I)
- −$309
- Tax from tax record
- −$33 /mo · $398/yr
- Insurance
- −$25
- HOA
- −$0
- Vacancy / Maint / Mgmt
- −$354
- Net cashflow
- $963
Break-even live
Sensitivity live
| Price | -10% $996 | -5% $980 | +0% $963 | +5% $946 | +10% $930 |
|---|---|---|---|---|---|
| Rent | -10% $830 | -5% $896 | +0% $963 | +5% $1,029 | +10% $1,096 |
| Rate | -1.0pp $993 | -0.5pp $978 | base $963 | +0.5pp $948 | +1.0pp $932 |
UW: 25.0% down · 7.5% · 30yr · 1.5% tax · 5.0% vac · 8.0% maint · 8.0% mgmt
Financing live
Cash to close
- Down payment
- $14,750
- Closing costs
- $1,770
- Reserves months
- —
- Total cash needed
- —
Loan-product check · same deal, 3 products live
Conventional
25% down · 7.5% · 30yr
- Down + closing
- —
- Monthly P&I
- —
- Monthly cashflow
- —
- DSCR
- —
- Eligible?
- —
Personal DTI + credit; lowest rate.
DSCR
20% down · 8.5% · 30yr
- Down + closing
- —
- Monthly P&I
- —
- Monthly cashflow
- —
- DSCR
- —
- Eligible?
- —
No personal income docs; deal must DSCR.
Hard money
10% down · 12.0% · 12mo
- Down + closing
- —
- Monthly P&I
- —
- Monthly cashflow
- —
- DSCR
- —
- Eligible?
- —
Short-term bridge; refi at stabilization.
Rent comps 22 comps
| Address | Beds | Baths | Sqft | Rent | $/sqft | DOM | Units | Dist |
|---|---|---|---|---|---|---|---|---|
| 360 S Locust St Unit 360 Canby, OR | 2.0 | 1.0 | 840 | $1,495 | $1.78 | 44d | 1 | 0.11mi |
| 360 S Locust St Unit 360 Canby, OR | 2.0 | 1.0 | 840 | $1,495 | $1.78 | 24d | 1 | 0.11mi |
| 360 S Locust St Unit 360 Canby, OR | 2.0 | 1.0 | 840 | $1,545 | $1.84 | 5d | 1 | 0.11mi |
| 341 SE 2nd Ave Unit 347 Canby, OR | 2.0 | 1.0 | 800 | $1,195 | $1.49 | 3d | 1 | 0.17mi |
| 341 SE 2nd Ave Unit 351 Canby, OR | 2.0 | 1.0 | 800 | $1,295 | $1.62 | 3d | 1 | 0.17mi |
| 272 S Knott St Canby, OR | 2.0 | 1.0 | 830 | $1,395 | $1.68 | 17d | 1 | 0.19mi |
| 410 S Knott St Unit 456 Canby, OR | 2.0 | 1.0 | 850 | $1,600 | $1.88 | 3d | 1 | 0.21mi |
| 700 SE 5th Ave Canby, OR | 2.0–3.0 | 2.0 | 1066 | $1,840 | $1.73 | 2d | 2 | 0.25mi |
| 190 SE 3rd Ave Canby, OR | 3.0 | 2.0 | 1196 | $2,450 | $2.05 | 44d | 1 | 0.27mi |
| 450 S Pine St Canby, OR | 2.0 | 1.0 | 840 | $1,550 | $1.85 | 2d | 5 | 0.32mi |
| 645 N Pine St Canby, OR | 2.0 | 1.0 | 1100 | $1,550 | $1.41 | 2d | 1 | 0.35mi |
| 575 N Pine St Unit 575 Canby, OR | 2.0 | 1.0 | 1100 | $1,550 | $1.41 | 5d | 1 | 0.35mi |
| 625 N Pine St Unit 639 Canby, OR | 2.0 | 1.0 | 1100 | $1,550 | $1.41 | 44d | 1 | 0.37mi |
| 403 S Ivy St Unit 407 Canby, OR | 2.0 | 1.0 | 850 | $1,495 | $1.76 | 3d | 1 | 0.38mi |
| 259 S Sequoia Pkwy Canby, OR | 1.0–3.0 | 1.0–2.0 | 1013 | $1,972 | $1.95 | 2d | 12 | 0.48mi |
| 499 SW 5th Ave Canby, OR | 3.0 | 1.0 | 942 | $2,195 | $2.33 | 45d | 1 | 0.63mi |
| 370 N Douglas St Unit 370 Canby, OR | 1.0 | 1.5 | 840 | $1,400 | $1.67 | 8d | 1 | 0.75mi |
| 1477 N Manzanita St Canby, OR | 1.0 | 1.0 | 585 | $2,000 | $3.42 | 13d | 5 | 0.79mi |
| 259 N Cedar St Canby, OR | 3.0 | 2.5 | 1453 | $2,399 | $1.65 | 8d | 1 | 0.81mi |
| 267 N Aspen St Canby, OR | 3.0 | 2.5 | 1252 | $2,100 | $1.68 | 21d | 1 | 0.91mi |
| 1802 N Pine St Canby, OR | 2.0 | 2.0 | 1002 | $1,499 | $1.50 | 5d | 1 | 1.00mi |
| 2040 N Redwood St Canby, OR | 1.0–2.0 | 1.0 | 910 | $1,599 | $1.76 | 2d | 2 | 1.20mi |
Listing history 18 events
-
2026-06-18days on market $59,000 Active 42 DOM
-
2026-06-17pricedays on market $59,000 Active 41 DOM
-
2026-06-16days on market $69,000 Active 40 DOM
-
2026-06-15days on market $69,000 Active 39 DOM
-
2026-06-13days on market $69,000 Active 37 DOM
-
2026-06-09days on market $69,000 Active 33 DOM
-
2026-06-08days on market $69,000 Active 32 DOM
-
2026-06-07days on market $69,000 Active 31 DOM
-
2026-06-05days on market $69,000 Active 28 DOM
-
2026-06-03days on market $69,000 Active 27 DOM
-
2026-06-02days on market $69,000 Active 26 DOM
-
2026-06-01days on market $69,000 Active 25 DOM
-
2026-05-31days on market $69,000 Active 24 DOM
-
2026-05-07$79,000 Active 965-char remark
-
2002-02-28soldstatus $31,000 69-char remark
Show marketing remark (69 chars)
NEW 14X20 SHOP, TWO DECKS, NEW ROOF, SOME NEW WINDOWS NEW COUNTERTOPS
-
2002-01-10$31,000 69-char remark
Show marketing remark (69 chars)
NEW 14X20 SHOP, TWO DECKS, NEW ROOF, SOME NEW WINDOWS NEW COUNTERTOPS
-
1999-09-21soldstatus $20,000
-
1999-05-20$22,000
ⓘ Source: listings_history table (triggers on properties + properties_extension) + one-shot
backfill from property_details.listing_events for pre-trigger history.
Tax reassessment forecast OR · Resets to sale price
- Current annual tax
- $398 · $33/mo
- Projected year-2 tax
- $572 · $48/mo
- Expected delta
- +$174/yr (+$14/mo · 43.6%)
ⓘ Screening estimate from a state-policy table — verify with the county assessor before closing.
Climate risk First Street
- Flood 3/10 Moderate FEMA zone X (unshaded) · 20% chance over 30 yrs
- Wildfire 4/10 Moderate
- Heat 3/10 Moderate 7 d/yr ≥92°F today · 14 d/yr by 30 yrs out
- Wind 1/10 Low
- Air quality 10/10 Extreme 16 unhealthy d/yr today · 18 by 30 yrs out
Nearby sold comps map
Loading sold comps map…
Walkable amenities ~0.75 mi
Loading nearby amenities…
Taxation est. · year 1
- Rental income
- $20,204
- − Mortgage interest
- −$3,305
- − Property taxes
- −$398
- − Insurance
- −$295
- − Repairs & maintenance
- −$1,616
- − Management
- −$1,616
- − Depreciation
- −$1,716
- Taxable income
- $11,257
- Est. tax owed @ 24.0%
- −$2,702
- After-tax cash flow
- $8,853/yr
For passive investors: Depreciation is non-cash, so a rental often shows a tax loss while cash-flowing — sheltering income. Rental losses are passive: they offset passive income freely, and up to $25,000/yr can offset ordinary (W-2) income if you actively participate and your MAGI is under $100k (phasing out to $0 by $150k); unused losses carry forward. On sale, claimed depreciation is recaptured at up to 25%, and gains may owe capital-gains tax (a 1031 exchange can defer both). Figures are a year-1 estimate at your 24.0% rate — not tax advice; consult a CPA.
Schools (NCES district)
- District
- Canby SD 86
- NCES district ID
- 4102640
- Math proficiency
- 36% ▼ -4.00%
- Reading proficiency
- 45% ▼ -5.00%
- Median HH income
- $64,246
- Composite
- 36.24/100
- National rank
- #4717
- State rank
- #14 of 58 in OR
Livability — Canby
- Score
- 82/100
- State rank
- #43
- US rank
- #1056
Category grades
Schools grade is shown separately in the Schools card above.
Census & demographics
- Census place
- Canby, OR
- County
- Clackamas County · 361,406 people
- City population
- 24,293
- Metro
- Portland-Vancouver-Hillsboro, OR-WA
- Population (ZIP)
- 24,293
- Household income
- $101,832
- Rent vs Own
- Severe rent burden
- 575.0
Population outlook (Clackamas County) Hauer SSP2
- Today (2025)
- 458,456 people
- By 2030
- 485,185 · +5.8%
- By 2040
- 532,932 · +16.2%
- By 2050
- 574,445 · +25.3%
- By 2075
- 665,497 · +45.2%
- By 2100
- 697,488 · +52.1%
Race, ethnicity, and origin ACS 2023
- Neighborhood character
- Predominantly White (75%)
- Race & ethnicity
- White 75% Hispanic / Latino 18% Two or more races 8% Asian 2%
- Hispanic origin (detail)
- Mexican 17%
- Common ancestry
- Portuguese 4% Lithuanian 3% Italian 2%
- Foreign-born
- 9% · Canada, Vietnam
- Languages at home
- 83% English-only · Spanish 14% Russian/Polish/Slavic 1% Vietnamese 1%
Political lean MEDSL · Clackamas
- 2024 margin
- Lean D (+9.7) · D 53.4% · R 43.6% · Other 3.0%
- 2008→2024 swing
- -0.6pp no change · 2008: 10.4pp · 2024: 9.7pp
- All cycles
- 2024: D+9.7 2020: D+11.1 2016: D+6.1 2012: D+3.5 2008: D+10.4
Not yet ingested
- Civics
- —
Market trends
- HPI YoY
- ▼ -427.87%
- Current HPI
- 287.758
- Rent YoY
- ▲ 1.89%
- Metro
- Portland-Vancouver-Hillsboro, OR-WA
- State GDP YoY
- ▲ 2.05%
- F500 in state
- 2
Industry mix (Fortune 500 HQ in OR)
| Industry | F500 HQs | Revenue |
|---|---|---|
| Consumer Goods | 1 | $51B |
|
||
Price history
+168.2% since first listed7 events — show timeline
- 2026-06-17 Price Changed $59,000 RMLS
- 2026-05-27 Price Changed $69,000 RMLS
- 2026-05-07 Listed $79,000 RMLS
- 2002-02-28 Sold (MLS) $31,000 RMLS
- 2002-01-10 Listed $31,000 RMLS
- 1999-09-21 Sold (MLS) $20,000 RMLS
- 1999-05-20 Listed $22,000 RMLS
Property tax history
+4.0%/yrLatest (2023): $398 · +1.5% YoY. Source: county tax records.
Cash-flow waterfall
monthlySold comps — $/sqft
last 12 mo · ≤1 miLoading sold comps…