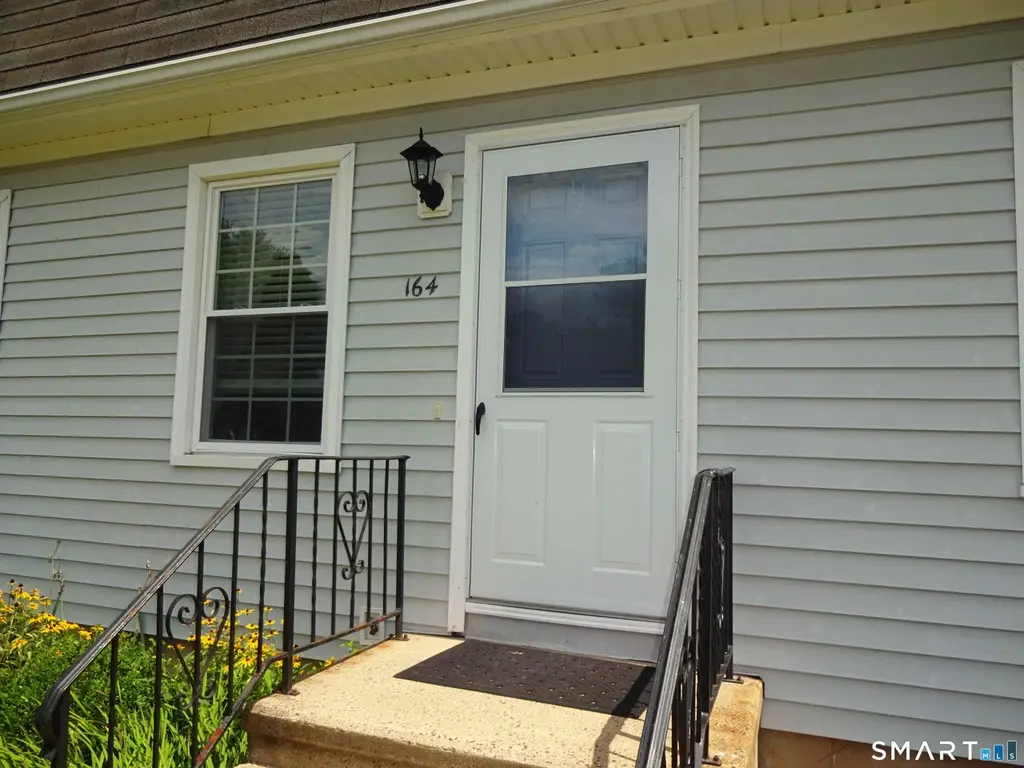
164 Austin Ryer Ln #164 · Branford, CT
Flood risk 4/10 · Minor
- FEMA flood zone
- X (unshaded)
- Chance of flooding over 30 yrs
- 0.2%
- Est. flood insurance / yr
- $507 – $1,088
Fire risk 3/10 · Minor
- Est. fire insurance / yr
- $829 – $1,539
Heat risk 7/10 · Major
- Hot days now (above 96°F)
- 7 days/yr
- Hot days in 30 yrs
- 18 days/yr
Wind risk 6/10 · Moderate
- Chance of severe wind over 30 yrs
- 61.0%
Air-quality risk 4/10 · Minor
- Unhealthy air days now
- 5 days/yr
- Unhealthy air days in 30 yrs
- 7 days/yr
Risk factors via First Street. Map © Google.
Why this score? — see what drove the C- grade
The composite is a weighted blend of 9 inputs, each scored 0–100. Each bar is that input's sub-score; the figure is the points it added to the 100-point composite (weight × sub-score).
- ARV discount +15.0/15.0
- Cash flow +12.0/30.0
- 1% rule +5.1/10.0
- Rent growth +5.0/5.0
- Schools +4.2/10.0
- Condition / age +3.8/5.0
- DSCR +3.6/10.0
- Livability +2.5/5.0
- Appreciation +0.0/10.0
$250,000
🖨 Deal sheet 📄 Offer letter ✓ Due diligence
Listing remarks MLS
Mint condo in a great location, end unit. Living rm with charming corner fp,dr sliders to deck, full finished walk out basement family room. Dr chandelier to bereplaced.Spacious bed rooms
Key facts
- $335 HOA
- Parking
- Built 1986
Property features AI
Finance
- HOA & community: Monthly HOA fee of $335; HOA covers grounds maintenance, trash pickup, snow removal, and property management; Professional off-site property management; Pets allowed per HOA rules; Part of a 101-unit community
Exterior
- Parking: Off-street parking; 1 parking space
- Utilities: Public water; Public sewer; Natural gas
- Home design: Condominium (unit in Island View Village II); End unit
- Construction: Frame and concrete construction
- Exterior features: Vinyl siding; Deck
Interior
- Kitchen: Oven/Range; Microwave; Refrigerator; Freezer; Dishwasher
- Bedrooms: 2 bedrooms
- Bathrooms: 1 full bathroom; 1 half bathroom
- Heating & cooling: Central air conditioning; Hot air heat (natural gas)
- Interior features: Pre-wired for cable; One fireplace; Full finished walk-out basement; Has attic with hatch access; Three-level unit (3 levels); Total of 5 rooms
- Laundry & utility: Laundry on lower level
Neighborhood map
What this means for you Summary
Snapshot
- This is a 2-bed/1.5-bath condo listed at $250k. Condition is rated good.
Deal economics
- At list price, monthly cash flow is $-59 ($-704/yr) — negative.
- To cash-flow at today's rent, offer at most $242k (3.4% below list).
- Meets the 1% rule at list price ($3k rent vs $250k).
- Recommended offer: $242k (3.4% below list) — sets the bar for cash-flow.
Location & tenants
- Location reads: area grade C — affects rentability + tenant quality, not the cash-flow math above.
- Branford School District (suburban): math 41% / reading 52% proficiency, ranked #85 of 153 in CT (top 56%) — families likely to look elsewhere, expect single-tenant / working-renter base with shorter leases; only 18% free/reduced lunch — higher-income household profile.
- Zoned schools: Mary T. Murphy School (math 52% / reading 52%, grade C-, #213 of 553 statewide, top 41%, 366 students, 44% FRL); Branford High School (math 37% / reading 62%, grade D, #87 of 194 statewide, top 46%, 818 students, 41% FRL) — zoned schools average 42% FRL vs 18% district-wide (24 pts higher); higher-poverty schools than district average — tighter screening recommended.
- Market conditions: Rents rising fast (+10.6%/yr); 114 active listings in the ZIP; 15 comparable units currently listed for rent nearby; rentals at typical pace (median 23d on market — plan ~3-4 weeks tenant-placement turnaround); 47% of comp listings sitting > 30 days — soft ceiling on asking rent; solid renter incomes; 1,059 units permitted in South Central Connecticut Planning Region in 2024 (779 in 5+ unit buildings).
Forward outlook
- Local home prices are declining (-3.0%/yr); year-one equity from $2k of loan paydown is wiped out by about $8k of value loss. Plan a longer hold.
Negotiation context
- It's been on market 33 days — a 3% lower offer ($242k) is reasonable based on typical stale-listing flexibility.
- 3 sale attempts since 26y ago with the ask held roughly flat each time — persistent listings suggest the price (not the market) is what's stuck; bring a comps-based counter.
- Current owner paid $105k; list at $250k implies a 138% gain — meaningful room to come down on a strong offer.
Risks & watch-outs
- Climate carrying-cost: major wind risk, 61% chance of damaging wind over 30y; extreme-heat days projected 7→18/yr by 2055 (HVAC capex compounding) — expect insurance premiums to compound above CPI over the hold.
Questions for the listing agent
- What do current leases actually rent for vs. the listed asking? Can we see a recent rent roll and the last 12 months of T-12 income?
- It's been on market 33 days. Have you received any prior offers? Is the seller open to a 3% concession, seller financing, or rate buy-down credit?
- What does the HOA fee cover, when was the last increase, and are there any pending special assessments or reserve-fund shortfalls?
- Any open or pending special assessments — roof, HVAC, plumbing, elevator, façade? What's the per-unit balance and payoff schedule, and is the seller paying it off at close or rolling it to the buyer?
- Is there a deadline driving the sale (1031 exchange, divorce, estate, relocation)? That informs how much negotiation room exists.
- What's the average days-on-market for RENTAL listings here right now (not sales)? A rising rental-DOM trend means longer vacancies and softer asking-rent achievability than the comps imply.
- What's the recent tenant-quality profile in this submarket — average credit score on applications, eviction rate, late-payment / NSF rate, and stable-employment percentage? A property-management company in the area should have these aggregated.
- How much new apartment / multifamily construction is in the pipeline within 1–3 miles? Heavy new supply (>2% of stock underway) typically softens rents 12–24 months out; light construction supports rent growth.
Investment metrics
- 1% rule
- 1.01% ✓
- Cap rate
- 6.01%
- Cash-on-cash
- -1.01%
- DSCR
- 0.96
- GRM
- 8.2
CMA / ARV
- ARV (median comp)
- $309,835
- List price
- $250,000
- Delta
- -19.31%
- Verdict
- UNDERPRICED
- Comps
- 20 within 1.0 mi
Projected returns pro-forma
-3.0% appreciation · 8.0% rent growth · sell at horizon
- IRR
- -11.4%
- Equity multiple
- 0.56×
- Total profit
- $-30,599
- Equity at exit
- $37,276
- IRR
- 4.7%
- Equity multiple
- 1.44×
- Total profit
- $30,548
- Equity at exit
- $21,615
Cash invested: $70,000 (down + closing). Projections, not guarantees.
Landlord ↔ Tenant lean methodology
- Overall (STATE)
- 27 Tenant-Leaning
- State Connecticut
- 27 Tenant-Leaning · D+7
- County
- — inherits STATE
- City
- — inherits STATE
ZIP-level market 06405
- Rents YoY
- 10.6%
- Active inventory
- 114
- Price-to-rent
- 8.2×
Monthly cashflow live
- Estimated rent
- $2,537 high interval (Pro) →
- Mortgage (P&I)
- −$1,311
- Tax est. 1.5%
- −$312 /mo · $3,750/yr
- Insurance
- −$104
- HOA
- −$335
- Vacancy / Maint / Mgmt
- −$533
- Net cashflow
- $-59
Break-even live
UW: 25.0% down · 7.5% · 30yr · 1.5% tax · 5.0% vac · 8.0% maint · 8.0% mgmt
Financing live
Cash to close
- Down payment
- $62,500
- Closing costs
- $7,500
- Reserves months
- —
- Total cash needed
- —
Loan-product check · same deal, 3 products live
Conventional
25% down · 7.5% · 30yr
- Down + closing
- —
- Monthly P&I
- —
- Monthly cashflow
- —
- DSCR
- —
- Eligible?
- —
Personal DTI + credit; lowest rate.
DSCR
20% down · 8.5% · 30yr
- Down + closing
- —
- Monthly P&I
- —
- Monthly cashflow
- —
- DSCR
- —
- Eligible?
- —
No personal income docs; deal must DSCR.
Hard money
10% down · 12.0% · 12mo
- Down + closing
- —
- Monthly P&I
- —
- Monthly cashflow
- —
- DSCR
- —
- Eligible?
- —
Short-term bridge; refi at stabilization.
Rent comps 15 comps
| Address | Beds | Baths | Sqft | Rent | $/sqft | DOM | Units | Dist |
|---|---|---|---|---|---|---|---|---|
| 91 Hampton Park Branford, CT | 2.0 | 1.0 | 1114 | $2,550 | $2.29 | 2d | 1 | 0.83mi |
| 154 E Main St Unit A Branford, CT | 2.0 | 1.0 | 1040 | $2,400 | $2.31 | 43d | 1 | 0.96mi |
| 132 Montoya Dr Unit 132 Branford, CT | 1.0 | 1.0 | 1136 | $2,250 | $1.98 | 14d | 1 | 1.14mi |
| 112 Montoya Dr Unit 112 Branford, CT | 2.0 | 2.0 | 1275 | $2,615 | $2.05 | 43d | 1 | 1.16mi |
| 118 Montoya Dr Unit 118 Branford, CT | 1.0 | 1.0 | 1136 | $2,375 | $2.09 | 10d | 1 | 1.18mi |
| 15 Bradley Ave Branford, CT | 2.0 | 1.0 | 936 | $2,000 | $2.14 | 43d | 1 | 1.19mi |
| 815 Main St Branford, CT | 3.0 | 1.5 | 1824 | $3,200 | $1.75 | 10d | 1 | 1.21mi |
| 650 Main St Unit 3 Branford, CT | 1.0 | 2.0 | 1750 | $5,000 | $2.86 | 23d | 1 | 1.23mi |
| 57 Montoya Cir Branford, CT | 1.0–2.0 | 1.0–2.0 | 1180 | $2,698 | $2.29 | 2d | 1 | 1.23mi |
| 81 Church St Branford, CT | 1.0 | 1.0 | 1092 | $2,195 | $2.01 | 43d | 1 | 1.26mi |
| 7 Mill Plain Rd Branford, CT | 1.0–2.0 | 1.0 | 885 | $2,245 | $2.54 | 3d | 4 | 1.28mi |
| 96 Main St #2 Branford, CT | 1.0 | 1.0 | 1073 | $1,400 | $1.30 | 23d | 1 | 1.33mi |
| 14 Averill Pl Unit 8 Branford, CT | 2.0 | 1.0 | 1000 | $2,250 | $2.25 | 43d | 1 | 1.35mi |
| 40 Rogers St Unit 1 Branford, CT | 2.0 | 1.0 | 1081 | $2,400 | $2.22 | 43d | 1 | 1.43mi |
| 49 N Harbor St Unit 1 Branford, CT | 3.0 | 1.0 | 1118 | $2,150 | $1.92 | 44d | 1 | 1.50mi |
HOA detail condo
- Monthly dues
- $335 · $4,020/yr
- Assessments
- None detected in remarks — confirm with the listing agent.
Listing history 15 events
-
2026-06-10status $250,000 Under Contract 33 DOM
-
2026-06-09days on market $250,000 Under Contract - Continue to Show 33 DOM
-
2026-06-08days on market $250,000 Under Contract - Continue to Show 32 DOM
-
2026-06-07days on market $250,000 Under Contract - Continue to Show 31 DOM
-
2026-06-03days on market $250,000 Under Contract - Continue to Show 27 DOM
-
2026-06-03days on market $250,000 Under Contract - Continue to Show 26 DOM
-
2026-06-01days on market $250,000 Under Contract - Continue to Show 25 DOM
-
2026-05-31days on market $250,000 Under Contract - Continue to Show 24 DOM
-
2026-05-13historical Under Contract - Continue to Show 1224-char remark
-
2026-05-08$250,000 Active 1224-char remark
-
2026-05-05historical $250,000 1224-char remark
-
2009-11-03historical
-
2009-05-03$197,900
-
2000-06-23soldstatus $105,000
Show marketing remark (187 chars)
Mint condo in a great location, end unit. Living rm with charming corner fp,dr sliders to deck, full finished walk out basement family room. Dr chandelier to bereplaced.Spacious bed rooms
-
2000-03-29$109,850
Show marketing remark (187 chars)
Mint condo in a great location, end unit. Living rm with charming corner fp,dr sliders to deck, full finished walk out basement family room. Dr chandelier to bereplaced.Spacious bed rooms
ⓘ Source: listings_history table (triggers on properties + properties_extension) + one-shot
backfill from property_details.listing_events for pre-trigger history.
Climate risk First Street
- Flood 4/10 Moderate FEMA zone X (unshaded) · 20% chance over 30 yrs
- Wildfire 3/10 Moderate
- Heat 7/10 Severe 7 d/yr ≥96°F today · 18 d/yr by 30 yrs out
- Wind 6/10 Major 61% chance of damaging wind over 30 yrs
- Air quality 4/10 Moderate 5 unhealthy d/yr today · 7 by 30 yrs out
Nearby sold comps map
Loading sold comps map…
Walkable amenities ~0.75 mi
Loading nearby amenities…
Taxation est. · year 1
- Rental income
- $30,440
- − Mortgage interest
- −$14,004
- − Property taxes
- −$3,750
- − Insurance
- −$1,250
- − Repairs & maintenance
- −$2,435
- − Management
- −$2,435
- − HOA
- −$4,020
- − Depreciation
- −$7,273
- Taxable loss
- −$4,727
- Est. tax savings @ 24.0%
- +$1,134
- After-tax cash flow
- $430/yr
For passive investors: Depreciation is non-cash, so a rental often shows a tax loss while cash-flowing — sheltering income. Rental losses are passive: they offset passive income freely, and up to $25,000/yr can offset ordinary (W-2) income if you actively participate and your MAGI is under $100k (phasing out to $0 by $150k); unused losses carry forward. On sale, claimed depreciation is recaptured at up to 25%, and gains may owe capital-gains tax (a 1031 exchange can defer both). Figures are a year-1 estimate at your 24.0% rate — not tax advice; consult a CPA.
Condition & rehab AI · 13 photos
This move-in ready townhouse offers a good condition with minor cosmetic updates needed for optimal resale and rental value.
Value-add opportunities
- Both Paint exterior siding — Enhances curb appeal and value
- Both Replace worn-out window seals — Improves energy efficiency and appearance
Renovation cost estimate screening
Value-add ROI direction
- Both Paint exterior siding — Enhances curb appeal and value ↑
- Both Replace worn-out window seals — Improves energy efficiency and appearance ↑
ⓘ Cost ranges are severity-bucket heuristics (US national rule-of-thumb). Get contractor quotes + a written scope before underwriting a rehab budget.
Schools (NCES district)
- District
- Branford School District
- NCES district ID
- 0900420
- Math proficiency
- 41% ▼ -14.00%
- Reading proficiency
- 52% ▼ -10.00%
- Median HH income
- $70,979
- Composite
- 41.85/100
- National rank
- #3377
- State rank
- #85 of 153 in CT
Livability — Branford
No livability data for this city. (Only ~50 U.S. cities are tracked.)
Census & demographics
- County
- New Haven County · 688,236 people
- City population
- 28,217
- Metro
- New Haven-Milford, CT
- Population (ZIP)
- 28,217
- Household income
- $105,225
- Rent vs Own
- Severe rent burden
- 1132.0
Population outlook (South Central Connecticut County) Hauer SSP2
- By 2040
- 608,362
Race, ethnicity, and origin ACS 2023
- Neighborhood character
- Predominantly White (85%)
- Race & ethnicity
- White 85% Hispanic / Latino 5% Asian 4% Two or more races 4% Black 3%
- Hispanic origin (detail)
- Puerto Rican 1%
- Common ancestry
- Romanian 7% Lithuanian 2% Slovak 2%
- Foreign-born
- 10% · Canada, South Korea
- Languages at home
- 90% English-only · Spanish 4% Other Indo-European 3% Other Asian/Pacific 1%
Political lean MEDSL · South Central Connecticut
- 2024 margin
- Strong D (+20.1) · D 59.0% · R 38.9% · Other 2.1%
- All cycles
- 2024: D+20.1
Not yet ingested
- Civics
- —
Market trends
- HPI YoY
- ▼ -455.72%
- Current HPI
- 189.8481
- Rent YoY
- ▲ 10.58%
- Metro
- New Haven-Milford, CT
- State GDP YoY
- ▲ 1.06%
- F500 in state
- 38
Industry mix (Fortune 500 HQ in CT)
| Industry | F500 HQs | Revenue |
|---|---|---|
| Industrial Machinery | 4 | $38B |
|
||
| Insurance | 3 | $71B |
|
||
| Financial Services | 2 | $25B |
|
||
| Transportation / Logistics | 2 | $18B |
|
||
| Healthcare | 1 | $247B |
|
||
| Telecommunications | 1 | $55B |
|
||
Price history
+127.6% since first listed8 events — show timeline
- 2026-06-10 Pending — Smart MLS
- 2026-05-13 Contingent — Smart MLS
- 2026-05-08 Listed $250,000 Smart MLS
- 2026-05-05 Coming Soon $250,000 Smart MLS
- 2009-11-03 Listing Removed — Smart MLS
- 2009-05-03 Listed $197,900 Smart MLS
- 2000-06-23 Sold (MLS) $105,000 Smart MLS
- 2000-03-29 Listed $109,850 Smart MLS
Cash-flow waterfall
monthlySold comps — $/sqft
last 12 mo · ≤1 miLoading sold comps…