 🌊 Lakefront
726 S Camden Ave · Fruitland, MD
Flood risk 1/10 · Minimal
- FEMA flood zone
- X (unshaded)
- Chance of flooding over 30 yrs
- 0.0%
- Est. flood insurance / yr
- $507 – $1,088
Fire risk 4/10 · Minor
- Est. fire insurance / yr
- $755 – $1,403
Heat risk 8/10 · Major
- Hot days now (above 105°F)
- 7 days/yr
- Hot days in 30 yrs
- 16 days/yr
Wind risk 7/10 · Major
- Chance of severe wind over 30 yrs
- 78.0%
Air-quality risk 2/10 · Minimal
- Unhealthy air days now
- 2 days/yr
- Unhealthy air days in 30 yrs
- 2 days/yr
Risk factors via First Street. Map © Google.
Why this score? — see what drove the C- grade
The composite is a weighted blend of 9 inputs, each scored 0–100. Each bar is that input's sub-score; the figure is the points it added to the 100-point composite (weight × sub-score).
- Cash flow +16.5/30.0
- ARV discount +15.0/15.0
- DSCR +5.1/10.0
- 1% rule +4.5/10.0
- Livability +3.5/5.0
- Rent growth +2.5/5.0
- Condition / age +2.2/5.0
- Schools +1.9/10.0
- Appreciation +0.0/10.0
$200,000
🖨 Deal sheet (PDF) 📄 Offer letter ✓ Due diligence
Listing remarks
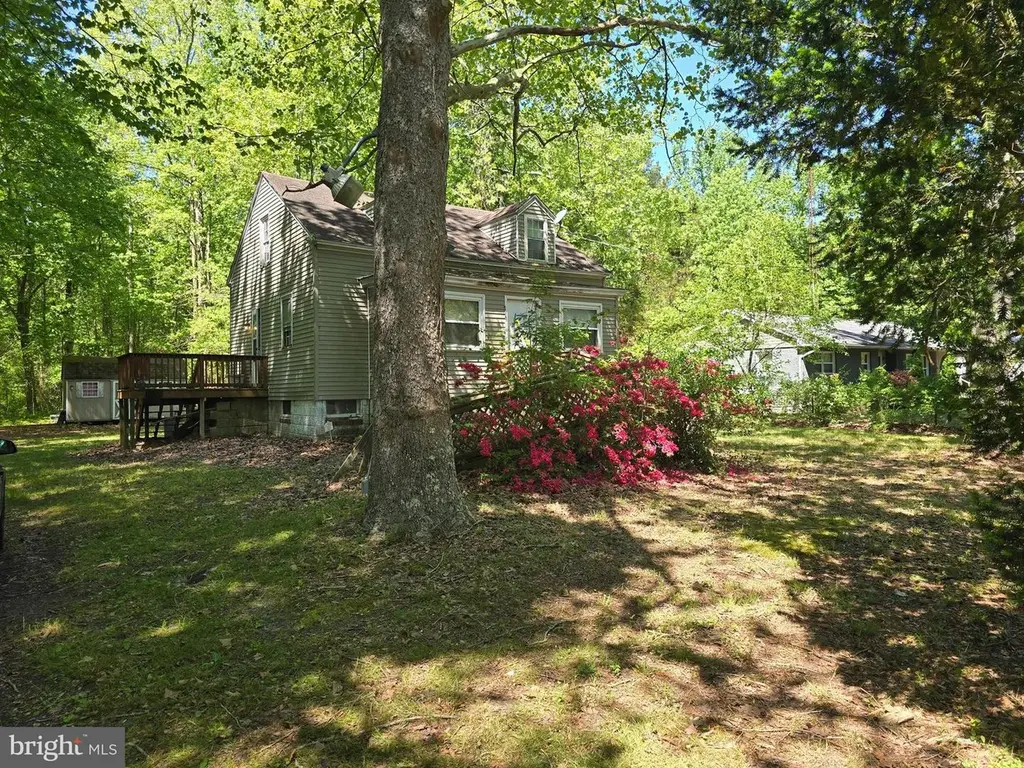
Discover a hidden gem with immense potential nestled on a sprawling 9.7-acre lot. This cottage-style home offers 1304 square feet of versatile living space, featuring three bedrooms and a full bath with tub shower, ideal for creating a cozy retreat. The kitchen, equipped with custom-made wood cabinets, appliances and an island, is a delightful hub for culinary creativity. The wood, vinyl and carpet floors, enhances the home's warmth atmosphere. The unfinished basement offers endless possibilities for expansion or additional storage, while the expansive rear yard, bordered by trees, provides a serene backdrop for outdoor activities or future development. With road frontage and a private sett
Key facts
- 9.7 acre lot
- Built 1937
- Listed 25 days
Property features AI
Exterior
- Parking: Off-street parking
- Utilities: Public water; Public sewer; Electric hot water
- Home design: Detached home; Stick-built frame construction; Level entry (main); Estimated year built
- Construction: Block foundation (permanent); Above- and below-grade structures
- Exterior features: Rear yard; Backs to trees; Private lot; Road frontage; Trees/wooded
Interior
- Kitchen: Kitchen with island and eat-in area
- Bedrooms: Two bedrooms on the upper level; One bedroom on the main level (entry level)
- Flooring: Wood flooring; Carpet; Vinyl
- Bathrooms: One full bathroom on the main level; One full bathroom total
- Heating & cooling: Window air conditioning units; Ceiling fans; Electric cooling
- Interior features: Open floor plan; Combination tub/shower; Kitchen island; Eat-in kitchen; Ceiling fans; Level entry; Drywall, plaster and paneled walls
- Laundry & utility: Basement with interior access and connecting stairway
Neighborhood map
What this means for you Summary
Snapshot
- This is a 3-bed/1.0-bath single-family listed at $200k. Condition is rated fair.
Deal economics
- At list price, monthly cash flow is $118 ($1k/yr) — positive.
- The deal already cash-flows at list — no discount required.
- To meet the 1% rule (rent ≥ 1% of price), the offer needs to be $190k (5.0% below list).
- Recommended offer: $190k (5.0% below list) — sets the bar for 1% rule.
- Cap rate 7.0% vs local median 3.8% in Fruitland — top-decile yield for the area; either an underpriced asset or a hidden risk that comps aren't pricing in. Stress-test before assuming the spread holds.
Location & tenants
- Location reads 70/100 on livability (#179 in MD) — a middle-class / working-renter tenant base. Strengths: cost of living A, housing A, health & safety A; Watch: amenities F, commute F, employment D-.
- Wicomico County Public Schools (urban): math 16% / reading 26% proficiency, ranked #19 of 24 in MD (top 79%) — low school quality limits family demand, transient renter base, plan for 1-2y turnover.
- Zoned schools: Fruitland Primary (475 students, 51% FRL); Bennett Middle (math 13% / reading 29%, grade F, #134 of 225 statewide, top 62%, 906 students, 48% FRL); James M. Bennett High (math 55% / reading 66%, grade C+, #71 of 222 statewide, top 32%, 1,343 students, 44% FRL).
- Zoned-school proficiency averages 41% at this address vs 21% district-wide (+20 pts) — the actual schools serving this property are materially stronger than the Wicomico County Public Schools average implies; a family-tenant draw the district grade alone would hide.
- Market conditions: 43 active listings in the ZIP; 6 comparable units currently listed for rent nearby; rentals lingering (median 46d on market — plan ~5-8 weeks vacancy on turnover, expect pricing pressure); 50% of comp listings sitting > 30 days — soft ceiling on asking rent; 278 units permitted in Wicomico County in 2024 (44 in 5+ unit buildings).
- This rent runs 35% of the median local income ($65k/yr) — at the standard rent-burdened threshold; future hikes will face affordability resistance.
Forward outlook
- Local home prices are declining (-3.0%/yr); year-one equity from $1k of loan paydown is wiped out by about $6k of value loss. Plan a longer hold.
- Wicomico County population projected at +14% by 2050 — modest demand growth; plan on rents tracking national, not racing it.
Negotiation context
- It's been on market 25 days — a 2% lower offer ($197k) is reasonable based on typical stale-listing flexibility.
Risks & watch-outs
- Watch-outs: built in 1937 — expect roof / HVAC / electrical / plumbing capex.
- Climate carrying-cost: major wind risk, 78% chance of damaging wind over 30y; extreme-heat days projected 7→16/yr by 2055 (HVAC capex compounding) — expect insurance premiums to compound above CPI over the hold.
Questions for the listing agent
- Have any recent inspections been done? Can we get a copy of the seller's disclosures and any deferred-maintenance estimates?
- Built in 1937 — when were the roof, HVAC, electrical panel, plumbing, and water heater last replaced?
- Is there a deadline driving the sale (1031 exchange, divorce, estate, relocation)? That informs how much negotiation room exists.
- Schools are D-rated, which usually means shorter tenancies and higher turnover. Who's the typical renter profile here, and what's been the actual vacancy rate?
- This sits on a lake — are riparian / water-frontage rights deeded with the parcel? Any dock permits, shoreline easements, or HOA water-use restrictions?
- What's the documented flood / surge / shoreline-erosion history here (FEMA AND non-FEMA — e.g., storm surge, creek backup, septic-field saturation)?
- Any water-quality or seasonal algae-bloom issues that affect tenant satisfaction or short-term-rental demand?
- What's the average days-on-market for RENTAL listings here right now (not sales)? A rising rental-DOM trend means longer vacancies and softer asking-rent achievability than the comps imply.
- What's the recent tenant-quality profile in this submarket — average credit score on applications, eviction rate, late-payment / NSF rate, and stable-employment percentage? A property-management company in the area should have these aggregated.
- How much new for-sale + rental construction is in the pipeline within 1–3 miles? Heavy new supply typically softens prices + rents 12–24 months out; constrained supply supports both.
Investment metrics
- 1% rule
- 0.95% ✗
- Cap rate
- 7.00%
- Cash-on-cash
- 2.53%
- DSCR
- 1.11
- GRM
- 8.8
CMA / ARV
- ARV (on-the-fly)
- $362,642
- Comps found
- 5
Show comp detail 5 sales within ~0.75 mi
| Address | Dist | Beds/Ba | Sqft | Sold | Price | $/sf | Match |
|---|---|---|---|---|---|---|---|
| 612 S Division St | 0.26mi | 3/2.0 | 1,344 (+3%) | 7mo | $255,000 | $190 | 73 |
| 28200 SW Allen Cut Off Rd SW | 0.35mi | 3/1.0 | 1,272 (-2%) | 12mo | $261,400 | $206 | 69 |
| 3963 Disharoon Rd | 0.64mi | 3/2.0 | 1,334 (+2%) | 5mo | $325,000 | $244 | 58 |
| 3967 Disharoon Rd | 0.67mi | 3/2.0 | 1,234 (-5%) | 15mo | $299,000 | $242 | 43 |
| 245 Sand Castle Blvd | 0.67mi | 3/2.0 | 1,456 (+12%) | 12mo | $85,000 | $58 | 35 |
Match score weights: distance 35% · size 25% · config 20% · recency 20%. Top-matched comps best support the ARV.
Projected returns pro-forma
-3.0% appreciation · 3.0% rent growth · sell at horizon
- IRR
- -12.3%
- Equity multiple
- 0.56×
- Total profit
- $-24,850
- Equity at exit
- $29,821
- IRR
- -3.2%
- Equity multiple
- 0.79×
- Total profit
- $-11,826
- Equity at exit
- $17,292
Cash invested: $56,000 (down + closing). Projections, not guarantees.
Landlord ↔ Tenant lean methodology
- Overall (STATE)
- 27 Tenant-Leaning
- State Maryland
- 27 Tenant-Leaning · D+14
- County
- — inherits STATE
- City
- — inherits STATE
ZIP-level market 21826
- Home prices YoY
- -7.6%
- Active inventory
- 43
- Price-to-rent
- 8.8×
Monthly cashflow live
- Estimated rent
- $1,899 high interval (Pro) →
- Mortgage (P&I)
- −$1,049
- Tax est. 1.5%
- −$250 /mo · $3,000/yr
- Insurance
- −$83
- HOA
- −$0
- Vacancy / Maint / Mgmt
- −$399
- Net cashflow
- $118
Break-even live
Sensitivity live
| Price | -10% $256 | -5% $187 | +0% $118 | +5% $49 | +10% $-20 |
|---|---|---|---|---|---|
| Rent | -10% $-32 | -5% $43 | +0% $118 | +5% $193 | +10% $268 |
| Rate | -1.0pp $219 | -0.5pp $169 | base $118 | +0.5pp $66 | +1.0pp $14 |
UW: 25.0% down · 7.5% · 30yr · 1.5% tax · 5.0% vac · 8.0% maint · 8.0% mgmt
Financing live
Cash to close
- Down payment
- $50,000
- Closing costs
- $6,000
- Reserves months
- —
- Total cash needed
- —
Loan-product check · same deal, 3 products live
Conventional
25% down · 7.5% · 30yr
- Down + closing
- —
- Monthly P&I
- —
- Monthly cashflow
- —
- DSCR
- —
- Eligible?
- —
Personal DTI + credit; lowest rate.
DSCR
20% down · 8.5% · 30yr
- Down + closing
- —
- Monthly P&I
- —
- Monthly cashflow
- —
- DSCR
- —
- Eligible?
- —
No personal income docs; deal must DSCR.
Hard money
10% down · 12.0% · 12mo
- Down + closing
- —
- Monthly P&I
- —
- Monthly cashflow
- —
- DSCR
- —
- Eligible?
- —
Short-term bridge; refi at stabilization.
Rent comps 6 comps
| Address | Beds | Baths | Sqft | Rent | $/sqft | DOM | Units | Dist |
|---|---|---|---|---|---|---|---|---|
| 234 Garrison Way Fruitland, MD | 3.0 | 3.0 | 1602 | $1,950 | $1.22 | 45d | 1 | 0.58mi |
| 234 Garrison Way Fruitland, MD | 3.0 | 2.5 | 1602 | $1,950 | $1.22 | 15d | 1 | 0.58mi |
| 234 Garrison Way Unit 1 Fruitland, MD | 3.0 | 2.5 | 1602 | $1,900 | $1.19 | 15d | 1 | 0.59mi |
| 103 W Main St Fruitland, MD | 2.0 | 1.0 | 1200 | $1,100 | $0.92 | 23d | 1 | 1.05mi |
| 732 Wye Oak Dr Fruitland, MD | 3.0 | 2.5 | 1396 | $2,300 | $1.65 | 45d | 1 | 1.26mi |
| 508 Hayward Ave Fruitland, MD | 2.0 | 1.0 | 992 | $1,450 | $1.46 | 45d | 1 | 1.48mi |
Listing history 10 events
-
2026-06-21days on market $200,000 Active 25 DOM
-
2026-06-18days on market $200,000 Active 22 DOM
-
2026-06-17days on market $200,000 Active 21 DOM
-
2026-06-16days on market $200,000 Active 20 DOM
-
2026-06-15days on market $200,000 Active 19 DOM
-
2026-06-14days on market $200,000 Active 17 DOM
-
2026-06-13days on market $200,000 Active 16 DOM
-
2026-06-10days on market $200,000 Active 14 DOM
-
2026-06-09remarks 699-char remark
-
2026-06-09$200,000 Active 13 DOM
ⓘ Source: listings_history table (triggers on properties + properties_extension) + one-shot
backfill from property_details.listing_events for pre-trigger history.
Climate risk First Street
- Flood 1/10 Low FEMA zone X (unshaded) · 0% chance over 30 yrs
- Wildfire 4/10 Moderate
- Heat 8/10 Severe 7 d/yr ≥105°F today · 16 d/yr by 30 yrs out
- Wind 7/10 Severe 78% chance of damaging wind over 30 yrs
- Air quality 2/10 Low 2 unhealthy d/yr today · 2 by 30 yrs out
Nearby sold comps map
Loading sold comps map…
Walkable amenities ~0.75 mi
Loading nearby amenities…
Taxation est. · year 1
- Rental income
- $22,791
- − Mortgage interest
- −$11,203
- − Property taxes
- −$3,000
- − Insurance
- −$1,000
- − Repairs & maintenance
- −$1,823
- − Management
- −$1,823
- − Depreciation
- −$5,818
- Taxable loss
- −$1,877
- Est. tax savings @ 24.0%
- +$451
- After-tax cash flow
- $1,869/yr
For passive investors: Depreciation is non-cash, so a rental often shows a tax loss while cash-flowing — sheltering income. Rental losses are passive: they offset passive income freely, and up to $25,000/yr can offset ordinary (W-2) income if you actively participate and your MAGI is under $100k (phasing out to $0 by $150k); unused losses carry forward. On sale, claimed depreciation is recaptured at up to 25%, and gains may owe capital-gains tax (a 1031 exchange can defer both). Figures are a year-1 estimate at your 24.0% rate — not tax advice; consult a CPA.
Condition & rehab AI · 5 photos
This single-family home requires moderate repairs and maintenance to improve its condition and value. Painting, landscaping, and window updates would significantly enhance its curb appeal and marketability.
Repairs flagged
- Moderate Siding and paint — Weathered and faded appearance.
- Minor Landscaping — Needs trimming and maintenance.
- Minor Windows — Appears functional but not new or well-maintained.
Value-add opportunities
- Both Painting and updating the exterior — Enhances curb appeal and value.
- Both Landscaping and trimming — Improves curb appeal and enhances property value.
- Both Reconditioning or replacing windows — Improves energy efficiency and property value.
Renovation cost estimate screening
| Repair item | Severity | Est. cost |
|---|---|---|
| Siding and paint · Weathered and faded appearance. | Moderate | $3,000–15,000 |
| Landscaping · Needs trimming and maintenance. | Minor | $500–3,000 |
| Windows · Appears functional but not new or well-maintained. | Minor | $500–3,000 |
| Total estimated repair cost · 3 items | $4,000–21,000 |
Value-add ROI direction
- Both Painting and updating the exterior — Enhances curb appeal and value. ↑
- Both Landscaping and trimming — Improves curb appeal and enhances property value. ↑
- Both Reconditioning or replacing windows — Improves energy efficiency and property value. ↑
ⓘ Cost ranges are severity-bucket heuristics (US national rule-of-thumb). Get contractor quotes + a written scope before underwriting a rehab budget.
Schools (NCES district)
- District
- Wicomico County Public Schools
- NCES district ID
- 2400690
- Math proficiency
- 16% ▼ -18.00%
- Reading proficiency
- 26% ▼ -13.00%
- Median HH income
- $51,745
- Composite
- 18.87/100
- National rank
- #8860
- State rank
- #19 of 24 in MD
Livability — Fruitland
- Score
- 70/100
- State rank
- #179
- US rank
- #7980
Category grades
Schools grade is shown separately in the Schools card above.
Census & demographics
- Census place
- Fruitland, MD
- County
- Wicomico County · 75,969 people
- City population
- 5,451
- Metro
- Salisbury, MD-DE
- Population (ZIP)
- 5,451
- Household income
- $64,946
- Rent vs Own
- Severe rent burden
- 294.0
Population outlook (Wicomico County) Hauer SSP2
- Today (2025)
- 108,548 people
- By 2030
- 111,783 · +3.0%
- By 2040
- 118,139 · +8.8%
- By 2050
- 123,641 · +13.9%
- By 2075
- 139,784 · +28.8%
- By 2100
- 145,334 · +33.9%
Race, ethnicity, and origin ACS 2023
- Neighborhood character
- Diverse neighborhood (Simpson 0.65)
- Race & ethnicity
- White 51% Black 27% Hispanic / Latino 14% Two or more races 11% Asian 3%
- Hispanic origin (detail)
- Puerto Rican 2% Dominican 3%
- Common ancestry
- Hispanic 2% Romanian 2% Lithuanian 2%
- Foreign-born
- 10% · Canada, China, South Korea
- Languages at home
- 77% English-only · Spanish 14% Other Asian/Pacific 4% Korean 1%
Political lean MEDSL · Wicomico
- 2024 margin
- Lean R (+5.5) · D 46.1% · R 51.5% · Other 2.4%
- 2008→2024 swing
- +0.3pp no change · 2008: -5.8pp · 2024: -5.5pp
- All cycles
- 2024: R+5.5 2020: R+1.9 2016: R+11.6 2012: R+6.9 2008: R+5.8
Not yet ingested
- Civics
- —
Market trends
- HPI YoY
- ▼ -19.52%
- Current HPI
- 236.5727
- Rent YoY
- —
- Metro
- Salisbury, MD-DE
- State GDP YoY
- ▲ 2.97%
- F500 in state
- 12
Industry mix (Fortune 500 HQ in MD)
| Industry | F500 HQs | Revenue |
|---|---|---|
| Aerospace / Defense | 1 | $71B |
|
||
| Utilities | 1 | $25B |
|
||
| Hotels | 1 | $24B |
|
||
| Consumer Goods | 1 | $7B |
|
||
| Real Estate | 1 | $6B |
|
||
| Chemicals | 1 | $2B |
|
||
Price history
1 event — show timeline
- 2026-05-27 Listed $200,000 BRIGHT MLS
Cash-flow waterfall
monthlySold comps — $/sqft
last 12 mo · ≤1 miLoading sold comps…